
Workflow Management Systems Market Analysis, Size, and Forecast 2026-2030: North America (US, Canada, and Mexico), APAC (China, Japan, and India), Europe (Germany, UK, and France), South America (Brazil, Argentina, and Chile), Middle East and Africa (UAE, Saudi Arabia, and South Africa), and Rest of World (ROW)

Workflow Management Systems Market Analysis, Size, and Forecast 2026-2030:
North America (US, Canada, and Mexico), APAC (China, Japan, and India), Europe (Germany, UK, and France), South America (Brazil, Argentina, and Chile), Middle East and Africa (UAE, Saudi Arabia, and South Africa), and Rest of World (ROW)

Published: Oct 2026 295 Pages SKU: IRTNTR75204

Market Overview at a Glance

$23.65 B
Market Opportunity
26.9%
CAGR 2025 - 2030
32.8%
APAC Growth
$6.31 B
On premise segment 2024

Workflow Management Systems Market Size 2026-2030

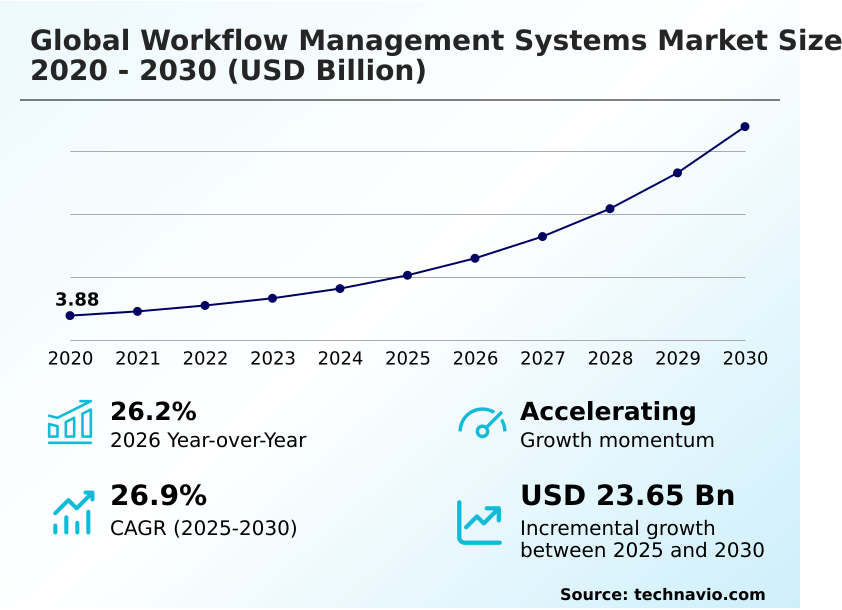
The workflow management systems market size is valued to increase by USD 23.65 billion, at a CAGR of 26.9% from 2025 to 2030. Rapid proliferation of hybrid and decentralized workforce models will drive the workflow management systems market.

Major Market Trends & Insights

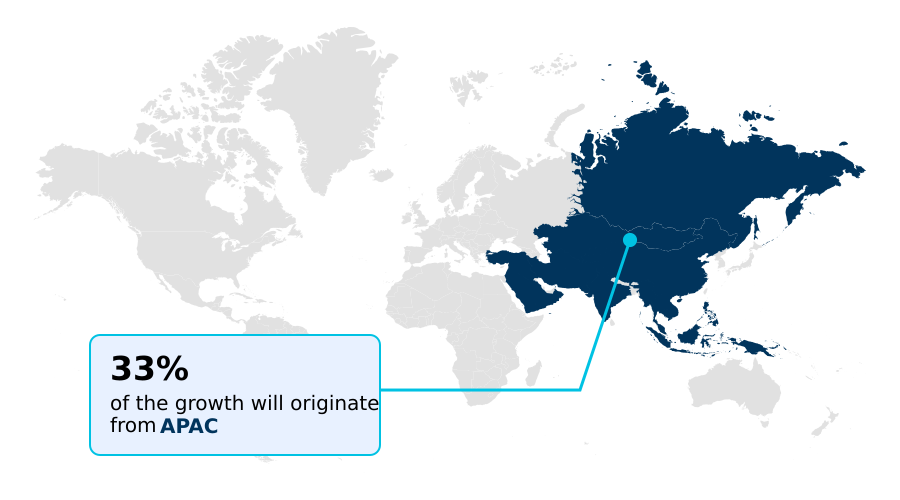
  • APAC dominated the market and accounted for a 32.8% growth during the forecast period.
  • By Deployment - On premise segment was valued at USD 6.31 billion in 2024
  • By End-user - BFSI segment accounted for the largest market revenue share in 2024

Market Size & Forecast

  • Market Opportunities: USD 30.07 billion
  • Market Future Opportunities: USD 23.65 billion
  • CAGR from 2025 to 2030 : 26.9%

Market Summary

  • The Workflow Management Systems Market demonstrates robust expansion as enterprise organizations permanently transition toward decentralized operational structures. Corporate teams navigating complex supply chain logistics rely heavily on these centralized platforms to coordinate international vendor shipments, track customs documentation, and trigger automated warehouse receiving protocols.
  • The implementation of advanced task orchestration software has reduced manual processing cycle times by 40% compared to traditional email-based coordination methods. The rapid proliferation of hybrid workforce models serves as a primary driver, compelling business leaders to digitize operational processes to maintain uninterrupted service delivery across dispersed geographical regions.
  • Conversely, establishing seamless end-to-end process orchestrations is severely challenged by fragmented multi-cloud infrastructure and legacy technical dependencies. Integrating modern cloud platforms with outdated mainframe databases often requires brittle custom application programming interfaces, which frequently break during system updates and cause significant data synchronization bottlenecks.
  • Overcoming these technical integration hurdles requires substantial capital investment in robust middleware engineering to ensure continuous operational visibility.

What will be the Size of the Workflow Management Systems Market during the forecast period?
Get Key Insights on Market Forecast (PDF) Get Free Sample

How is the Workflow Management Systems Market Segmented?

The workflow management systems industry research report provides comprehensive data (region-wise segment analysis), with forecasts and estimates in "USD million" for the period 2026-2030, as well as historical data from 2020-2024 for the following segments.

  • Deployment
    • On premise
    • Cloud
  • End-user
    • BFSI
    • Government
    • Healthcare
    • Legal
    • Others
  • Component
    • Software
    • Services
  • Geography
    • North America
      • US
      • Canada
      • Mexico
    • APAC
      • China
      • Japan
      • India
      • South Korea
      • Australia
      • Indonesia
    • Europe
      • Germany
      • UK
      • France
      • Italy
      • Spain
      • The Netherlands
    • South America
      • Brazil
      • Argentina
      • Chile
    • Middle East and Africa
      • UAE
      • Saudi Arabia
      • South Africa
      • Israel
      • Turkey

By Deployment Insights

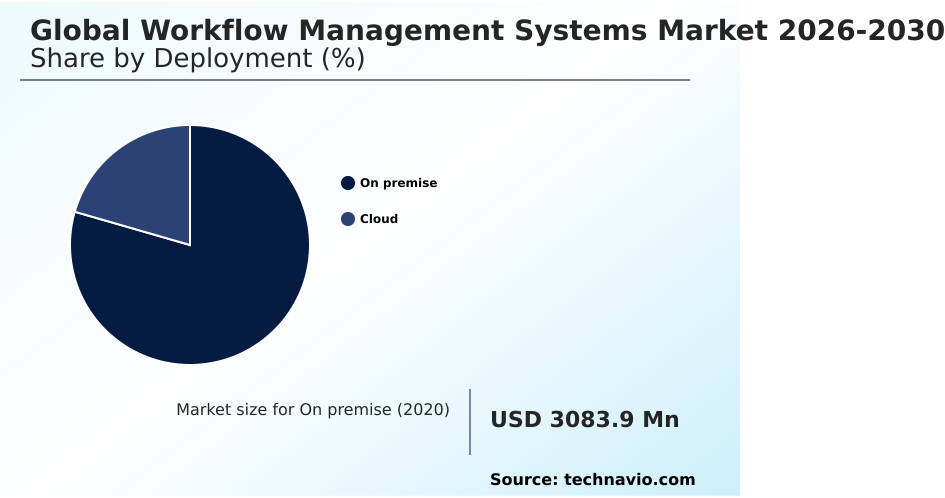
The on premise segment is estimated to witness significant growth during the forecast period.

Legacy system integration within local enterprise firewalls remains a critical requirement for organizations prioritizing strict data sovereignty and operational control.

By avoiding a multi-tenant hybrid work environment, organizations utilizing localized business process automation can achieve enhanced cross departmental visibility over highly sensitive workflows.

Maintaining direct control over a restful api connection and data schema translation allows enterprises to minimize the risk of a severe data synchronization bottleneck.

This localized approach to middleware engineering protocol implementation directly mitigates the platform maintenance expense associated with complex cross system alignment. Deploying localized infrastructure has been shown to boost error detection efficiency by 15% compared to dispersed cloud environments.

Such deployments ensure consistent execution speeds, eliminating the unpredictable latency variations found in external hosted architectures.
Get Free Sample

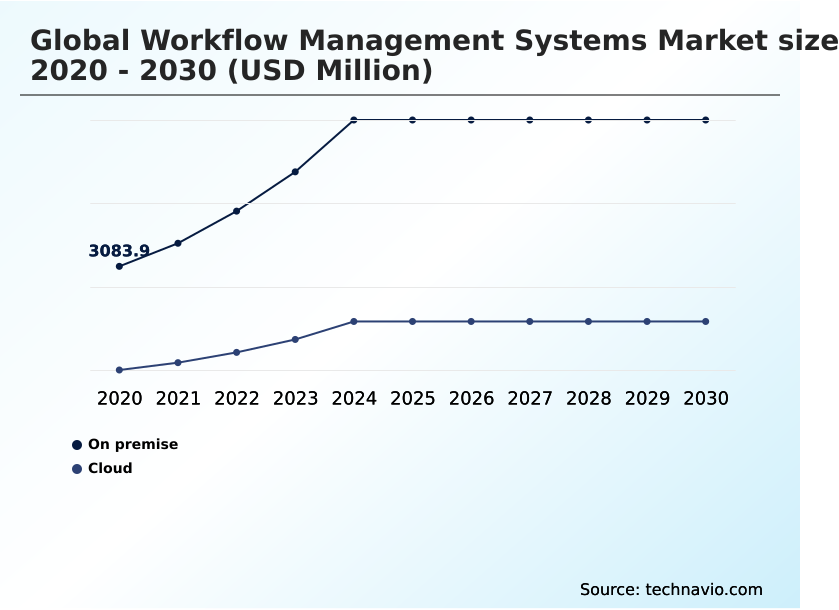
The On premise segment was valued at USD 6.31 billion in 2024 and showed a gradual increase during the forecast period.
Get Free Sample

Regional Analysis

APAC is estimated to contribute 32.8% to the growth of the global market during the forecast period.Technavio’s analysts have elaborately explained the regional trends and drivers that shape the market during the forecast period.
See How Workflow Management Systems Market Demand is Rising in APAC Get Free Sample

The adoption landscape for workflow orchestration varies significantly between North America and APAC due to distinct infrastructure maturity levels.

Organizations in North America heavily utilize a low code application platform combined with intelligent document processing to optimize regulatory compliance, reducing document review times by 28%.

Meanwhile, the APAC region experiences a rapid surge in robotic process automation deployment, yielding a 35% improvement in manufacturing supply chain coordination.

The integration of a natural language prompt interface allows business users in both regions to configure an automated maker checker system without complex coding.

Financial institutions increasingly rely on a structured fraud investigation pathway powered by algorithmic risk management, which has decreased false-positive compliance alerts by 22%.

By implementing an adaptive business rule framework with strict role based access, multinational corporations ensure consistent operational governance across these diverse regulatory environments.

Market Dynamics

Our researchers analyzed the data with 2025 as the base year, along with the key drivers, trends, and challenges. A holistic analysis of drivers will help companies refine their marketing strategies to gain a competitive advantage.

  • The continuous evolution of enterprise administration relies heavily on the deployment of an intelligent robotic process automation tool to streamline repetitive administrative tasks and eliminate manual data entry errors. As organizations transition toward highly distributed operational models, the reliance on autonomous ai agent task routing has become essential for managing complex service requests without human intervention.
  • This shift in operational strategy allows supply chain planners to coordinate international shipments and track inventory fluctuations with unprecedented precision, improving overall delivery reliability by a margin of 20% over traditional spreadsheet-based tracking methods.
  • Furthermore, the integration of a low code visual workflow builder empowers non-technical business managers to design and deploy custom operational protocols rapidly, significantly reducing the dependency on specialized IT engineering teams. When attempting to modernize outdated financial infrastructure, organizations frequently utilize legacy enterprise resource planning integration to ensure continuous data flow between mainframe databases and modern cloud applications.
  • The strategic application of a predictive ai resource allocation algorithm further optimizes workforce productivity by anticipating peak demand periods and automatically assigning tasks to available personnel based on real-time capacity metrics. These combined technological capabilities ensure that complex business processes remain resilient, compliant, and highly efficient across a diverse range of industry verticals.
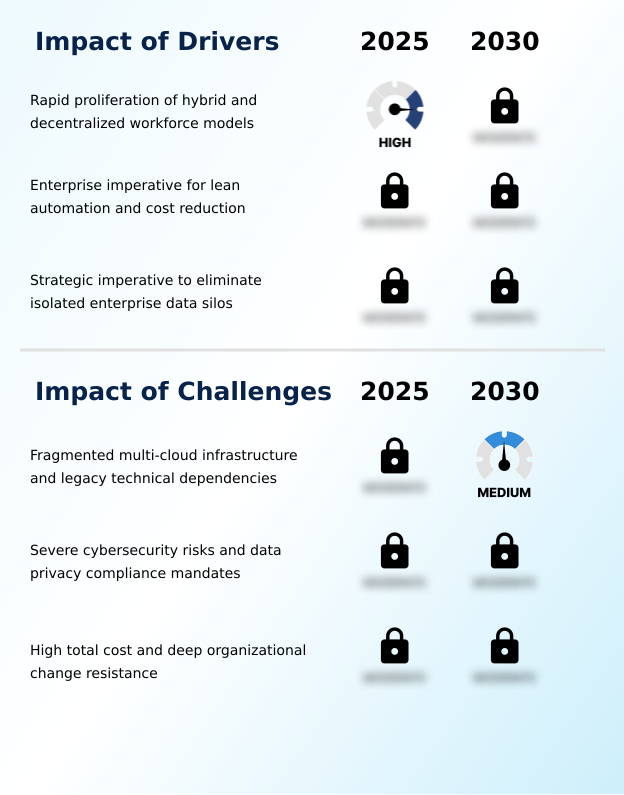
What are the key market drivers leading to the rise in the adoption of Workflow Management Systems Industry?

  • The rapid proliferation of hybrid and decentralized workforce models serves as a primary catalyst accelerating the adoption of centralized operational orchestration software.

  • The permanent shift toward distributed workforces necessitates the deployment of a unified digital task board to maintain uninterrupted operational visibility.
  • Organizations utilizing automated milestone tracking have successfully reduced project delivery delays by 30%, ensuring cross-functional teams remain aligned across different time zones.
  • Implementing dynamic resource allocation allows management to distribute assignments based on real-time capacity, which has improved overall employee productivity by 22%. Furthermore, the transition to secure electronic form routing eliminates the administrative friction associated with manual document approvals.
  • By leveraging a sophisticated task allocation algorithm, businesses can autonomously route complex work items to the most qualified personnel.
  • Features such as automated standup summary generation and continuous compliance rule enforcement are critical for sustaining high-performance remote operations without increasing administrative overhead.

What are the market trends shaping the Workflow Management Systems Industry?

  • The mainstream integration of generative artificial intelligence and autonomous software agents represents a defining industry trend. This technological shift fundamentally transforms how operational tasks are routed and executed within modern business environments.

  • The transition toward a highly responsive event driven architecture fundamentally alters how enterprise systems process real-time operational data. By deploying a sophisticated machine learning orchestrator, organizations can continuously analyze vast datasets to identify processing bottlenecks before they escalate. The deep integration of generative artificial intelligence enables platforms to draft complex project briefs autonomously, reducing initial planning phases by 40%.
  • Leveraging predictive resource allocation ensures that critical team workloads are distributed optimally, improving overall workforce utilization by 25%. This evolution toward autonomous task execution allows platforms to handle routine administrative duties without human supervision. Furthermore, the implementation of context aware automation enables systems to adjust routing parameters dynamically based on specific compliance requirements.
  • Conducting an automated workflow health check regularly has decreased system downtime by 18%, maintaining continuous operational alignment.

What challenges does the Workflow Management Systems Industry face during its growth?

  • Fragmented multi-cloud infrastructure and legacy technical dependencies severely impede the seamless integration and execution of automated processes across disparate enterprise environments.

  • Unifying legacy enterprise applications with modern multi cloud infrastructure introduces severe technical friction that frequently disrupts automated operational pipelines. While a sophisticated process mining algorithm can identify inefficiencies, translating these insights into actionable improvements remains difficult due to fragile backend connections.
  • Integrating a cloud native microservice with outdated mainframe databases often results in transactional data exchange bottlenecks, increasing system latency by 25%. The lack of accurate graphical process mapping and project risk anticipation prevents management from proactively addressing operational delays before they escalate.
  • Furthermore, inadequate resource constraint flagging and poor project handoff streamlining can lead to unexpected workforce shortages, lowering overall service delivery efficiency by 15%. Achieving seamless end to end orchestration requires substantial middleware engineering to ensure secure data connectivity, draining critical capital away from strategic business initiatives.

Exclusive Technavio Analysis on Customer Landscape

The workflow management systems market forecasting report includes the adoption lifecycle of the market, covering from the innovator’s stage to the laggard’s stage. It focuses on adoption rates in different regions based on penetration. Furthermore, the workflow management systems market report also includes key purchase criteria and drivers of price sensitivity to help companies evaluate and develop their market growth analysis strategies.
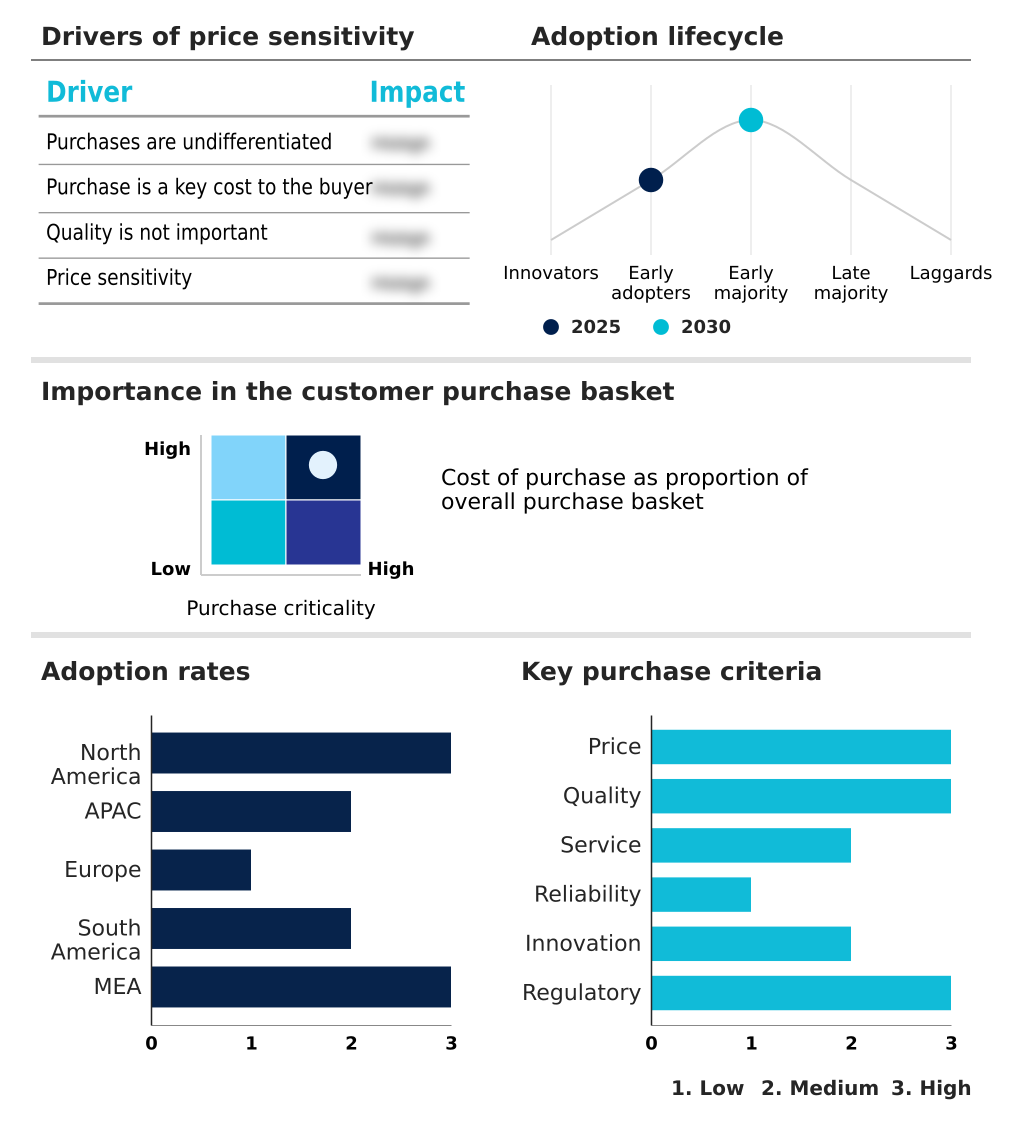
Customer Landscape of Workflow Management Systems Industry

Competitive Landscape

Companies are implementing various strategies, such as strategic alliances, workflow management systems market forecast, partnerships, mergers and acquisitions, geographical expansion, and product/service launches, to enhance their presence in the industry.

Appian Corp. - An enterprise-grade workflow management system provides a comprehensive low-code automation platform, enabling organizations to build digital processes, optimize business operations, and deploy secure applications efficiently.

The industry research and growth report includes detailed analyses of the competitive landscape of the market and information about key companies, including:

  • Appian Corp.
  • Asana Inc.
  • Bizagi Group Ltd.
  • Camunda Services GmbH
  • ClickUp
  • Creatio Ltd.
  • IBM Corp.
  • Kissflow Inc.
  • Laserfiche
  • Microsoft Corp.
  • monday.com Ltd.
  • Nintex Global Ltd.
  • Oracle Corp.
  • Pegasystems Inc.
  • Salesforce Inc.
  • SAP SE
  • ServiceNow Inc.
  • Smartsheet Inc.
  • UiPath Inc.
  • Zoho Corp. Pvt. Ltd.

Qualitative and quantitative analysis of companies has been conducted to help clients understand the wider business environment as well as the strengths and weaknesses of key industry players. Data is qualitatively analyzed to categorize companies as pure play, category-focused, industry-focused, and diversified; it is quantitatively analyzed to categorize companies as dominant, leading, strong, tentative, and weak.

Recent Development and News in Workflow management systems market

  • In the Systems Software industry, the widespread adoption of zero-trust security architectures has forced infrastructure developers to mandate strict continuous authentication protocols, directly impacting Workflow Management Systems demand by necessitating upgraded secure task routing capabilities.
  • The implementation of the European Union General Data Protection Regulation data localization mandates has restricted cross-border data transfers, compelling enterprise users to acquire localized Workflow Management Systems to ensure compliant operational governance.
  • The transition toward composable microservices has fragmented monolithic applications into distributed components, accelerating Workflow Management Systems adoption to provide unified end-to-end orchestration across these dispersed software modules.
  • The escalating compute costs associated with large language model training have driven organizations to optimize operational efficiency, increasing investments in Workflow Management Systems to reduce administrative overhead by 22% through algorithmic task allocation.

Dive into Technavio’s robust research methodology, blending expert interviews, extensive data synthesis, and validated models for unparalleled Workflow Management Systems Market insights. See full methodology.

Market Scope
Page number 295
Base year 2025
Historic period 2020-2024
Forecast period 2026-2030
Growth momentum & CAGR Accelerate at a CAGR of 26.9%
Market growth 2026-2030 USD 23647.1 million
Market structure Fragmented
YoY growth 2025-2026(%) 26.2%
Key countries US, Canada, Mexico, China, Japan, India, South Korea, Australia, Indonesia, Germany, UK, France, Italy, Spain, The Netherlands, Brazil, Argentina, Chile, UAE, Saudi Arabia, South Africa, Israel and Turkey
Competitive landscape Leading Companies, Market Positioning of Companies, Competitive Strategies, and Industry Risks

Request Free Sample

Research Analyst Overview

  • Executive leadership teams are systematically restructuring their strategic budgeting decisions to prioritize the widespread implementation of advanced business process automation capabilities. The transition from monolithic software systems toward a highly responsive event driven architecture allows organizations to optimize complex supply chain logistics and eliminate operational friction.
  • Boardrooms now recognize that investing in a robust application programming interface is essential for maintaining strict regulatory compliance and ensuring secure data governance across fragmented enterprise networks. Furthermore, the deployment of a sophisticated machine learning orchestrator provides granular visibility into transactional workflows, enabling companies to reduce administrative processing times by 35% compared to legacy manual oversight frameworks.
  • The integration of generative artificial intelligence natively within operational platforms allows users to map and execute tasks with unprecedented speed and accuracy. Utilizing predictive resource allocation ensures that critical enterprise workloads are dynamically assigned based on real-time personnel availability and skill set parameters.
  • These technological implementations fundamentally reshape how modern organizations govern their daily operations, driving sustained productivity and resilient service delivery.

What are the Key Data Covered in this Workflow Management Systems Market Research and Growth Report?

  • What is the expected growth of the Workflow Management Systems Market between 2026 and 2030?

    • USD 23.65 billion, at a CAGR of 26.9%

  • What segmentation does the market report cover?

    • The report is segmented by Deployment (On premise, and Cloud), End-user (BFSI, Government, Healthcare, Legal, and Others), Component (Software, and Services) and Geography (North America, APAC, Europe, South America, Middle East and Africa)

  • Which regions are analyzed in the report?

    • North America, APAC, Europe, South America and Middle East and Africa

  • What are the key growth drivers and market challenges?

    • Rapid proliferation of hybrid and decentralized workforce models, Fragmented multi-cloud infrastructure and legacy technical dependencies

  • Who are the major players in the Workflow Management Systems Market?

    • Appian Corp., Asana Inc., Bizagi Group Ltd., Camunda Services GmbH, ClickUp, Creatio Ltd., IBM Corp., Kissflow Inc., Laserfiche, Microsoft Corp., monday.com Ltd., Nintex Global Ltd., Oracle Corp., Pegasystems Inc., Salesforce Inc., SAP SE, ServiceNow Inc., Smartsheet Inc., UiPath Inc. and Zoho Corp. Pvt. Ltd.

Market Research Insights

  • The modern enterprise infrastructure increasingly prioritizes resilient operational orchestration to sustain consistent enterprise service delivery across diverse geographical boundaries. Operating within a permanent hybrid work environment requires robust technological frameworks to facilitate seamless decentralized workforce coordination. Organizations implementing advanced task routing software have improved cross-functional productivity by 30% compared to traditional manual oversight methods.
  • By replacing scattered emails with a unified digital communication channel, corporations have successfully lowered administrative coordination friction by 18%. These automated process engines eliminate any operational blind spot, ensuring that critical business tasks are executed with maximum efficiency and strict adherence to internal compliance standards.

We can help! Our analysts can customize this workflow management systems market research report to meet your requirements.

Get in touch

1. Executive Summary

1.1 Market overview

Executive Summary - Chart on Market Overview
Executive Summary - Data Table on Market Overview
Executive Summary - Chart on Global Market Characteristics
Executive Summary - Chart on Market by Geography
Executive Summary - Chart on Market Segmentation by Deployment
Executive Summary - Chart on Market Segmentation by End-user
Executive Summary - Chart on Market Segmentation by Component
Executive Summary - Chart on Incremental Growth
Executive Summary - Data Table on Incremental Growth
Executive Summary - Chart on Company Market Positioning

2. Technavio Analysis

2.1 Analysis of price sensitivity, lifecycle, customer purchase basket, adoption rates, and purchase criteria

2.2 Criticality of inputs and Factors of differentiation

Chart on Overview on criticality of inputs and factors of differentiation

2.3 Factors of disruption

Chart on Overview on factors of disruption

2.4 Impact of drivers and challenges

Chart on Impact of drivers and challenges in 2025 and 2030

3. Market Landscape

3.1 Market ecosystem

Chart on Parent Market
Data Table on - Parent Market

3.2 Market characteristics

Chart on Market characteristics analysis

3.3 Value chain analysis

Chart on Value chain analysis

4. Market Sizing

4.1 Market definition

Data Table on Offerings of companies included in the market definition

4.2 Market segment analysis

Market segments

4.3 Market size 2025

4.4 Market outlook: Forecast for 2025-2030

Chart on Global - Market size and forecast 2025-2030 ($ million)
Data Table on Global - Market size and forecast 2025-2030 ($ million)
Chart on Global Market: Year-over-year growth 2025-2030 (%)
Data Table on Global Market: Year-over-year growth 2025-2030 (%)

5. Historic Market Size

5.1 Global Workflow Management Systems Market 2020 - 2024

Historic Market Size - Data Table on Global Workflow Management Systems Market 2020 - 2024 ($ million)

5.2 Deployment segment analysis 2020 - 2024

Historic Market Size - Deployment Segment 2020 - 2024 ($ million)

5.3 End-user segment analysis 2020 - 2024

Historic Market Size - End-user Segment 2020 - 2024 ($ million)

5.4 Component segment analysis 2020 - 2024

Historic Market Size - Component Segment 2020 - 2024 ($ million)

5.5 Geography segment analysis 2020 - 2024

Historic Market Size - Geography Segment 2020 - 2024 ($ million)

5.6 Country segment analysis 2020 - 2024

Historic Market Size - Country Segment 2020 - 2024 ($ million)

6. Qualitative Analysis

6.1 Impact of AI on global workflow management systems market

6.2 Impact of geopolitical conflicts on global workflow management systems market

7. Five Forces Analysis

7.1 Five forces summary

Five forces analysis - Comparison between 2025 and 2030

7.2 Bargaining power of buyers

Bargaining power of buyers - Impact of key factors 2025 and 2030

7.3 Bargaining power of suppliers

Bargaining power of suppliers - Impact of key factors in 2025 and 2030

7.4 Threat of new entrants

Threat of new entrants - Impact of key factors in 2025 and 2030

7.5 Threat of substitutes

Threat of substitutes - Impact of key factors in 2025 and 2030

7.6 Threat of rivalry

Threat of rivalry - Impact of key factors in 2025 and 2030

7.7 Market condition

Chart on Market condition - Five forces 2025 and 2030

8. Market Segmentation by Deployment

8.1 Market segments

Chart on Deployment - Market share 2025-2030 (%)
Data Table on Deployment - Market share 2025-2030 (%)

8.2 Comparison by Deployment

Chart on Comparison by Deployment
Data Table on Comparison by Deployment

8.3 On premise - Market size and forecast 2025-2030

Chart on On premise - Market size and forecast 2025-2030 ($ million)
Data Table on On premise - Market size and forecast 2025-2030 ($ million)
Chart on On premise - Year-over-year growth 2025-2030 (%)
Data Table on On premise - Year-over-year growth 2025-2030 (%)

8.4 Cloud - Market size and forecast 2025-2030

Chart on Cloud - Market size and forecast 2025-2030 ($ million)
Data Table on Cloud - Market size and forecast 2025-2030 ($ million)
Chart on Cloud - Year-over-year growth 2025-2030 (%)
Data Table on Cloud - Year-over-year growth 2025-2030 (%)

8.5 Market opportunity by Deployment

Market opportunity by Deployment ($ million)
Data Table on Market opportunity by Deployment ($ million)

9. Market Segmentation by End-user

9.1 Market segments

Chart on End-user - Market share 2025-2030 (%)
Data Table on End-user - Market share 2025-2030 (%)

9.2 Comparison by End-user

Chart on Comparison by End-user
Data Table on Comparison by End-user

9.3 BFSI - Market size and forecast 2025-2030

Chart on BFSI - Market size and forecast 2025-2030 ($ million)
Data Table on BFSI - Market size and forecast 2025-2030 ($ million)
Chart on BFSI - Year-over-year growth 2025-2030 (%)
Data Table on BFSI - Year-over-year growth 2025-2030 (%)

9.4 Government - Market size and forecast 2025-2030

Chart on Government - Market size and forecast 2025-2030 ($ million)
Data Table on Government - Market size and forecast 2025-2030 ($ million)
Chart on Government - Year-over-year growth 2025-2030 (%)
Data Table on Government - Year-over-year growth 2025-2030 (%)

9.5 Healthcare - Market size and forecast 2025-2030

Chart on Healthcare - Market size and forecast 2025-2030 ($ million)
Data Table on Healthcare - Market size and forecast 2025-2030 ($ million)
Chart on Healthcare - Year-over-year growth 2025-2030 (%)
Data Table on Healthcare - Year-over-year growth 2025-2030 (%)

9.6 Legal - Market size and forecast 2025-2030

Chart on Legal - Market size and forecast 2025-2030 ($ million)
Data Table on Legal - Market size and forecast 2025-2030 ($ million)
Chart on Legal - Year-over-year growth 2025-2030 (%)
Data Table on Legal - Year-over-year growth 2025-2030 (%)

9.7 Others - Market size and forecast 2025-2030

Chart on Others - Market size and forecast 2025-2030 ($ million)
Data Table on Others - Market size and forecast 2025-2030 ($ million)
Chart on Others - Year-over-year growth 2025-2030 (%)
Data Table on Others - Year-over-year growth 2025-2030 (%)

9.8 Market opportunity by End-user

Market opportunity by End-user ($ million)
Data Table on Market opportunity by End-user ($ million)

10. Market Segmentation by Component

10.1 Market segments

Chart on Component - Market share 2025-2030 (%)
Data Table on Component - Market share 2025-2030 (%)

10.2 Comparison by Component

Chart on Comparison by Component
Data Table on Comparison by Component

10.3 Software - Market size and forecast 2025-2030

Chart on Software - Market size and forecast 2025-2030 ($ million)
Data Table on Software - Market size and forecast 2025-2030 ($ million)
Chart on Software - Year-over-year growth 2025-2030 (%)
Data Table on Software - Year-over-year growth 2025-2030 (%)

10.4 Services - Market size and forecast 2025-2030

Chart on Services - Market size and forecast 2025-2030 ($ million)
Data Table on Services - Market size and forecast 2025-2030 ($ million)
Chart on Services - Year-over-year growth 2025-2030 (%)
Data Table on Services - Year-over-year growth 2025-2030 (%)

10.5 Market opportunity by Component

Market opportunity by Component ($ million)
Data Table on Market opportunity by Component ($ million)

11. Customer Landscape

11.1 Customer landscape overview

Analysis of price sensitivity, lifecycle, customer purchase basket, adoption rates, and purchase criteria

12. Geographic Landscape

12.1 Geographic segmentation

Chart on Market share by geography 2025-2030 (%)
Data Table on Market share by geography 2025-2030 (%)

12.2 Geographic comparison

Chart on Geographic comparison
Data Table on Geographic comparison

12.3 North America - Market size and forecast 2025-2030

Chart on North America - Market size and forecast 2025-2030 ($ million)
Data Table on North America - Market size and forecast 2025-2030 ($ million)
Chart on North America - Year-over-year growth 2025-2030 (%)
Data Table on North America - Year-over-year growth 2025-2030 (%)
Chart on Regional Comparison - North America
Data Table on Regional Comparison - North America

12.3.1 US - Market size and forecast 2025-2030

Chart on US - Market size and forecast 2025-2030 ($ million)
Data Table on US - Market size and forecast 2025-2030 ($ million)
Chart on US - Year-over-year growth 2025-2030 (%)
Data Table on US - Year-over-year growth 2025-2030 (%)

12.3.2 Canada - Market size and forecast 2025-2030

Chart on Canada - Market size and forecast 2025-2030 ($ million)
Data Table on Canada - Market size and forecast 2025-2030 ($ million)
Chart on Canada - Year-over-year growth 2025-2030 (%)
Data Table on Canada - Year-over-year growth 2025-2030 (%)

12.3.3 Mexico - Market size and forecast 2025-2030

Chart on Mexico - Market size and forecast 2025-2030 ($ million)
Data Table on Mexico - Market size and forecast 2025-2030 ($ million)
Chart on Mexico - Year-over-year growth 2025-2030 (%)
Data Table on Mexico - Year-over-year growth 2025-2030 (%)

12.4 APAC - Market size and forecast 2025-2030

Chart on APAC - Market size and forecast 2025-2030 ($ million)
Data Table on APAC - Market size and forecast 2025-2030 ($ million)
Chart on APAC - Year-over-year growth 2025-2030 (%)
Data Table on APAC - Year-over-year growth 2025-2030 (%)
Chart on Regional Comparison - APAC
Data Table on Regional Comparison - APAC

12.4.1 China - Market size and forecast 2025-2030

Chart on China - Market size and forecast 2025-2030 ($ million)
Data Table on China - Market size and forecast 2025-2030 ($ million)
Chart on China - Year-over-year growth 2025-2030 (%)
Data Table on China - Year-over-year growth 2025-2030 (%)

12.4.2 Japan - Market size and forecast 2025-2030

Chart on Japan - Market size and forecast 2025-2030 ($ million)
Data Table on Japan - Market size and forecast 2025-2030 ($ million)
Chart on Japan - Year-over-year growth 2025-2030 (%)
Data Table on Japan - Year-over-year growth 2025-2030 (%)

12.4.3 India - Market size and forecast 2025-2030

Chart on India - Market size and forecast 2025-2030 ($ million)
Data Table on India - Market size and forecast 2025-2030 ($ million)
Chart on India - Year-over-year growth 2025-2030 (%)
Data Table on India - Year-over-year growth 2025-2030 (%)

12.4.4 South Korea - Market size and forecast 2025-2030

Chart on South Korea - Market size and forecast 2025-2030 ($ million)
Data Table on South Korea - Market size and forecast 2025-2030 ($ million)
Chart on South Korea - Year-over-year growth 2025-2030 (%)
Data Table on South Korea - Year-over-year growth 2025-2030 (%)

12.4.5 Australia - Market size and forecast 2025-2030

Chart on Australia - Market size and forecast 2025-2030 ($ million)
Data Table on Australia - Market size and forecast 2025-2030 ($ million)
Chart on Australia - Year-over-year growth 2025-2030 (%)
Data Table on Australia - Year-over-year growth 2025-2030 (%)

12.4.6 Indonesia - Market size and forecast 2025-2030

Chart on Indonesia - Market size and forecast 2025-2030 ($ million)
Data Table on Indonesia - Market size and forecast 2025-2030 ($ million)
Chart on Indonesia - Year-over-year growth 2025-2030 (%)
Data Table on Indonesia - Year-over-year growth 2025-2030 (%)

12.5 Europe - Market size and forecast 2025-2030

Chart on Europe - Market size and forecast 2025-2030 ($ million)
Data Table on Europe - Market size and forecast 2025-2030 ($ million)
Chart on Europe - Year-over-year growth 2025-2030 (%)
Data Table on Europe - Year-over-year growth 2025-2030 (%)
Chart on Regional Comparison - Europe
Data Table on Regional Comparison - Europe

12.5.1 Germany - Market size and forecast 2025-2030

Chart on Germany - Market size and forecast 2025-2030 ($ million)
Data Table on Germany - Market size and forecast 2025-2030 ($ million)
Chart on Germany - Year-over-year growth 2025-2030 (%)
Data Table on Germany - Year-over-year growth 2025-2030 (%)

12.5.2 UK - Market size and forecast 2025-2030

Chart on UK - Market size and forecast 2025-2030 ($ million)
Data Table on UK - Market size and forecast 2025-2030 ($ million)
Chart on UK - Year-over-year growth 2025-2030 (%)
Data Table on UK - Year-over-year growth 2025-2030 (%)

12.5.3 France - Market size and forecast 2025-2030

Chart on France - Market size and forecast 2025-2030 ($ million)
Data Table on France - Market size and forecast 2025-2030 ($ million)
Chart on France - Year-over-year growth 2025-2030 (%)
Data Table on France - Year-over-year growth 2025-2030 (%)

12.5.4 Italy - Market size and forecast 2025-2030

Chart on Italy - Market size and forecast 2025-2030 ($ million)
Data Table on Italy - Market size and forecast 2025-2030 ($ million)
Chart on Italy - Year-over-year growth 2025-2030 (%)
Data Table on Italy - Year-over-year growth 2025-2030 (%)

12.5.5 Spain - Market size and forecast 2025-2030

Chart on Spain - Market size and forecast 2025-2030 ($ million)
Data Table on Spain - Market size and forecast 2025-2030 ($ million)
Chart on Spain - Year-over-year growth 2025-2030 (%)
Data Table on Spain - Year-over-year growth 2025-2030 (%)

12.5.6 The Netherlands - Market size and forecast 2025-2030

Chart on The Netherlands - Market size and forecast 2025-2030 ($ million)
Data Table on The Netherlands - Market size and forecast 2025-2030 ($ million)
Chart on The Netherlands - Year-over-year growth 2025-2030 (%)
Data Table on The Netherlands - Year-over-year growth 2025-2030 (%)

12.6 South America - Market size and forecast 2025-2030

Chart on South America - Market size and forecast 2025-2030 ($ million)
Data Table on South America - Market size and forecast 2025-2030 ($ million)
Chart on South America - Year-over-year growth 2025-2030 (%)
Data Table on South America - Year-over-year growth 2025-2030 (%)
Chart on Regional Comparison - South America
Data Table on Regional Comparison - South America

12.6.1 Brazil - Market size and forecast 2025-2030

Chart on Brazil - Market size and forecast 2025-2030 ($ million)
Data Table on Brazil - Market size and forecast 2025-2030 ($ million)
Chart on Brazil - Year-over-year growth 2025-2030 (%)
Data Table on Brazil - Year-over-year growth 2025-2030 (%)

12.6.2 Argentina - Market size and forecast 2025-2030

Chart on Argentina - Market size and forecast 2025-2030 ($ million)
Data Table on Argentina - Market size and forecast 2025-2030 ($ million)
Chart on Argentina - Year-over-year growth 2025-2030 (%)
Data Table on Argentina - Year-over-year growth 2025-2030 (%)

12.6.3 Chile - Market size and forecast 2025-2030

Chart on Chile - Market size and forecast 2025-2030 ($ million)
Data Table on Chile - Market size and forecast 2025-2030 ($ million)
Chart on Chile - Year-over-year growth 2025-2030 (%)
Data Table on Chile - Year-over-year growth 2025-2030 (%)

12.7 Middle East and Africa - Market size and forecast 2025-2030

Chart on Middle East and Africa - Market size and forecast 2025-2030 ($ million)
Data Table on Middle East and Africa - Market size and forecast 2025-2030 ($ million)
Chart on Middle East and Africa - Year-over-year growth 2025-2030 (%)
Data Table on Middle East and Africa - Year-over-year growth 2025-2030 (%)
Chart on Regional Comparison - Middle East and Africa
Data Table on Regional Comparison - Middle East and Africa

12.7.1 UAE - Market size and forecast 2025-2030

Chart on UAE - Market size and forecast 2025-2030 ($ million)
Data Table on UAE - Market size and forecast 2025-2030 ($ million)
Chart on UAE - Year-over-year growth 2025-2030 (%)
Data Table on UAE - Year-over-year growth 2025-2030 (%)

12.7.2 Saudi Arabia - Market size and forecast 2025-2030

Chart on Saudi Arabia - Market size and forecast 2025-2030 ($ million)
Data Table on Saudi Arabia - Market size and forecast 2025-2030 ($ million)
Chart on Saudi Arabia - Year-over-year growth 2025-2030 (%)
Data Table on Saudi Arabia - Year-over-year growth 2025-2030 (%)

12.7.3 South Africa - Market size and forecast 2025-2030

Chart on South Africa - Market size and forecast 2025-2030 ($ million)
Data Table on South Africa - Market size and forecast 2025-2030 ($ million)
Chart on South Africa - Year-over-year growth 2025-2030 (%)
Data Table on South Africa - Year-over-year growth 2025-2030 (%)

12.7.4 Israel - Market size and forecast 2025-2030

Chart on Israel - Market size and forecast 2025-2030 ($ million)
Data Table on Israel - Market size and forecast 2025-2030 ($ million)
Chart on Israel - Year-over-year growth 2025-2030 (%)
Data Table on Israel - Year-over-year growth 2025-2030 (%)

12.7.5 Turkey - Market size and forecast 2025-2030

Chart on Turkey - Market size and forecast 2025-2030 ($ million)
Data Table on Turkey - Market size and forecast 2025-2030 ($ million)
Chart on Turkey - Year-over-year growth 2025-2030 (%)
Data Table on Turkey - Year-over-year growth 2025-2030 (%)

12.8 Market opportunity by geography

Market opportunity by geography ($ million)
Data Tables on Market opportunity by geography ($ million)

13. Drivers, Challenges, and Opportunity

13.1 Market drivers

Rapid proliferation of hybrid and decentralized workforce models
Enterprise imperative for lean automation and cost reduction
Strategic imperative to eliminate isolated enterprise data silos

13.2 Market challenges

Fragmented multi-cloud infrastructure and legacy technical dependencies
Severe cybersecurity risks and data privacy compliance mandates
High total cost and deep organizational change resistance

13.3 Impact of drivers and challenges

Impact of drivers and challenges in 2025 and 2030

13.4 Market opportunities

Mainstream integration of generative AI and agents
Rapid democratization through enterprise low-code workflow builders
Shift toward event-driven process architecture and data fabrics

14. Competitive Landscape

14.1 Overview

14.2

Overview on criticality of inputs and factors of differentiation

14.3 Landscape disruption

Overview on factors of disruption

14.4 Industry risks

Impact of key risks on business

15. Competitive Analysis

15.1 Companies profiled

Companies covered

15.2 Company ranking index

15.3 Market positioning of companies

Matrix on companies position and classification

15.4 Appian Corp.

Appian Corp. - Overview
Appian Corp. - Business segments
Appian Corp. - Key offerings
Appian Corp. - Segment focus
SWOT

15.5 Asana Inc.

Asana Inc. - Overview
Asana Inc. - Product / Service
Asana Inc. - Key news
Asana Inc. - Key offerings
SWOT

15.6 Camunda Services GmbH

Camunda Services GmbH - Overview
Camunda Services GmbH - Product / Service
Camunda Services GmbH - Key offerings
SWOT

15.7 IBM Corp.

IBM Corp. - Overview
IBM Corp. - Business segments
IBM Corp. - Key news
IBM Corp. - Key offerings
IBM Corp. - Segment focus
SWOT

15.8 Microsoft Corp.

Microsoft Corp. - Overview
Microsoft Corp. - Business segments
Microsoft Corp. - Key news
Microsoft Corp. - Key offerings
Microsoft Corp. - Segment focus
SWOT

15.9 monday.com Ltd.

monday.com Ltd. - Overview
monday.com Ltd. - Product / Service
monday.com Ltd. - Key news
monday.com Ltd. - Key offerings
SWOT

15.10 Nintex Global Ltd.

Nintex Global Ltd. - Overview
Nintex Global Ltd. - Product / Service
Nintex Global Ltd. - Key offerings
SWOT

15.11 Oracle Corp.

Oracle Corp. - Overview
Oracle Corp. - Business segments
Oracle Corp. - Key news
Oracle Corp. - Key offerings
Oracle Corp. - Segment focus
SWOT

15.12 Pegasystems Inc.

Pegasystems Inc. - Overview
Pegasystems Inc. - Business segments
Pegasystems Inc. - Key offerings
Pegasystems Inc. - Segment focus
SWOT

15.13 Salesforce Inc.

Salesforce Inc. - Overview
Salesforce Inc. - Business segments
Salesforce Inc. - Key news
Salesforce Inc. - Key offerings
Salesforce Inc. - Segment focus
SWOT

15.14 SAP SE

SAP SE - Overview
SAP SE - Business segments
SAP SE - Key news
SAP SE - Key offerings
SAP SE - Segment focus
SWOT

15.15 ServiceNow Inc.

ServiceNow Inc. - Overview
ServiceNow Inc. - Product / Service
ServiceNow Inc. - Key news
ServiceNow Inc. - Key offerings
SWOT

15.16 Smartsheet Inc.

Smartsheet Inc. - Overview
Smartsheet Inc. - Product / Service
Smartsheet Inc. - Key offerings
SWOT

15.17 UiPath Inc.

UiPath Inc. - Overview
UiPath Inc. - Product / Service
UiPath Inc. - Key news
UiPath Inc. - Key offerings
SWOT

15.18 Zoho Corp. Pvt. Ltd.

Zoho Corp. Pvt. Ltd. - Overview
Zoho Corp. Pvt. Ltd. - Product / Service
Zoho Corp. Pvt. Ltd. - Key offerings
SWOT

16. Appendix

16.1 Scope of the report

Market definition
Objectives
Notes and caveats

16.2 Inclusions and exclusions checklist

Inclusions checklist
Exclusions checklist

16.3 Currency conversion rates for US$

16.4 Research methodology

16.5 Data procurement

Information sources

16.6 Data validation

16.7 Validation techniques employed for market sizing

16.8 Data synthesis

16.9 360 degree market analysis

16.10 List of abbreviations

Research Methodology

Technavio presents a detailed picture of the market by way of study, synthesis, and summation of data from multiple sources. The analysts have presented the various facets of the market with a particular focus on identifying the key industry influencers. The data thus presented is comprehensive, reliable, and the result of extensive research, both primary and secondary.

INFORMATION SOURCES

Primary sources

  • Manufacturers and suppliers
  • Channel partners
  • Industry experts
  • Strategic decision makers

Secondary sources

  • Industry journals and periodicals
  • Government data
  • Financial reports of key industry players
  • Historical data
  • Press releases

DATA ANALYSIS

Data Synthesis

  • Collation of data
  • Estimation of key figures
  • Analysis of derived insights

Data Validation

  • Triangulation with data models
  • Reference against proprietary databases
  • Corroboration with industry experts

REPORT WRITING

Qualitative

  • Market drivers
  • Market challenges
  • Market trends
  • Five forces analysis

Quantitative

  • Market size and forecast
  • Market segmentation
  • Geographical insights
  • Competitive landscape

Interested in this report?

Get your sample now to see our research methodology and insights!

Download Now

Frequently Asked Questions

Workflow Management Systems market growth will increase by USD 23647.1 million during 2026-2030.

The Workflow Management Systems market is expected to grow at a CAGR of 26.9% during 2026-2030.

Workflow Management Systems market is segmented by Deployment (On premise, Cloud) End-user (BFSI, Government, Healthcare, Legal, Others) Component (Software, Services)

Appian Corp., Asana Inc., Bizagi Group Ltd., Camunda Services GmbH, ClickUp, Creatio Ltd., IBM Corp., Kissflow Inc., Laserfiche, Microsoft Corp., monday.com Ltd., Nintex Global Ltd., Oracle Corp., Pegasystems Inc., Salesforce Inc., SAP SE, ServiceNow Inc., Smartsheet Inc., UiPath Inc., Zoho Corp. Pvt. Ltd. are a few of the key vendors in the Workflow Management Systems market.

APAC will register the highest growth rate of 32.8% among the other regions. Therefore, the Workflow Management Systems market in APAC is expected to garner significant business opportunities for the vendors during the forecast period.

US, Canada, Mexico, China, Japan, India, South Korea, Australia, Indonesia, Germany, UK, France, Italy, Spain, The Netherlands, Brazil, Argentina, Chile, UAE, Saudi Arabia, South Africa, Israel, Turkey

  • Rapid proliferation of hybrid and decentralized workforce models is the driving factor this market.

The Workflow Management Systems market vendors should focus on grabbing business opportunities from the Deployment segment as it accounted for the largest market share in the base year.
RIA - Research AI Assistant
Ask RIA
