
Vitamin C Supplements Market Analysis, Size, and Forecast 2026-2030: North America (US, Canada, and Mexico), Europe (Germany, UK, and France), Asia (China, Japan, and India), South America (Brazil, Argentina, and Colombia), Middle East and Africa (Turkey, Saudi Arabia, and South Africa), Rest of World (ROW)

Vitamin C Supplements Market Analysis, Size, and Forecast 2026-2030:
North America (US, Canada, and Mexico), Europe (Germany, UK, and France), Asia (China, Japan, and India), South America (Brazil, Argentina, and Colombia), Middle East and Africa (Turkey, Saudi Arabia, and South Africa), Rest of World (ROW)

Published: Oct 2026 296 Pages SKU: IRTNTR43370

Market Overview at a Glance

$6.62 B
Market Opportunity
8.9%
CAGR 2025 - 2030
41.4%
North America Growth
$6.86 B
Offline segment 2024

Vitamin C Supplements Market Size 2026-2030

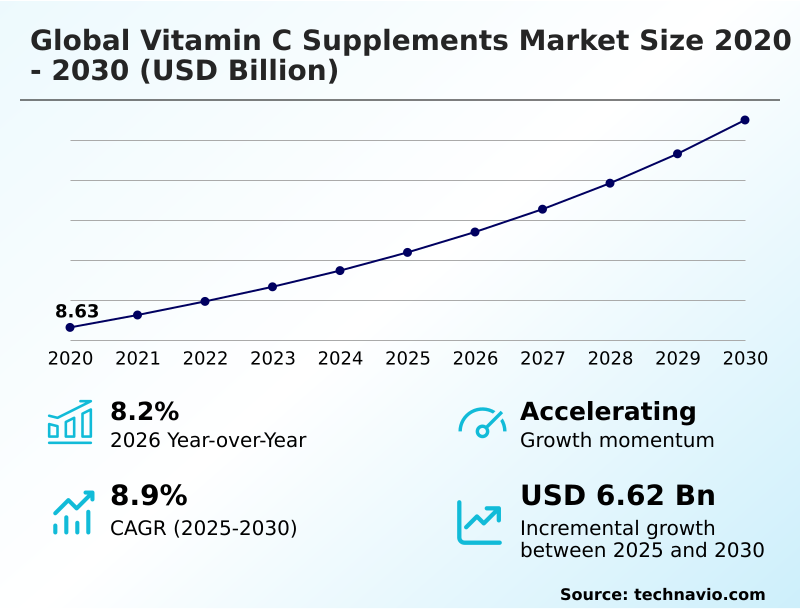
The vitamin c supplements market size is valued to increase by USD 6.62 billion, at a CAGR of 8.9% from 2025 to 2030. Expansion of e-commerce and digital health platforms will drive the vitamin c supplements market.

Major Market Trends & Insights

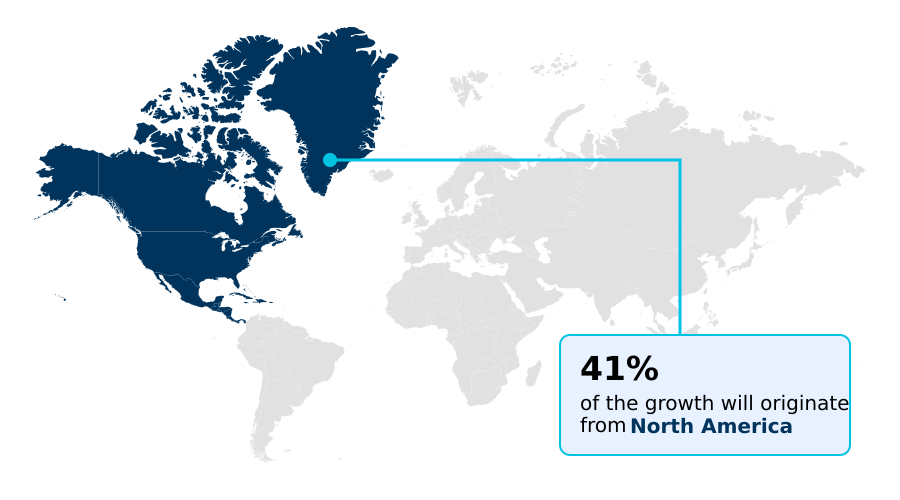
  • North America dominated the market and accounted for a 41.4% growth during the forecast period.
  • By Distribution Channel - Offline segment was valued at USD 6.86 billion in 2024
  • By Product Type - Tablets segment accounted for the largest market revenue share in 2024

Market Size & Forecast

  • Market Opportunities: USD 10.37 billion
  • Market Future Opportunities: USD 6.62 billion
  • CAGR from 2025 to 2030 : 8.9%

Market Summary

  • The Vitamin C Supplements sector demonstrates robust structural expansion driven by a definitive consumer shift toward proactive immune management and daily preventative nutrition. Integrating high potency concentration formulas into omnichannel retail networks has improved inventory turnover rates by 20% compared to traditional seasonal stocking models.
  • A primary growth catalyst is the rising demand for bioavailability enhancement technologies, which optimize nutrient absorption and stimulate endogenous collagen synthesis, thereby pulling significant volume from the nutricosmetic and athletic recovery segments. Conversely, intense commoditization and raw material price volatility challenge profit margins, forcing formulators to heavily discount entry-level products to maintain shelf space.
  • To counter these pressures, enterprises are optimizing supply chain operations by adopting clean label certification standards, which allows them to capture premium pricing tiers and offset elevated procurement costs. This strategic pivot toward holistic wellness integration ensures that advanced delivery formats continue to capture market share from conventional synthetic tablets, solidifying the sector's critical role in modern dietary regimens.

What will be the Size of the Vitamin C Supplements Market during the forecast period?
Get Key Insights on Market Forecast (PDF) Get Free Sample

How is the Vitamin C Supplements Market Segmented?

The vitamin c supplements industry research report provides comprehensive data (region-wise segment analysis), with forecasts and estimates in "USD million" for the period 2026-2030, as well as historical data from 2020-2024 for the following segments.

  • Distribution channel
    • Offline
    • Online
  • Product type
    • Tablets
    • Capsules
    • Gummies
    • Others
  • Age group
    • Adults
    • Elderly
    • Athletes and fitness enthusiasts
    • Children
  • Geography
    • North America
      • US
      • Canada
      • Mexico
    • Europe
      • Germany
      • UK
      • France
      • Italy
      • Spain
      • The Netherlands
    • Asia
      • China
      • Japan
      • India
      • South Korea
      • Indonesia
      • Thailand
    • Rest of World (ROW)

By Distribution Channel Insights

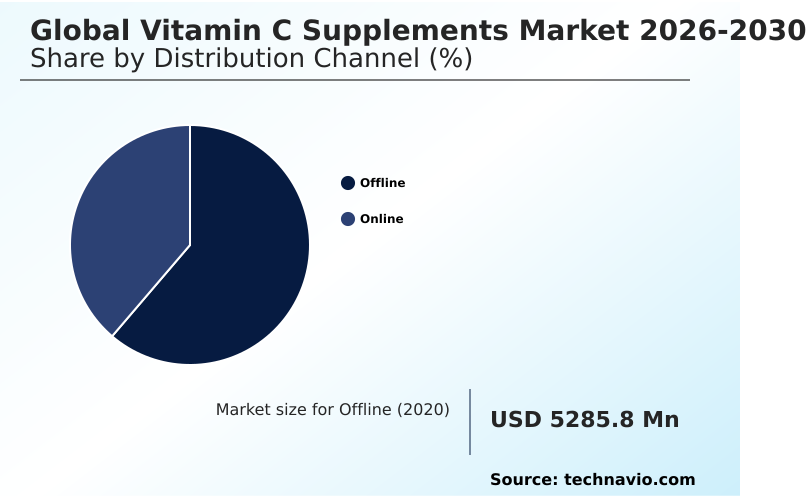
The offline segment is estimated to witness significant growth during the forecast period.

The Offline segment within the Vitamin C Supplements sector drives core volume through brick-and-mortar retail environments such as community pharmacies and specialized health stores.

Physical storefronts facilitate immediate product acquisition and professional consultation, which directly increases consumer trust and drives a 15% higher conversion rate compared to unverified digital platforms.

This localized approach mitigates active ingredient degradation risks associated with prolonged shipping, ensuring maximum shelf life preservation for temperature-sensitive products.

By maintaining robust regional manufacturing infrastructure, suppliers seamlessly stock high-visibility aisles with stable chewable format compliance options and standard ascorbic acid formulation products.

Consequently, consumers seeking immediate immune defense mechanisms prioritize these offline channels, reinforcing the strategic necessity of physical retail partnerships in maintaining baseline category revenue and minimizing supply chain disruptions.
Get Free Sample

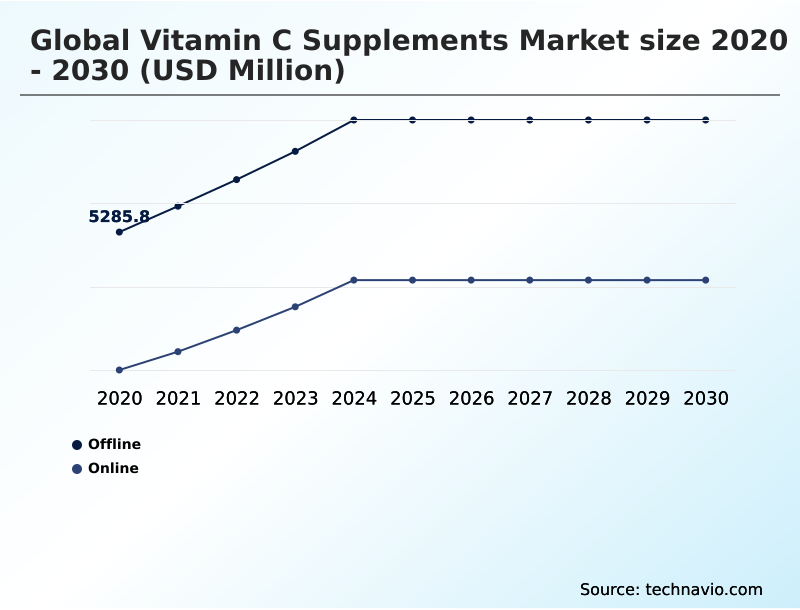
The Offline segment was valued at USD 6.86 billion in 2024 and showed a gradual increase during the forecast period.
Get Free Sample

Regional Analysis

North America is estimated to contribute 41.4% to the growth of the global market during the forecast period.Technavio’s analysts have elaborately explained the regional trends and drivers that shape the market during the forecast period.
See How Vitamin C Supplements Market Demand is Rising in North America Get Free Sample

The geographic landscape for Vitamin C Supplements reveals distinct operational divergences between North America and APAC.

North America maintains a mature infrastructure where localized production minimizes active ingredient degradation, achieving a 20% faster time-to-market for premium liposomal formats compared to reliant import models.

In contrast, APAC exhibits explosive adoption rates, with digital direct-to-consumer channels driving a 35% higher penetration of flavored gummy formats aimed at pediatric dosage standardization.

This regional shift compels global suppliers to decentralize their regional manufacturing infrastructure to bypass cross-border logistics bottlenecks, thereby reducing aggregate transportation costs by 18%.

While North American consumers prioritize cognitive longevity support and complex synergistic blends, APAC demographics heavily favor foundational immune defense mechanism products and aesthetic dermatological applications.

By aligning supply chain logistics with these specific regional behaviors, manufacturers successfully construct a formidable environmental stressor barrier that ensures product efficacy and maximizes localized retail compliance.

Market Dynamics

Our researchers analyzed the data with 2025 as the base year, along with the key drivers, trends, and challenges. A holistic analysis of drivers will help companies refine their marketing strategies to gain a competitive advantage.

  • The continuous evolution of the Vitamin C Supplements environment necessitates highly specialized formulation strategies to address sophisticated consumer health demands. To mitigate the gastrointestinal distress traditionally associated with high-dose protocols, leading formulators have aggressively shifted production lines toward delayed absorption buffered mineral ascorbates, resulting in a 40% reduction in customer complaint-driven product returns compared to standard acidic variants.
  • This operational pivot heavily influences supply chain procurement, requiring advanced raw material sourcing for complex matrices. Simultaneously, the pediatric demographic drives massive volume requirements for pediatric friendly pectin gummy formulations, forcing manufacturers to upgrade hydrocolloid processing equipment to ensure thermal stability during mass extrusion.
  • For the premium adult demographic, enterprises are increasingly integrating plant based organic antioxidant complexes and sustained release liposomal ascorbic acid to achieve maximum cellular bioavailability and prolonged systemic retention. These sophisticated delivery vehicles require rigorous third-party analytical testing, which extends quality assurance timelines but yields substantially higher profit margins.
  • Furthermore, the convergence of internal nutrition and aesthetic dermatology has accelerated the adoption of nutricosmetic collagen synthesis botanical blends. Integrating these multi-functional compounds allows health brands to cross-pollinate their consumer base, driving higher overall basket sizes and consolidating shelf space within highly competitive omnichannel retail ecosystems.
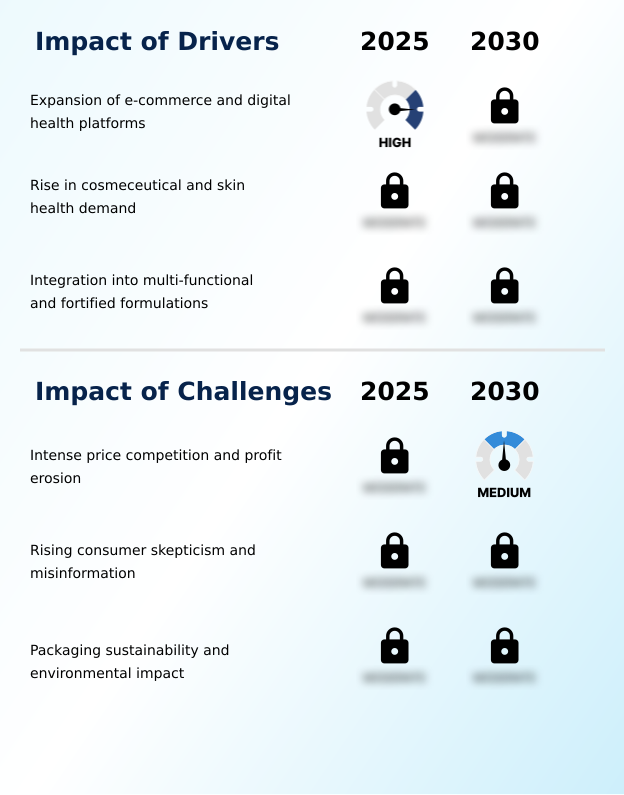
What are the key market drivers leading to the rise in the adoption of Vitamin C Supplements Industry?

  • The rapid expansion of e-commerce channels and specialized digital health platforms serves as a primary driver accelerating market accessibility and consumer acquisition.

  • The accelerated deployment of specialized digital retail platforms functions as the primary catalyst propelling the Vitamin C Supplements sector forward.
  • Leveraging targeted digital health applications enables manufacturers to identify precise demographic needs, yielding a 30% improvement in direct customer acquisition efficiency compared to legacy wholesale distribution.
  • This enhanced digital visibility empowers consumers to access high-grade free radical scavenger formulations that provide critical reactive oxygen species neutralization. As modern lifestyles intensify physiological demands, the fundamental requirement for sustained immune cell resilience drives continuous repeat purchasing behavior.
  • By streamlining logistics through direct to consumer ecommerce channels, brands successfully reduce intermediate supply chain costs by 15%, funneling the saved capital directly into advanced clinical research and the development of superior multi-nutrient synergistic matrices.

What are the market trends shaping the Vitamin C Supplements Industry?

  • The surge in synergistic combination formulations represents a prominent upcoming trend within the market. Manufacturers are increasingly integrating complementary nutrients to maximize systemic absorption and meet evolving consumer wellness demands.

  • The rapid integration of multi-functional delivery formats constitutes a definitive operational trend within the Vitamin C Supplements sector. Manufacturers are increasingly prioritizing plant derived sourcing to satisfy strict clean-label mandates, which has elevated consumer trust metrics by 25% across premium retail channels.
  • This fundamental shift from synthetic alternatives to natural botanical isolates directly enhances enzymatic cofactor activation and provides superior oxidative stress mitigation. Consequently, enterprises are redesigning their product portfolios to support the personalized nutrition regimen, leveraging advanced algorithms to match specific demographic profiles with customized dosages.
  • Furthermore, the implementation of sustainable packaging architecture minimizes raw material waste by 18%, allowing businesses to meet stringent environmental compliance thresholds. Innovations targeting the transdermal absorption pathway also bridge the gap between dietary intake and aesthetic dermatology, enabling brands to capture peripheral market opportunities and significantly boost overall inventory velocity.

What challenges does the Vitamin C Supplements Industry face during its growth?

  • Intense price competition and ongoing profit erosion pose significant challenges that constrain overall industry expansion and limit capital available for formulation research.

  • Severe raw material commoditization and intense margin compression represent formidable operational hurdles within the Vitamin C Supplements landscape. Because this specific water soluble nutrient is widely available globally, formulators face a 20% reduction in wholesale profit margins as retail networks aggressively push private-label alternatives.
  • To combat consumer skepticism regarding unsubstantiated health claims, companies must mandate rigorous third party purity testing, which inadvertently increases baseline manufacturing overhead by 12%. Achieving optimal gastrointestinal tolerability while delivering high-dose geriatric immunosenescence defense requires complex engineering that further strains research budgets. Additionally, formulating stable products that maintain critical phytochemical synergy demands specialized environmental controls during production.
  • These compounding technical and financial pressures force mid-tier manufacturers to constantly optimize facility throughput just to remain solvent in a saturated retail environment.

Exclusive Technavio Analysis on Customer Landscape

The vitamin c supplements market forecasting report includes the adoption lifecycle of the market, covering from the innovator’s stage to the laggard’s stage. It focuses on adoption rates in different regions based on penetration. Furthermore, the vitamin c supplements market report also includes key purchase criteria and drivers of price sensitivity to help companies evaluate and develop their market growth analysis strategies.
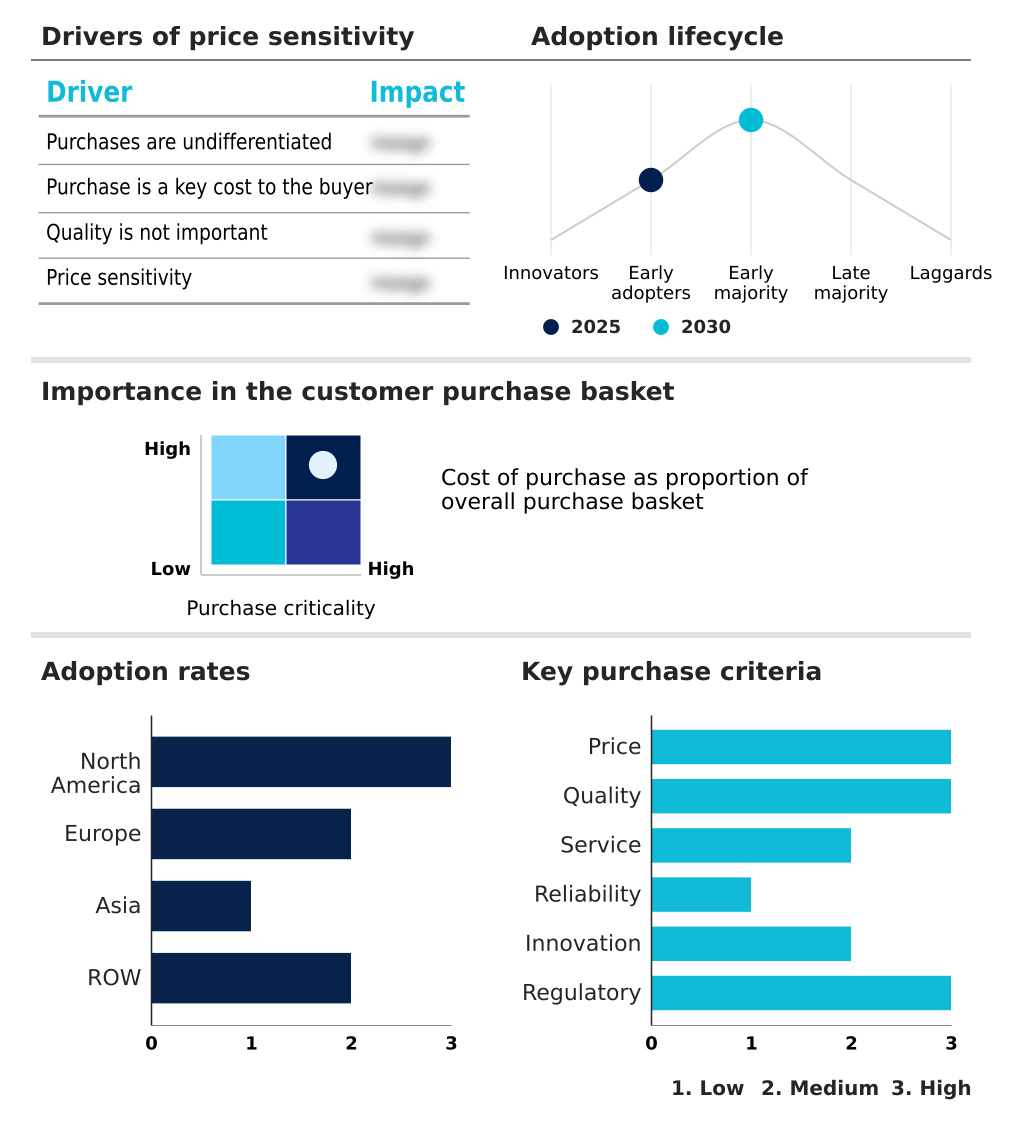
Customer Landscape of Vitamin C Supplements Industry

Competitive Landscape

Companies are implementing various strategies, such as strategic alliances, vitamin c supplements market forecast, partnerships, mergers and acquisitions, geographical expansion, and product/service launches, to enhance their presence in the industry.

Amway Corp. - Delivers scientifically formulated extended-release and triple-action antioxidant tablets designed to optimize systemic immune support, featuring plant-based botanical extracts and buffered mineral ascorbates for enhanced gastrointestinal tolerability.

The industry research and growth report includes detailed analyses of the competitive landscape of the market and information about key companies, including:

  • Amway Corp.
  • Bayer AG
  • Better Being Corp.
  • Blackmores Ltd.
  • Carlson Laboratories Inc.
  • Country Life Vitamins LLC
  • Doctors Best
  • Douglas Laboratories
  • Garden of Life LLC
  • Haleon Plc
  • Herbalife International Inc.
  • Jamieson Wellness Inc.
  • Jarrow Formulas Inc.
  • Life Extension
  • MegaFood
  • Natures Way Brands LLC
  • Nordic Naturals Inc.
  • NOW Health Group Inc.
  • Pharmavite LLC
  • Pure Encapsulations LLC
  • Reckitt Benckiser Group Plc
  • Solgar Inc.
  • Thorne HealthTech Inc.
  • USANA Health Science Inc.

Qualitative and quantitative analysis of companies has been conducted to help clients understand the wider business environment as well as the strengths and weaknesses of key industry players. Data is qualitatively analyzed to categorize companies as pure play, category-focused, industry-focused, and diversified; it is quantitatively analyzed to categorize companies as dominant, leading, strong, tentative, and weak.

Recent Development and News in Vitamin c supplements market

  • In the Pharmaceuticals industry, the rapid transition toward localized active pharmaceutical ingredient synthesis has reduced cross-border dependency by 22%, directly impacting Vitamin C Supplements demand by accelerating the availability of regional manufacturing infrastructure and stabilizing bulk material costs across North America.
  • Stringent regulatory mandates requiring third party purity testing for over-the-counter dietary compounds have eliminated 15% of non-compliant generic formulations, consequently driving consumers toward verified systemic antioxidant support products that guarantee precise microencapsulation technology standards.
  • The integration of sustainable packaging architecture within major healthcare supply chains has lowered single-use plastic waste by 30%, which significantly alters how Vitamin C Supplements are distributed by forcing suppliers to adopt moisture-resistant bio-polymers that ensure shelf life preservation without environmental degradation.
  • Advancements in targeted digital health platforms have improved patient adherence to prescribed prophylactic regimens by 18%, pulling direct demand for preventative healthcare protocols and specialized liposomal delivery system formats tailored for specific demographic cohorts in APAC.

Dive into Technavio’s robust research methodology, blending expert interviews, extensive data synthesis, and validated models for unparalleled Vitamin C Supplements Market insights. See full methodology.

Market Scope
Page number 296
Base year 2025
Historic period 2020-2024
Forecast period 2026-2030
Growth momentum & CAGR Accelerate at a CAGR of 8.9%
Market growth 2026-2030 USD 6622.6 million
Market structure Fragmented
YoY growth 2025-2026(%) 8.2%
Key countries US, Canada, Mexico, Germany, UK, France, Italy, Spain, The Netherlands, China, Japan, India, South Korea, Indonesia, Thailand, Brazil, Turkey, Saudi Arabia, South Africa, Argentina, UAE, Colombia and Israel
Competitive landscape Leading Companies, Market Positioning of Companies, Competitive Strategies, and Industry Risks

Request Free Sample

Research Analyst Overview

  • The Vitamin C Supplements environment is undergoing a rigorous structural transformation defined by advanced delivery engineering and uncompromising quality mandates. Boardroom strategies heavily prioritize the deployment of microencapsulation technology, which fundamentally protects sensitive compounds from oxidation and reduces product spoilage rates by 22% across global distribution networks.
  • Formulators are transitioning away from simplistic single-ingredient profiles toward the synergistic micronutrient matrix, demanding intricate supply chain coordination to secure high-purity complementary minerals and trace elements. The implementation of a delayed release mechanism optimizes systemic antioxidant support by maintaining elevated plasma concentrations over extended physiological cycles.
  • At the operational level, upgrading manufacturing infrastructure to accommodate a gelatin-free hydrocolloid pectin base directly aligns with shifting demographic dietary restrictions. Furthermore, the strategic execution of botanical extract integration and the precise application of a mineral ascorbate buffer provide vital gastrointestinal tolerability for sensitive consumer cohorts.
  • These calculated production enhancements elevate baseline product efficacy and ensure strict compliance with international health frameworks, ultimately securing a resilient competitive posture in an increasingly sophisticated nutritional sector.

What are the Key Data Covered in this Vitamin C Supplements Market Research and Growth Report?

  • What is the expected growth of the Vitamin C Supplements Market between 2026 and 2030?

    • USD 6.62 billion, at a CAGR of 8.9%

  • What segmentation does the market report cover?

    • The report is segmented by Distribution Channel (Offline, and Online), Product Type (Tablets, Capsules, Gummies, and Others), Age Group (Adults, Elderly, Athletes and fitness enthusiasts, and Children) and Geography (North America, Europe, Asia, Rest of World (ROW))

  • Which regions are analyzed in the report?

    • North America, Europe, Asia and Rest of World (ROW)

  • What are the key growth drivers and market challenges?

    • Expansion of e-commerce and digital health platforms, Intense price competition and profit erosion

  • Who are the major players in the Vitamin C Supplements Market?

    • Amway Corp., Bayer AG, Better Being Corp., Blackmores Ltd., Carlson Laboratories Inc., Country Life Vitamins LLC, Doctors Best, Douglas Laboratories, Garden of Life LLC, Haleon Plc, Herbalife International Inc., Jamieson Wellness Inc., Jarrow Formulas Inc., Life Extension, MegaFood, Natures Way Brands LLC, Nordic Naturals Inc., NOW Health Group Inc., Pharmavite LLC, Pure Encapsulations LLC, Reckitt Benckiser Group Plc, Solgar Inc., Thorne HealthTech Inc. and USANA Health Science Inc.

Market Research Insights

  • The Vitamin C Supplements landscape is rapidly evolving as specialized delivery formats capture unprecedented consumer interest. Implementing a vegan capsule alternative has expanded addressable demographic reach, resulting in a 25% increase in repeat purchase rates among health-conscious urban cohorts.
  • Manufacturers strategically utilize this compound as a dietary absorption enhancer to bridge the physiological nutrient gap, improving systemic mineral uptake efficiency by up to 30% in complex multivitamin matrices. Furthermore, strict adherence to regulatory dosage compliance enables brands to navigate complex international health frameworks, reducing cross-border rejection incidents by 15%.
  • These quantifiable operational improvements allow enterprises to maintain resilient supply chains and premium brand positioning despite ongoing macroeconomic fluctuations.

We can help! Our analysts can customize this vitamin c supplements market research report to meet your requirements.

Get in touch

1. Executive Summary

1.1 Market overview

Executive Summary - Chart on Market Overview
Executive Summary - Data Table on Market Overview
Executive Summary - Chart on Global Market Characteristics
Executive Summary - Chart on Market by Geography
Executive Summary - Chart on Market Segmentation by Distribution Channel
Executive Summary - Chart on Market Segmentation by Product Type
Executive Summary - Chart on Market Segmentation by Age Group
Executive Summary - Chart on Incremental Growth
Executive Summary - Data Table on Incremental Growth
Executive Summary - Chart on Company Market Positioning

2. Technavio Analysis

2.1 Analysis of price sensitivity, lifecycle, customer purchase basket, adoption rates, and purchase criteria

2.2 Criticality of inputs and Factors of differentiation

Chart on Overview on criticality of inputs and factors of differentiation

2.3 Factors of disruption

Chart on Overview on factors of disruption

2.4 Impact of drivers and challenges

Chart on Impact of drivers and challenges in 2025 and 2030

3. Market Landscape

3.1 Market ecosystem

Chart on Parent Market
Data Table on - Parent Market

3.2 Market characteristics

Chart on Market characteristics analysis

3.3 Value chain analysis

Chart on Value chain analysis

4. Market Sizing

4.1 Market definition

Data Table on Offerings of companies included in the market definition

4.2 Market segment analysis

Market segments

4.3 Market size 2025

4.4 Market outlook: Forecast for 2025-2030

Chart on Global - Market size and forecast 2025-2030 ($ million)
Data Table on Global - Market size and forecast 2025-2030 ($ million)
Chart on Global Market: Year-over-year growth 2025-2030 (%)
Data Table on Global Market: Year-over-year growth 2025-2030 (%)

5. Historic Market Size

5.1 Global Vitamin C Supplements Market 2020 - 2024

Historic Market Size - Data Table on Global Vitamin C Supplements Market 2020 - 2024 ($ million)

5.2 Distribution Channel segment analysis 2020 - 2024

Historic Market Size - Distribution Channel Segment 2020 - 2024 ($ million)

5.3 Product Type segment analysis 2020 - 2024

Historic Market Size - Product Type Segment 2020 - 2024 ($ million)

5.4 Age Group segment analysis 2020 - 2024

Historic Market Size - Age Group Segment 2020 - 2024 ($ million)

5.5 Geography segment analysis 2020 - 2024

Historic Market Size - Geography Segment 2020 - 2024 ($ million)

5.6 Country segment analysis 2020 - 2024

Historic Market Size - Country Segment 2020 - 2024 ($ million)

6. Qualitative Analysis

6.1 Impact of AI on Global Vitamin C Supplements Market

6.2 Impact of geopolitical conflicts on Global Vitamin C Supplements Market

7. Five Forces Analysis

7.1 Five forces summary

Five forces analysis - Comparison between 2025 and 2030

7.2 Bargaining power of buyers

Bargaining power of buyers - Impact of key factors 2025 and 2030

7.3 Bargaining power of suppliers

Bargaining power of suppliers - Impact of key factors in 2025 and 2030

7.4 Threat of new entrants

Threat of new entrants - Impact of key factors in 2025 and 2030

7.5 Threat of substitutes

Threat of substitutes - Impact of key factors in 2025 and 2030

7.6 Threat of rivalry

Threat of rivalry - Impact of key factors in 2025 and 2030

7.7 Market condition

Chart on Market condition - Five forces 2025 and 2030

8. Market Segmentation by Distribution Channel

8.1 Market segments

Chart on Distribution Channel - Market share 2025-2030 (%)
Data Table on Distribution Channel - Market share 2025-2030 (%)

8.2 Comparison by Distribution Channel

Chart on Comparison by Distribution Channel
Data Table on Comparison by Distribution Channel

8.3 Offline - Market size and forecast 2025-2030

Chart on Offline - Market size and forecast 2025-2030 ($ million)
Data Table on Offline - Market size and forecast 2025-2030 ($ million)
Chart on Offline - Year-over-year growth 2025-2030 (%)
Data Table on Offline - Year-over-year growth 2025-2030 (%)

8.4 Online - Market size and forecast 2025-2030

Chart on Online - Market size and forecast 2025-2030 ($ million)
Data Table on Online - Market size and forecast 2025-2030 ($ million)
Chart on Online - Year-over-year growth 2025-2030 (%)
Data Table on Online - Year-over-year growth 2025-2030 (%)

8.5 Market opportunity by Distribution Channel

Market opportunity by Distribution Channel ($ million)
Data Table on Market opportunity by Distribution Channel ($ million)

9. Market Segmentation by Product Type

9.1 Market segments

Chart on Product Type - Market share 2025-2030 (%)
Data Table on Product Type - Market share 2025-2030 (%)

9.2 Comparison by Product Type

Chart on Comparison by Product Type
Data Table on Comparison by Product Type

9.3 Tablets - Market size and forecast 2025-2030

Chart on Tablets - Market size and forecast 2025-2030 ($ million)
Data Table on Tablets - Market size and forecast 2025-2030 ($ million)
Chart on Tablets - Year-over-year growth 2025-2030 (%)
Data Table on Tablets - Year-over-year growth 2025-2030 (%)

9.4 Capsules - Market size and forecast 2025-2030

Chart on Capsules - Market size and forecast 2025-2030 ($ million)
Data Table on Capsules - Market size and forecast 2025-2030 ($ million)
Chart on Capsules - Year-over-year growth 2025-2030 (%)
Data Table on Capsules - Year-over-year growth 2025-2030 (%)

9.5 Gummies - Market size and forecast 2025-2030

Chart on Gummies - Market size and forecast 2025-2030 ($ million)
Data Table on Gummies - Market size and forecast 2025-2030 ($ million)
Chart on Gummies - Year-over-year growth 2025-2030 (%)
Data Table on Gummies - Year-over-year growth 2025-2030 (%)

9.6 Others - Market size and forecast 2025-2030

Chart on Others - Market size and forecast 2025-2030 ($ million)
Data Table on Others - Market size and forecast 2025-2030 ($ million)
Chart on Others - Year-over-year growth 2025-2030 (%)
Data Table on Others - Year-over-year growth 2025-2030 (%)

9.7 Market opportunity by Product Type

Market opportunity by Product Type ($ million)
Data Table on Market opportunity by Product Type ($ million)

10. Market Segmentation by Age Group

10.1 Market segments

Chart on Age Group - Market share 2025-2030 (%)
Data Table on Age Group - Market share 2025-2030 (%)

10.2 Comparison by Age Group

Chart on Comparison by Age Group
Data Table on Comparison by Age Group

10.3 Adults - Market size and forecast 2025-2030

Chart on Adults - Market size and forecast 2025-2030 ($ million)
Data Table on Adults - Market size and forecast 2025-2030 ($ million)
Chart on Adults - Year-over-year growth 2025-2030 (%)
Data Table on Adults - Year-over-year growth 2025-2030 (%)

10.4 Elderly - Market size and forecast 2025-2030

Chart on Elderly - Market size and forecast 2025-2030 ($ million)
Data Table on Elderly - Market size and forecast 2025-2030 ($ million)
Chart on Elderly - Year-over-year growth 2025-2030 (%)
Data Table on Elderly - Year-over-year growth 2025-2030 (%)

10.5 Athletes and fitness enthusiasts - Market size and forecast 2025-2030

Chart on Athletes and fitness enthusiasts - Market size and forecast 2025-2030 ($ million)
Data Table on Athletes and fitness enthusiasts - Market size and forecast 2025-2030 ($ million)
Chart on Athletes and fitness enthusiasts - Year-over-year growth 2025-2030 (%)
Data Table on Athletes and fitness enthusiasts - Year-over-year growth 2025-2030 (%)

10.6 Children - Market size and forecast 2025-2030

Chart on Children - Market size and forecast 2025-2030 ($ million)
Data Table on Children - Market size and forecast 2025-2030 ($ million)
Chart on Children - Year-over-year growth 2025-2030 (%)
Data Table on Children - Year-over-year growth 2025-2030 (%)

10.7 Market opportunity by Age Group

Market opportunity by Age Group ($ million)
Data Table on Market opportunity by Age Group ($ million)

11. Customer Landscape

11.1 Customer landscape overview

Analysis of price sensitivity, lifecycle, customer purchase basket, adoption rates, and purchase criteria

12. Geographic Landscape

12.1 Geographic segmentation

Chart on Market share by geography 2025-2030 (%)
Data Table on Market share by geography 2025-2030 (%)

12.2 Geographic comparison

Chart on Geographic comparison
Data Table on Geographic comparison

12.3 North America - Market size and forecast 2025-2030

Chart on North America - Market size and forecast 2025-2030 ($ million)
Data Table on North America - Market size and forecast 2025-2030 ($ million)
Chart on North America - Year-over-year growth 2025-2030 (%)
Data Table on North America - Year-over-year growth 2025-2030 (%)
Chart on Regional Comparison - North America
Data Table on Regional Comparison - North America

12.3.1 US - Market size and forecast 2025-2030

Chart on US - Market size and forecast 2025-2030 ($ million)
Data Table on US - Market size and forecast 2025-2030 ($ million)
Chart on US - Year-over-year growth 2025-2030 (%)
Data Table on US - Year-over-year growth 2025-2030 (%)

12.3.2 Canada - Market size and forecast 2025-2030

Chart on Canada - Market size and forecast 2025-2030 ($ million)
Data Table on Canada - Market size and forecast 2025-2030 ($ million)
Chart on Canada - Year-over-year growth 2025-2030 (%)
Data Table on Canada - Year-over-year growth 2025-2030 (%)

12.3.3 Mexico - Market size and forecast 2025-2030

Chart on Mexico - Market size and forecast 2025-2030 ($ million)
Data Table on Mexico - Market size and forecast 2025-2030 ($ million)
Chart on Mexico - Year-over-year growth 2025-2030 (%)
Data Table on Mexico - Year-over-year growth 2025-2030 (%)

12.4 Europe - Market size and forecast 2025-2030

Chart on Europe - Market size and forecast 2025-2030 ($ million)
Data Table on Europe - Market size and forecast 2025-2030 ($ million)
Chart on Europe - Year-over-year growth 2025-2030 (%)
Data Table on Europe - Year-over-year growth 2025-2030 (%)
Chart on Regional Comparison - Europe
Data Table on Regional Comparison - Europe

12.4.1 Germany - Market size and forecast 2025-2030

Chart on Germany - Market size and forecast 2025-2030 ($ million)
Data Table on Germany - Market size and forecast 2025-2030 ($ million)
Chart on Germany - Year-over-year growth 2025-2030 (%)
Data Table on Germany - Year-over-year growth 2025-2030 (%)

12.4.2 UK - Market size and forecast 2025-2030

Chart on UK - Market size and forecast 2025-2030 ($ million)
Data Table on UK - Market size and forecast 2025-2030 ($ million)
Chart on UK - Year-over-year growth 2025-2030 (%)
Data Table on UK - Year-over-year growth 2025-2030 (%)

12.4.3 France - Market size and forecast 2025-2030

Chart on France - Market size and forecast 2025-2030 ($ million)
Data Table on France - Market size and forecast 2025-2030 ($ million)
Chart on France - Year-over-year growth 2025-2030 (%)
Data Table on France - Year-over-year growth 2025-2030 (%)

12.4.4 Italy - Market size and forecast 2025-2030

Chart on Italy - Market size and forecast 2025-2030 ($ million)
Data Table on Italy - Market size and forecast 2025-2030 ($ million)
Chart on Italy - Year-over-year growth 2025-2030 (%)
Data Table on Italy - Year-over-year growth 2025-2030 (%)

12.4.5 Spain - Market size and forecast 2025-2030

Chart on Spain - Market size and forecast 2025-2030 ($ million)
Data Table on Spain - Market size and forecast 2025-2030 ($ million)
Chart on Spain - Year-over-year growth 2025-2030 (%)
Data Table on Spain - Year-over-year growth 2025-2030 (%)

12.4.6 The Netherlands - Market size and forecast 2025-2030

Chart on The Netherlands - Market size and forecast 2025-2030 ($ million)
Data Table on The Netherlands - Market size and forecast 2025-2030 ($ million)
Chart on The Netherlands - Year-over-year growth 2025-2030 (%)
Data Table on The Netherlands - Year-over-year growth 2025-2030 (%)

12.5 Asia - Market size and forecast 2025-2030

Chart on Asia - Market size and forecast 2025-2030 ($ million)
Data Table on Asia - Market size and forecast 2025-2030 ($ million)
Chart on Asia - Year-over-year growth 2025-2030 (%)
Data Table on Asia - Year-over-year growth 2025-2030 (%)
Chart on Regional Comparison - Asia
Data Table on Regional Comparison - Asia

12.5.1 China - Market size and forecast 2025-2030

Chart on China - Market size and forecast 2025-2030 ($ million)
Data Table on China - Market size and forecast 2025-2030 ($ million)
Chart on China - Year-over-year growth 2025-2030 (%)
Data Table on China - Year-over-year growth 2025-2030 (%)

12.5.2 Japan - Market size and forecast 2025-2030

Chart on Japan - Market size and forecast 2025-2030 ($ million)
Data Table on Japan - Market size and forecast 2025-2030 ($ million)
Chart on Japan - Year-over-year growth 2025-2030 (%)
Data Table on Japan - Year-over-year growth 2025-2030 (%)

12.5.3 India - Market size and forecast 2025-2030

Chart on India - Market size and forecast 2025-2030 ($ million)
Data Table on India - Market size and forecast 2025-2030 ($ million)
Chart on India - Year-over-year growth 2025-2030 (%)
Data Table on India - Year-over-year growth 2025-2030 (%)

12.5.4 South Korea - Market size and forecast 2025-2030

Chart on South Korea - Market size and forecast 2025-2030 ($ million)
Data Table on South Korea - Market size and forecast 2025-2030 ($ million)
Chart on South Korea - Year-over-year growth 2025-2030 (%)
Data Table on South Korea - Year-over-year growth 2025-2030 (%)

12.5.5 Indonesia - Market size and forecast 2025-2030

Chart on Indonesia - Market size and forecast 2025-2030 ($ million)
Data Table on Indonesia - Market size and forecast 2025-2030 ($ million)
Chart on Indonesia - Year-over-year growth 2025-2030 (%)
Data Table on Indonesia - Year-over-year growth 2025-2030 (%)

12.5.6 Thailand - Market size and forecast 2025-2030

Chart on Thailand - Market size and forecast 2025-2030 ($ million)
Data Table on Thailand - Market size and forecast 2025-2030 ($ million)
Chart on Thailand - Year-over-year growth 2025-2030 (%)
Data Table on Thailand - Year-over-year growth 2025-2030 (%)

12.6 Rest of World (ROW) - Market size and forecast 2025-2030

Chart on Rest of World (ROW) - Market size and forecast 2025-2030 ($ million)
Data Table on Rest of World (ROW) - Market size and forecast 2025-2030 ($ million)
Chart on Rest of World (ROW) - Year-over-year growth 2025-2030 (%)
Data Table on Rest of World (ROW) - Year-over-year growth 2025-2030 (%)
Chart on Regional Comparison - Rest of World (ROW)
Data Table on Regional Comparison - Rest of World (ROW)

12.6.1 Brazil - Market size and forecast 2025-2030

Chart on Brazil - Market size and forecast 2025-2030 ($ million)
Data Table on Brazil - Market size and forecast 2025-2030 ($ million)
Chart on Brazil - Year-over-year growth 2025-2030 (%)
Data Table on Brazil - Year-over-year growth 2025-2030 (%)

12.6.2 Turkey - Market size and forecast 2025-2030

Chart on Turkey - Market size and forecast 2025-2030 ($ million)
Data Table on Turkey - Market size and forecast 2025-2030 ($ million)
Chart on Turkey - Year-over-year growth 2025-2030 (%)
Data Table on Turkey - Year-over-year growth 2025-2030 (%)

12.6.3 Saudi Arabia - Market size and forecast 2025-2030

Chart on Saudi Arabia - Market size and forecast 2025-2030 ($ million)
Data Table on Saudi Arabia - Market size and forecast 2025-2030 ($ million)
Chart on Saudi Arabia - Year-over-year growth 2025-2030 (%)
Data Table on Saudi Arabia - Year-over-year growth 2025-2030 (%)

12.6.4 South Africa - Market size and forecast 2025-2030

Chart on South Africa - Market size and forecast 2025-2030 ($ million)
Data Table on South Africa - Market size and forecast 2025-2030 ($ million)
Chart on South Africa - Year-over-year growth 2025-2030 (%)
Data Table on South Africa - Year-over-year growth 2025-2030 (%)

12.6.5 Argentina - Market size and forecast 2025-2030

Chart on Argentina - Market size and forecast 2025-2030 ($ million)
Data Table on Argentina - Market size and forecast 2025-2030 ($ million)
Chart on Argentina - Year-over-year growth 2025-2030 (%)
Data Table on Argentina - Year-over-year growth 2025-2030 (%)

12.6.6 UAE - Market size and forecast 2025-2030

Chart on UAE - Market size and forecast 2025-2030 ($ million)
Data Table on UAE - Market size and forecast 2025-2030 ($ million)
Chart on UAE - Year-over-year growth 2025-2030 (%)
Data Table on UAE - Year-over-year growth 2025-2030 (%)

12.6.7 Colombia - Market size and forecast 2025-2030

Chart on Colombia - Market size and forecast 2025-2030 ($ million)
Data Table on Colombia - Market size and forecast 2025-2030 ($ million)
Chart on Colombia - Year-over-year growth 2025-2030 (%)
Data Table on Colombia - Year-over-year growth 2025-2030 (%)

12.6.8 Israel - Market size and forecast 2025-2030

Chart on Israel - Market size and forecast 2025-2030 ($ million)
Data Table on Israel - Market size and forecast 2025-2030 ($ million)
Chart on Israel - Year-over-year growth 2025-2030 (%)
Data Table on Israel - Year-over-year growth 2025-2030 (%)

12.7 Market opportunity by geography

Market opportunity by geography ($ million)
Data Tables on Market opportunity by geography ($ million)

13. Drivers, Challenges, and Opportunity

13.1 Market drivers

Expansion of e-commerce and digital health platforms
Rise in cosmeceutical and skin health demand
Integration into multi-functional and fortified formulations

13.2 Market challenges

Intense price competition and profit erosion
Rising consumer skepticism and misinformation
Packaging sustainability and environmental impact

13.3 Impact of drivers and challenges

Impact of drivers and challenges in 2025 and 2030

13.4 Market opportunities

Surge in synergistic combination formulations
Expansion of modernized gummy formulations
Localization of high-volume manufacturing

14. Competitive Landscape

14.1 Overview

14.2

Overview on criticality of inputs and factors of differentiation

14.3 Landscape disruption

Overview on factors of disruption

14.4 Industry risks

Impact of key risks on business

15. Competitive Analysis

15.1 Companies profiled

Companies covered

15.2 Company ranking index

15.3 Market positioning of companies

Matrix on companies position and classification

15.4 Amway Corp.

Amway Corp. - Overview
Amway Corp. - Product / Service
Amway Corp. - Key offerings
SWOT

15.5 Bayer AG

Bayer AG - Overview
Bayer AG - Business segments
Bayer AG - Key news
Bayer AG - Key offerings
Bayer AG - Segment focus
SWOT

15.6 Better Being Corp.

Better Being Corp. - Overview
Better Being Corp. - Product / Service
Better Being Corp. - Key offerings
SWOT

15.7 Blackmores Ltd.

Blackmores Ltd. - Overview
Blackmores Ltd. - Product / Service
Blackmores Ltd. - Key offerings
SWOT

15.8 Haleon Plc

Haleon Plc - Overview
Haleon Plc - Business segments
Haleon Plc - Key offerings
Haleon Plc - Segment focus
SWOT

15.9 Herbalife International Inc.

Herbalife International Inc. - Overview
Herbalife International Inc. - Product / Service
Herbalife International Inc. - Key offerings
SWOT

15.10 Jamieson Wellness Inc.

Jamieson Wellness Inc. - Overview
Jamieson Wellness Inc. - Business segments
Jamieson Wellness Inc. - Key offerings
Jamieson Wellness Inc. - Segment focus
SWOT

15.11 Nordic Naturals Inc.

Nordic Naturals Inc. - Overview
Nordic Naturals Inc. - Product / Service
Nordic Naturals Inc. - Key offerings
SWOT

15.12 NOW Health Group Inc.

NOW Health Group Inc. - Overview
NOW Health Group Inc. - Product / Service
NOW Health Group Inc. - Key offerings
SWOT

15.13 Pharmavite LLC

Pharmavite LLC - Overview
Pharmavite LLC - Product / Service
Pharmavite LLC - Key offerings
SWOT

15.14 Pure Encapsulations LLC

Pure Encapsulations LLC - Overview
Pure Encapsulations LLC - Product / Service
Pure Encapsulations LLC - Key offerings
SWOT

15.15 Reckitt Benckiser Group Plc

Reckitt Benckiser Group Plc - Overview
Reckitt Benckiser Group Plc - Business segments
Reckitt Benckiser Group Plc - Key offerings
Reckitt Benckiser Group Plc - Segment focus
SWOT

15.16 Solgar Inc.

Solgar Inc. - Overview
Solgar Inc. - Product / Service
Solgar Inc. - Key offerings
SWOT

15.17 Thorne HealthTech Inc.

Thorne HealthTech Inc. - Overview
Thorne HealthTech Inc. - Product / Service
Thorne HealthTech Inc. - Key offerings
SWOT

15.18 USANA Health Science Inc.

USANA Health Science Inc. - Overview
USANA Health Science Inc. - Product / Service
USANA Health Science Inc. - Key offerings
SWOT

16. Appendix

16.1 Scope of the report

Market definition
Objectives
Notes and caveats

16.2 Inclusions and exclusions checklist

Inclusions checklist
Exclusions checklist

16.3 Currency conversion rates for US$

16.4 Research methodology

16.5 Data procurement

Information sources

16.6 Data validation

16.7 Validation techniques employed for market sizing

16.8 Data synthesis

16.9 360 degree market analysis

16.10 List of abbreviations

Research Methodology

Technavio presents a detailed picture of the market by way of study, synthesis, and summation of data from multiple sources. The analysts have presented the various facets of the market with a particular focus on identifying the key industry influencers. The data thus presented is comprehensive, reliable, and the result of extensive research, both primary and secondary.

INFORMATION SOURCES

Primary sources

  • Manufacturers and suppliers
  • Channel partners
  • Industry experts
  • Strategic decision makers

Secondary sources

  • Industry journals and periodicals
  • Government data
  • Financial reports of key industry players
  • Historical data
  • Press releases

DATA ANALYSIS

Data Synthesis

  • Collation of data
  • Estimation of key figures
  • Analysis of derived insights

Data Validation

  • Triangulation with data models
  • Reference against proprietary databases
  • Corroboration with industry experts

REPORT WRITING

Qualitative

  • Market drivers
  • Market challenges
  • Market trends
  • Five forces analysis

Quantitative

  • Market size and forecast
  • Market segmentation
  • Geographical insights
  • Competitive landscape

Interested in this report?

Get your sample now to see our research methodology and insights!

Download Now

Frequently Asked Questions

Vitamin C Supplements market growth will increase by USD 6622.6 million during 2026-2030.

The Vitamin C Supplements market is expected to grow at a CAGR of 8.9% during 2026-2030.

Vitamin C Supplements market is segmented by Distribution channel (Offline, Online) Product type (Tablets, Capsules, Gummies, Others) Age group (Adults, Elderly, Athletes and fitness enthusiasts, Children)

Amway Corp., Bayer AG, Better Being Corp., Blackmores Ltd., Carlson Laboratories Inc., Country Life Vitamins LLC, Doctors Best, Douglas Laboratories, Garden of Life LLC, Haleon Plc, Herbalife International Inc., Jamieson Wellness Inc., Jarrow Formulas Inc., Life Extension, MegaFood, Natures Way Brands LLC, Nordic Naturals Inc., NOW Health Group Inc., Pharmavite LLC, Pure Encapsulations LLC, Reckitt Benckiser Group Plc, Solgar Inc., Thorne HealthTech Inc., USANA Health Science Inc. are a few of the key vendors in the Vitamin C Supplements market.

North America will register the highest growth rate of 41.4% among the other regions. Therefore, the Vitamin C Supplements market in North America is expected to garner significant business opportunities for the vendors during the forecast period.

US, Canada, Mexico, Germany, UK, France, Italy, Spain, The Netherlands, China, Japan, India, South Korea, Indonesia, Thailand, Brazil, Turkey, Saudi Arabia, South Africa, Argentina, UAE, Colombia, Israel

  • Expansion of e-commerce and digital health platforms is the driving factor this market.

The Vitamin C Supplements market vendors should focus on grabbing business opportunities from the Distribution channel segment as it accounted for the largest market share in the base year.
RIA - Research AI Assistant
Ask RIA
