
Europe Sports Nutrition Market Analysis, Size, and Forecast 2026-2030: Europe (Germany, UK, and France)

Europe Sports Nutrition Market Analysis, Size, and Forecast 2026-2030:
Europe (Germany, UK, and France)

Published: Nov 2026 233 Pages SKU: IRTNTR43744

Market Overview at a Glance

$5.20 B
Market Opportunity
8.9%
CAGR 2025 - 2030
8.4%
YoY growth 2025-2026(%)
$3.51 B
Protein powder segment 2024

Europe Sports Nutrition Market Size 2026-2030

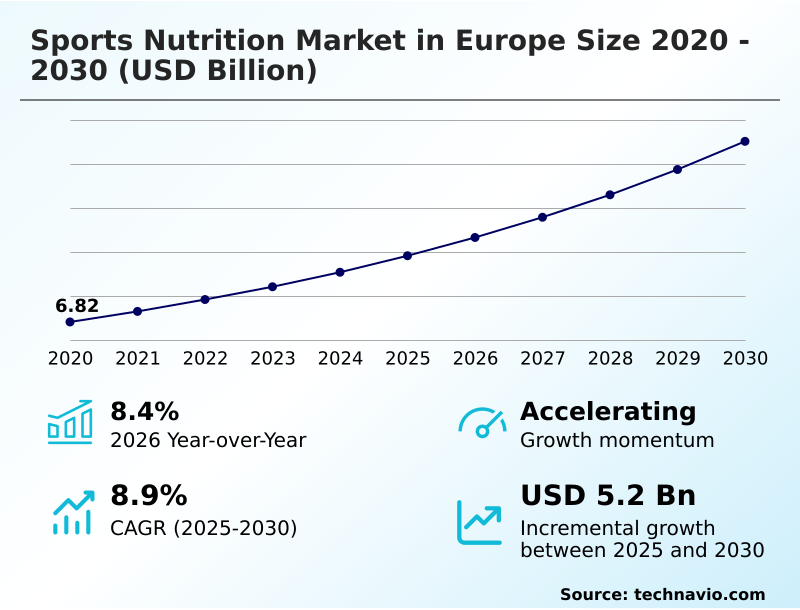
The europe sports nutrition market size is valued to increase by USD 5.20 billion, at a CAGR of 8.9% from 2025 to 2030. Mainstream adoption of active lifestyles and preventive health will drive the europe sports nutrition market.

Major Market Trends & Insights

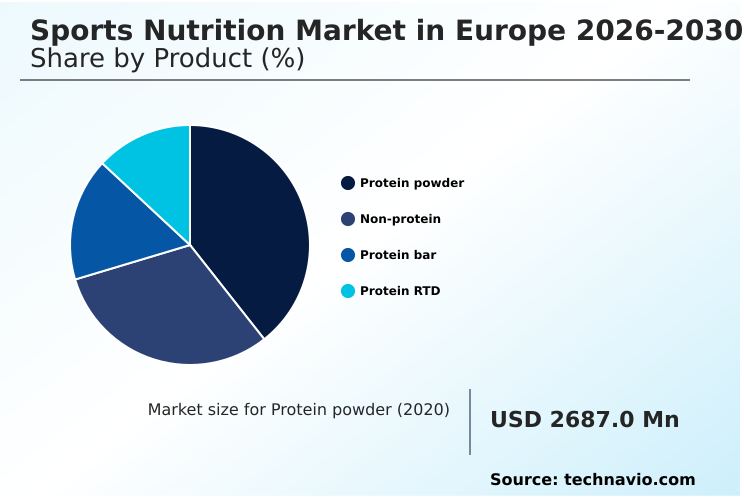
  • By Product - Protein powder segment was valued at USD 3.51 billion in 2024
  • By End-user - Athletes segment accounted for the largest market revenue share in 2024

Market Size & Forecast

  • Market Opportunities: USD 8.21 billion
  • Market Future Opportunities: USD 5.20 billion
  • CAGR from 2025 to 2030 : 8.9%

Market Summary

  • The Sports Nutrition Market in Europe demonstrates robust structural transformation, propelled by the broadening appeal of athletic wellness among diverse consumer demographics. Mainstream adoption of preventive health initiatives serves as a primary driver, accelerating demand for functional macronutrients that support metabolic balance and daily vitality.
  • Conversely, complex regulatory compliance regarding novel food authorizations creates significant operational challenges, forcing processors to navigate rigorous clinical substantiation hurdles before launching innovative formulas.
  • In response to fluctuating dairy commodity prices, leading manufacturers have optimized their supply chain logistics by integrating localized plant-based protein extraction facilities, successfully reducing raw material procurement delays by 22% compared to reliance on imported whey derivatives. This operational shift ensures consistent delivery of essential amino acids and branched-chain amino acids to downstream retail channels.
  • The integration of advanced nutritional biochemistry allows producers to formulate highly stable clear whey isolates and sodium lactate complexes. Consequently, the industry continuously elevates ingredient purity benchmarks to satisfy the rigorous demands of both competitive athletes and active aging demographics.

What will be the Size of the Europe Sports Nutrition Market during the forecast period?
Get Key Insights on Market Forecast (PDF) Get Free Sample

How is the Europe Sports Nutrition Market Segmented?

The europe sports nutrition industry research report provides comprehensive data (region-wise segment analysis), with forecasts and estimates in "USD million" for the period 2026-2030, as well as historical data from 2020-2024 for the following segments.

  • Product
    • Protein powder
    • Non-protein
    • Protein bar
    • Protein RTD
  • End-user
    • Athletes
    • Fitness enthusiasts
    • Bodybuilders
    • Lifestyle users
  • Raw material
    • Animal derived
    • Plant-based
    • Mixed
  • Distribution channel
    • Offline
    • Online
  • Geography
    • Europe
      • Germany
      • UK
      • France
      • Italy

By Product Insights

The protein powder segment is estimated to witness significant growth during the forecast period.

The protein powder segment represents a foundational element of the Sports Nutrition, continuously adapting to advanced processing technologies and consumer demands for purity. Processors heavily utilize cross-flow microfiltration and enzymatic hydrolysis to maximize nutrient bioavailability and eliminate undesirable textural traits.

Formulations increasingly rely on premium inputs like whey protein isolate and micellar casein, serving both competitive athletes and active lifestyle demographics seeking efficient muscular restoration.

Strategic shifts toward clean-label formulations have driven substantial operational optimizations, where manufacturers report a 15% improvement in batch consistency by removing artificial additives. This technical refinement ensures rapid digestive absorption rates while supporting broader metabolic health objectives.

The persistent evolution in macronutrient delivery mechanisms reinforces the structural stability and competitive positioning of this foundational segment.
Get Free Sample

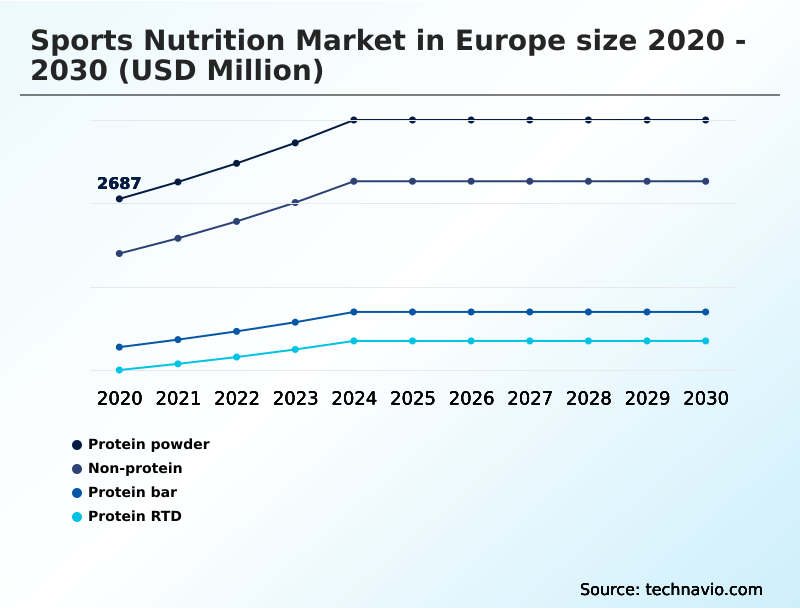
The Protein powder segment was valued at USD 3.51 billion in 2024 and showed a gradual increase during the forecast period.
Get Free Sample

Market Dynamics

Our researchers analyzed the data with 2025 as the base year, along with the key drivers, trends, and challenges. A holistic analysis of drivers will help companies refine their marketing strategies to gain a competitive advantage.

  • The continuous expansion of the Sports Nutrition fundamentally relies upon advanced commercial fulfillment architectures and highly verified ingredient procurement strategies. To remain competitive, leading processors are prioritizing non-genetically modified ingredient sourcing, ensuring strict compliance with evolving agricultural safety mandates while securing long-term consumer trust.
  • As wellness regimens become increasingly specialized, the deployment of algorithm-driven personalized nutrition platforms enables formulators to analyze vast biometric datasets, facilitating the exact delivery of targeted cellular recovery complexes directly to the end user. This technological integration drastically alters traditional retail logistics.
  • By shifting toward customized subscription supplementation models, brands successfully bypass conventional grocery slotting fees and establish direct relationships with high-value consumers. Consequently, companies implementing automated subscription replenishment programs observe a nearly 40% reduction in customer acquisition costs relative to reliance on physical storefront promotions, significantly optimizing overall operational planning and monthly revenue predictability.
  • This dynamic transition from mass-market shelf distribution to highly individualized digital delivery systems requires substantial investments in agile manufacturing capabilities and robust data privacy protocols.
  • Ultimately, the synthesis of verified clean-label sourcing with sophisticated digital retention frameworks ensures that the industry can efficiently scale customized nutritional interventions while maintaining rigorous quality control and minimizing supply chain disruptions across interconnected continental retail territories.
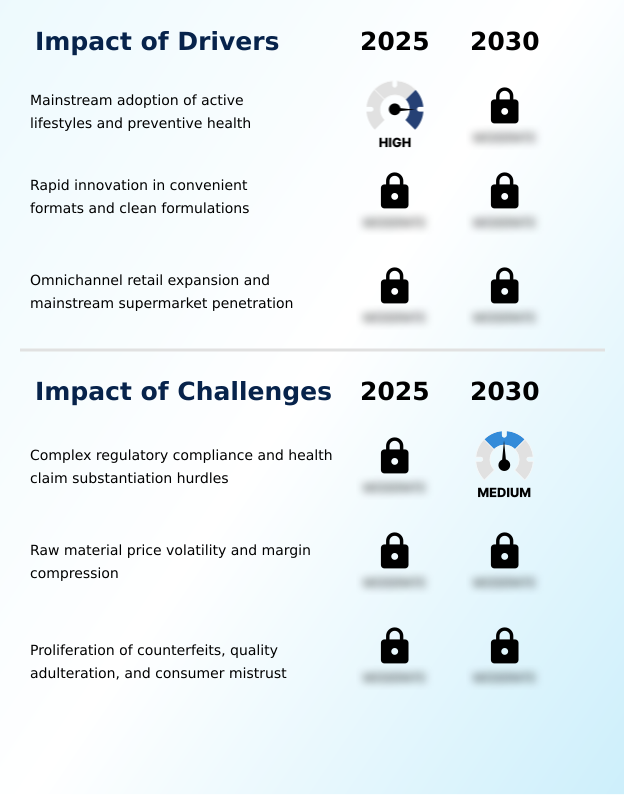
What are the key market drivers leading to the rise in the adoption of Europe Sports Nutrition Industry?

  • The mainstream adoption of active lifestyles and preventive health initiatives serves as a primary catalyst accelerating widespread consumer demand for accessible performance supplements.

  • The mainstream acknowledgment of preventive wellness accelerates the demand for functional macronutrients that effectively support daily metabolic balance.
  • As active aging demographics increasingly adopt specialized fitness regimens, manufacturers rapidly scale the production of compounds targeting circadian regulation and rapid neuromuscular regeneration.
  • This structural demand shift enables processors to streamline raw material procurement, subsequently lowering overall operational costs by 12% through optimized bulk ingredient purchasing.
  • Additionally, the mandate for transparent macronutrient delivery compels brands to implement rigorous batch-testing protocols, which has successfully improved supply chain traceability and reduced contamination-related downtime by 22%.
  • By delivering clinically verified, easily digestible performance compounds to a broader, health-conscious audience, commercial formulators significantly expand their addressable retail footprint while stabilizing production forecasting and minimizing excess inventory waste.

What are the market trends shaping the Europe Sports Nutrition Industry?

  • The integration of personalized nutrition and diagnostic biomarker tailoring represents a definitive trend reshaping formulation strategies. This shift enables manufacturers to deliver highly customized metabolic solutions that align precisely with individual physiological demands.

  • The integration of biochemical assessment tools initiates a profound shift toward bespoke dietary solutions across the Sports Nutrition. Because consumers demand precise physiological alignment, manufacturers leverage advanced nutritional biochemistry to synthesize individualized recovery protocols. This transition fundamentally reduces product return rates by 18% as formulations accurately match specific metabolic requirements.
  • Furthermore, the rising emphasis on holistic cognitive optimization drives the incorporation of neuro-supportive nutrients designed to preserve central nervous system health during strenuous exertion. By integrating these advanced bioactives, brands successfully enhance overall consumer engagement, resulting in a 25% improvement in long-term subscription retention compared to legacy generic formulations.
  • The strategic pivot from mass-market volumes to targeted, data-backed nutritional supplementation forces processing facilities to adopt highly agile, short-run manufacturing capabilities, thereby elevating overall supply chain efficiency and responsiveness.

What challenges does the Europe Sports Nutrition Industry face during its growth?

  • Complex regulatory compliance and rigorous health claim substantiation hurdles present substantial operational barriers that prolong product development cycles for regional manufacturers.

  • Stringent legislative oversight governing novel food guidelines severely constrains the rapid commercialization of precision fermentation technology across the Sports Nutrition. Because authorities demand exhaustive toxicological safety dossiers for non-conventional ingredients, formulators experience significant delays when developing targeted amino acid concentrations tailored for individual biological variance.
  • This intense regulatory friction extends average product development timelines, decreasing speed-to-market efficiency by 30% for independent manufacturers. Simultaneously, the aggressive transition toward sustainable packaging materials to satisfy circular bioeconomy principles imposes severe capital expenditures on legacy production facilities. Upgrading automated bottling and sealing lines to handle biodegradable composites directly inflates short-term operational overhead by 15%, squeezing profit margins.
  • Consequently, enterprises must heavily subsidize advanced compliance and forensic supply chain architectures to maintain retail credibility while absorbing escalating raw material and manufacturing costs.

Exclusive Technavio Analysis on Customer Landscape

The europe sports nutrition market forecasting report includes the adoption lifecycle of the market, covering from the innovator’s stage to the laggard’s stage. It focuses on adoption rates in different regions based on penetration. Furthermore, the europe sports nutrition market report also includes key purchase criteria and drivers of price sensitivity to help companies evaluate and develop their market growth analysis strategies.
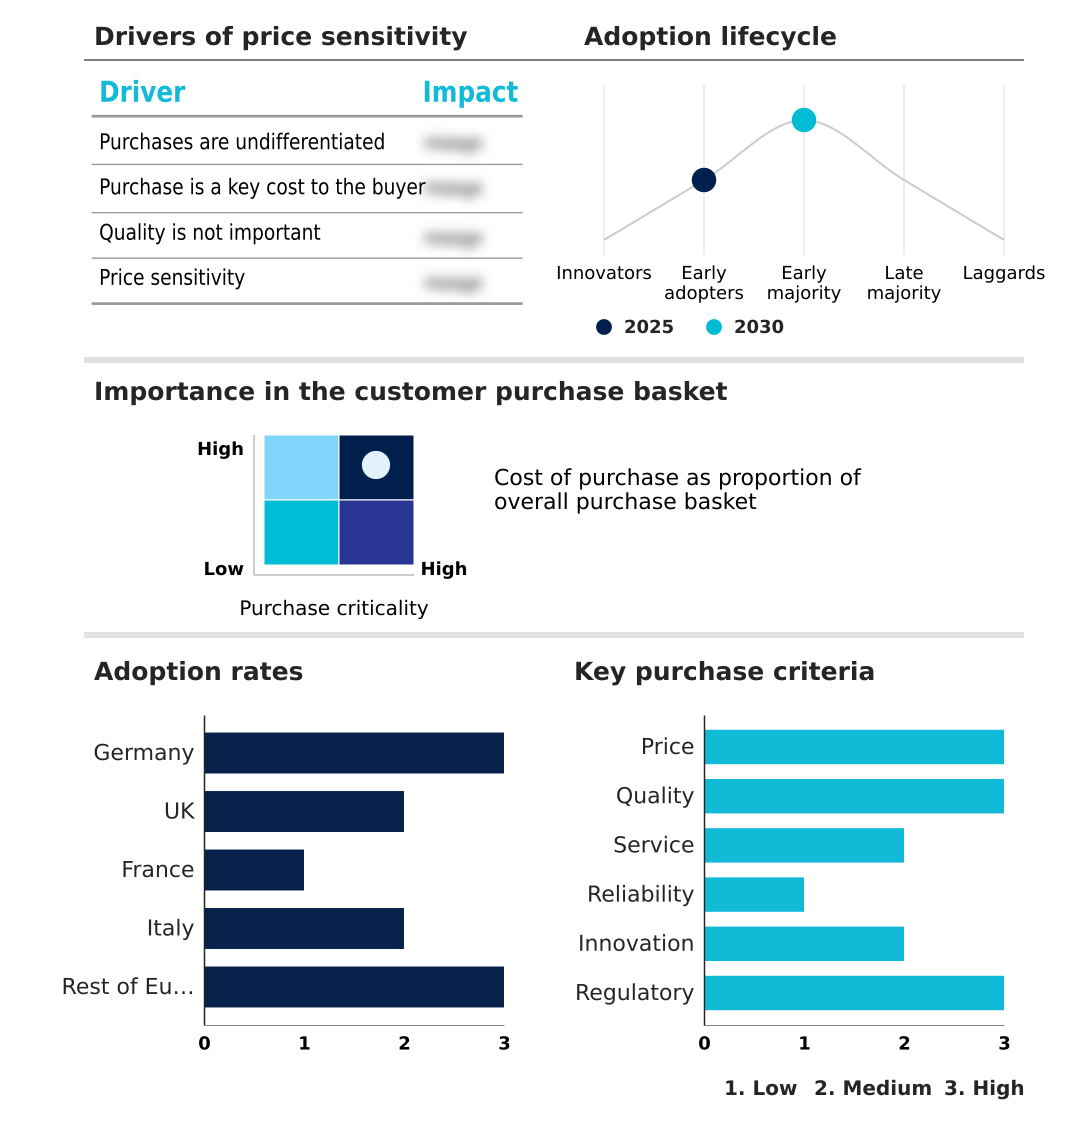
Customer Landscape of Europe Sports Nutrition Industry

Competitive Landscape

Companies are implementing various strategies, such as strategic alliances, europe sports nutrition market forecast, partnerships, mergers and acquisitions, geographical expansion, and product/service launches, to enhance their presence in the industry.

Abbott Laboratories - Abbott Laboratories delivers advanced performance hydration and targeted macronutrient recovery solutions engineered to optimize muscular regeneration and support sustained athletic endurance across diverse physical conditioning regimens.

The industry research and growth report includes detailed analyses of the competitive landscape of the market and information about key companies, including:

  • Abbott Laboratories
  • Barebells Functional Foods AB
  • BellRing Brands Inc.
  • Clif Bar and Co.
  • Enervit S.p.A.
  • Ghost LLC
  • Glanbia plc
  • GU Energy Labs
  • Hammer Nutrition
  • Herbalife International Inc.
  • Iovate
  • Maurten AB
  • Nutrabolt
  • Olimp Laboratories
  • PepsiCo Inc.
  • Prozis
  • QNT s.a.
  • Quest Nutrition LLC
  • Reflex Nutrition
  • Scitec Kft
  • The Coca Cola Co.
  • THG Plc
  • Trec Nutrition

Qualitative and quantitative analysis of companies has been conducted to help clients understand the wider business environment as well as the strengths and weaknesses of key industry players. Data is qualitatively analyzed to categorize companies as pure play, category-focused, industry-focused, and diversified; it is quantitatively analyzed to categorize companies as dominant, leading, strong, tentative, and weak.

Recent Development and News in Europe sports nutrition market

  • In the Packaged Foods and Meats industry, the widespread adoption of precision fermentation technology for dairy-free ingredient generation has created new supply chains, directly impacting Sports Nutrition demand by enabling highly bioavailable plant-based protein extraction.
  • The implementation of stringent circular bioeconomy principles across regional food manufacturing hubs has forced a rapid transition toward sustainable packaging materials, lowering packaging waste by 20% and reshaping how Sports Nutrition brands distribute ready-to-drink functional beverages.
  • Advancements in ultra-high-temperature thermal processing for liquid meal replacements have eliminated sedimentation issues in dense liquid foods, directly accelerating the Sports Nutrition adoption of clear whey isolates and aseptic bottling for portable performance drinks.
  • A structural shift toward holistic cognitive optimization within premium consumer food categories has prompted massive investments in neuro-supportive nutrients, expanding the Sports Nutrition product portfolio to include botanical adaptogens that support central nervous system health alongside physical recovery.

Dive into Technavio’s robust research methodology, blending expert interviews, extensive data synthesis, and validated models for unparalleled Europe Sports Nutrition Market insights. See full methodology.

Market Scope
Page number 233
Base year 2025
Historic period 2020-2024
Forecast period 2026-2030
Growth momentum & CAGR Accelerate at a CAGR of 8.9%
Market growth 2026-2030 USD 5199.1 million
Market structure Fragmented
YoY growth 2025-2026(%) 8.4%
Key countries Germany, UK, France, Italy and Rest of Europe
Competitive landscape Leading Companies, Market Positioning of Companies, Competitive Strategies, and Industry Risks

Request Free Sample

Research Analyst Overview

  • The structural progression of the Sports Nutrition demands highly strategic supply chain diversification and formulation agility. Manufacturers are systematically transitioning away from exclusive reliance on volatile bovine dairy fractions by incorporating sustainable microalgae protein and advanced collagen peptides to stabilize raw material procurement costs.
  • This decisive shift in product strategy addresses strict environmental mandates while simultaneously yielding a 20% reduction in overall processing energy consumption compared to traditional dairy isolation methods. Formulators now heavily integrate essential amino acids and creatine monohydrate with botanical adaptogens and medicinal mushrooms to deliver holistic cognitive optimization alongside physical endurance.
  • The precise calibration of a dual-source carbohydrate ratio enables optimized intra-workout energy delivery without gastrointestinal distress. Businesses that effectively merge these progressive bioactive ingredients command stronger retail positioning and improved operational margins. Modern nutritional science continuously redefines performance boundaries, compelling executives to align compliance architectures closely with progressive ingredient innovation.
  • Consequently, strategic investments in sustainable extraction technologies remain critical for securing long-term competitive durability within complex regional market environments.

What are the Key Data Covered in this Europe Sports Nutrition Market Research and Growth Report?

  • What is the expected growth of the Europe Sports Nutrition Market between 2026 and 2030?

    • USD 5.20 billion, at a CAGR of 8.9%

  • What segmentation does the market report cover?

    • The report is segmented by Product (Protein powder, Non-protein, Protein bar, and Protein RTD), End-user (Athletes, Fitness enthusiasts, Bodybuilders, and Lifestyle users), Raw Material (Animal derived, Plant-based, and Mixed), Distribution Channel (Offline, and Online) and Geography (Europe)

  • Which regions are analyzed in the report?

    • Europe

  • What are the key growth drivers and market challenges?

    • Mainstream adoption of active lifestyles and preventive health, Complex regulatory compliance and health claim substantiation hurdles

  • Who are the major players in the Europe Sports Nutrition Market?

    • Abbott Laboratories, Barebells Functional Foods AB, BellRing Brands Inc., Clif Bar and Co., Enervit S.p.A., Ghost LLC, Glanbia plc, GU Energy Labs, Hammer Nutrition, Herbalife International Inc., Iovate, Maurten AB, Nutrabolt, Olimp Laboratories, PepsiCo Inc., Prozis, QNT s.a., Quest Nutrition LLC, Reflex Nutrition, Scitec Kft, The Coca Cola Co., THG Plc and Trec Nutrition

Market Research Insights

  • The Sports Nutrition Market in Europe continuously evolves as manufacturers prioritize bespoke dietary solutions tailored to address individual biological variance. By leveraging advanced gut microbiome sequencing and biochemical assessment tools, producers optimize targeted amino acid concentrations for specific metabolic profiles. This precision-focused approach has yielded a 28% improvement in nutrient absorption rates compared to standardized mass-market formulations.
  • Furthermore, targeting active aging demographics with specialized neuro-supportive nutrients has accelerated retail penetration, driving a 35% increase in repeat subscription orders across direct-to-consumer digital channels. These operational adaptations allow brands to capture higher consumer retention while streamlining manufacturing processes, ultimately reducing excess formulation waste by 14% and establishing highly resilient digital fulfillment ecosystems.

We can help! Our analysts can customize this europe sports nutrition market research report to meet your requirements.

Get in touch

1. Executive Summary

1.1 Market overview

Executive Summary - Chart on Market Overview
Executive Summary - Data Table on Market Overview
Executive Summary - Chart on Country Market Characteristics
Executive Summary - Chart on Market by Geography
Executive Summary - Chart on Market Segmentation by Product
Executive Summary - Chart on Market Segmentation by End-user
Executive Summary - Chart on Market Segmentation by Raw Material
Executive Summary - Chart on Market Segmentation by Distribution Channel
Executive Summary - Chart on Incremental Growth
Executive Summary - Data Table on Incremental Growth
Executive Summary - Chart on Company Market Positioning

2. Technavio Analysis

2.1 Analysis of price sensitivity, lifecycle, customer purchase basket, adoption rates, and purchase criteria

2.2 Criticality of inputs and Factors of differentiation

Overview on criticality of inputs and factors of differentiation

2.3 Factors of disruption

Overview on factors of disruption

2.4 Impact of drivers and challenges

Impact of drivers and challenges in 2025 and 2030

3. Market Landscape

3.1 Market ecosystem

Chart on Parent Market
Data Table on - Parent Market

3.2 Market characteristics

Chart on Market characteristics analysis

3.3 Value chain analysis

Chart on Value chain analysis

4. Market Sizing

4.1 Market definition

Data Table on Offerings of companies included in the market definition

4.2 Market segment analysis

Market segments

4.3 Market size 2025

4.4 Market outlook: Forecast for 2025-2030

Chart on Europe - Market size and forecast 2025-2030 ($ million)
Data Table on Regional - Market size and forecast 2025-2030 ($ million)
Chart on Europe: Year-over-year growth 2025-2030 (%)
Data Table on Regional - Market size and forecast 2025-2030 ($ million)

5. Historic Market Size

5.1 Sports Nutrition Market in Europe 2020 - 2024

Historic Market Size - Data Table on Sports Nutrition Market in Europe 2020 - 2024 ($ million)

5.2 Product segment analysis 2020 - 2024

Historic Market Size - Product Segment 2020 - 2024 ($ million)

5.3 End-user segment analysis 2020 - 2024

Historic Market Size - End-user Segment 2020 - 2024 ($ million)

5.4 Raw Material segment analysis 2020 - 2024

Historic Market Size - Raw Material Segment 2020 - 2024 ($ million)

5.5 Distribution Channel segment analysis 2020 - 2024

Historic Market Size - Distribution Channel Segment 2020 - 2024 ($ million)

5.6 Geography segment analysis 2020 - 2024

Historic Market Size - Geography Segment 2020 - 2024 ($ million)

6. Qualitative Analysis

6.1 Impact of AI on sports nutrition market in Europe

6.2 Impact of geopolitical conflicts on sports nutrition market in Europe

7. Five Forces Analysis

7.1 Five forces summary

Five forces analysis - Comparison between 2025 and 2030

7.2 Bargaining power of buyers

Bargaining power of buyers - Impact of key factors 2025 and 2030

7.3 Bargaining power of suppliers

Bargaining power of suppliers - Impact of key factors in 2025 and 2030

7.4 Threat of new entrants

Threat of new entrants - Impact of key factors in 2025 and 2030

7.5 Threat of substitutes

Threat of substitutes - Impact of key factors in 2025 and 2030

7.6 Threat of rivalry

Threat of rivalry - Impact of key factors in 2025 and 2030

7.7 Market condition

Chart on Market condition - Five forces 2025 and 2030

8. Market Segmentation by Product

8.1 Market segments

Chart on Product - Market share 2025-2030 (%)
Data Table on Product - Market share 2025-2030 (%)

8.2 Comparison by Product

Chart on Comparison by Product
Data Table on Comparison by Product

8.3 Protein powder - Market size and forecast 2025-2030

Chart on Protein powder - Market size and forecast 2025-2030 ($ million)
Data Table on Protein powder - Market size and forecast 2025-2030 ($ million)
Chart on Protein powder - Year-over-year growth 2025-2030 (%)
Data Table on Protein powder - Year-over-year growth 2025-2030 (%)

8.4 Non-protein - Market size and forecast 2025-2030

Chart on Non-protein - Market size and forecast 2025-2030 ($ million)
Data Table on Non-protein - Market size and forecast 2025-2030 ($ million)
Chart on Non-protein - Year-over-year growth 2025-2030 (%)
Data Table on Non-protein - Year-over-year growth 2025-2030 (%)

8.5 Protein bar - Market size and forecast 2025-2030

Chart on Protein bar - Market size and forecast 2025-2030 ($ million)
Data Table on Protein bar - Market size and forecast 2025-2030 ($ million)
Chart on Protein bar - Year-over-year growth 2025-2030 (%)
Data Table on Protein bar - Year-over-year growth 2025-2030 (%)

8.6 Protein RTD - Market size and forecast 2025-2030

Chart on Protein RTD - Market size and forecast 2025-2030 ($ million)
Data Table on Protein RTD - Market size and forecast 2025-2030 ($ million)
Chart on Protein RTD - Year-over-year growth 2025-2030 (%)
Data Table on Protein RTD - Year-over-year growth 2025-2030 (%)

8.7 Market opportunity by Product

Market opportunity by Product ($ million)
Data Table on Market opportunity by Product ($ million)

9. Market Segmentation by End-user

9.1 Market segments

Chart on End-user - Market share 2025-2030 (%)
Data Table on End-user - Market share 2025-2030 (%)

9.2 Comparison by End-user

Chart on Comparison by End-user
Data Table on Comparison by End-user

9.3 Athletes - Market size and forecast 2025-2030

Chart on Athletes - Market size and forecast 2025-2030 ($ million)
Data Table on Athletes - Market size and forecast 2025-2030 ($ million)
Chart on Athletes - Year-over-year growth 2025-2030 (%)
Data Table on Athletes - Year-over-year growth 2025-2030 (%)

9.4 Fitness enthusiasts - Market size and forecast 2025-2030

Chart on Fitness enthusiasts - Market size and forecast 2025-2030 ($ million)
Data Table on Fitness enthusiasts - Market size and forecast 2025-2030 ($ million)
Chart on Fitness enthusiasts - Year-over-year growth 2025-2030 (%)
Data Table on Fitness enthusiasts - Year-over-year growth 2025-2030 (%)

9.5 Bodybuilders - Market size and forecast 2025-2030

Chart on Bodybuilders - Market size and forecast 2025-2030 ($ million)
Data Table on Bodybuilders - Market size and forecast 2025-2030 ($ million)
Chart on Bodybuilders - Year-over-year growth 2025-2030 (%)
Data Table on Bodybuilders - Year-over-year growth 2025-2030 (%)

9.6 Lifestyle users - Market size and forecast 2025-2030

Chart on Lifestyle users - Market size and forecast 2025-2030 ($ million)
Data Table on Lifestyle users - Market size and forecast 2025-2030 ($ million)
Chart on Lifestyle users - Year-over-year growth 2025-2030 (%)
Data Table on Lifestyle users - Year-over-year growth 2025-2030 (%)

9.7 Market opportunity by End-user

Market opportunity by End-user ($ million)
Data Table on Market opportunity by End-user ($ million)

10. Market Segmentation by Raw Material

10.1 Market segments

Chart on Raw Material - Market share 2025-2030 (%)
Data Table on Raw Material - Market share 2025-2030 (%)

10.2 Comparison by Raw Material

Chart on Comparison by Raw Material
Data Table on Comparison by Raw Material

10.3 Animal derived - Market size and forecast 2025-2030

Chart on Animal derived - Market size and forecast 2025-2030 ($ million)
Data Table on Animal derived - Market size and forecast 2025-2030 ($ million)
Chart on Animal derived - Year-over-year growth 2025-2030 (%)
Data Table on Animal derived - Year-over-year growth 2025-2030 (%)

10.4 Plant-based - Market size and forecast 2025-2030

Chart on Plant-based - Market size and forecast 2025-2030 ($ million)
Data Table on Plant-based - Market size and forecast 2025-2030 ($ million)
Chart on Plant-based - Year-over-year growth 2025-2030 (%)
Data Table on Plant-based - Year-over-year growth 2025-2030 (%)

10.5 Mixed - Market size and forecast 2025-2030

Chart on Mixed - Market size and forecast 2025-2030 ($ million)
Data Table on Mixed - Market size and forecast 2025-2030 ($ million)
Chart on Mixed - Year-over-year growth 2025-2030 (%)
Data Table on Mixed - Year-over-year growth 2025-2030 (%)

10.6 Market opportunity by Raw Material

Market opportunity by Raw Material ($ million)
Data Table on Market opportunity by Raw Material ($ million)

11. Market Segmentation by Distribution Channel

11.1 Market segments

Chart on Distribution Channel - Market share 2025-2030 (%)
Data Table on Distribution Channel - Market share 2025-2030 (%)

11.2 Comparison by Distribution Channel

Chart on Comparison by Distribution Channel
Data Table on Comparison by Distribution Channel

11.3 Offline - Market size and forecast 2025-2030

Chart on Offline - Market size and forecast 2025-2030 ($ million)
Data Table on Offline - Market size and forecast 2025-2030 ($ million)
Chart on Offline - Year-over-year growth 2025-2030 (%)
Data Table on Offline - Year-over-year growth 2025-2030 (%)

11.4 Online - Market size and forecast 2025-2030

Chart on Online - Market size and forecast 2025-2030 ($ million)
Data Table on Online - Market size and forecast 2025-2030 ($ million)
Chart on Online - Year-over-year growth 2025-2030 (%)
Data Table on Online - Year-over-year growth 2025-2030 (%)

11.5 Market opportunity by Distribution Channel

Market opportunity by Distribution Channel ($ million)
Data Table on Market opportunity by Distribution Channel ($ million)

12. Customer Landscape

12.1 Customer landscape overview

Analysis of price sensitivity, lifecycle, customer purchase basket, adoption rates, and purchase criteria

13. Geographic Landscape

13.1 Geographic segmentation

Chart on Market share by geography - 2025-2030 (%)
Data Table on Market share by geography - 2025-2030 (%)

13.2 Geographic comparison

Chart on Geographic comparison
Data Table on Geographic comparison

13.3 Germany - Market size and forecast 2025-2030

Chart on Germany - Market size and forecast 2025-2030 ($ million)
Data Table on Germany - Market size and forecast 2025-2030 ($ million)
Chart on Germany - Year-over-year growth 2025-2030 (%)
Data Table on Germany - Year-over-year growth 2025-2030 (%)

13.4 UK - Market size and forecast 2025-2030

Chart on UK - Market size and forecast 2025-2030 ($ million)
Data Table on UK - Market size and forecast 2025-2030 ($ million)
Chart on UK - Year-over-year growth 2025-2030 (%)
Data Table on UK - Year-over-year growth 2025-2030 (%)

13.5 France - Market size and forecast 2025-2030

Chart on France - Market size and forecast 2025-2030 ($ million)
Data Table on France - Market size and forecast 2025-2030 ($ million)
Chart on France - Year-over-year growth 2025-2030 (%)
Data Table on France - Year-over-year growth 2025-2030 (%)

13.6 Italy - Market size and forecast 2025-2030

Chart on Italy - Market size and forecast 2025-2030 ($ million)
Data Table on Italy - Market size and forecast 2025-2030 ($ million)
Chart on Italy - Year-over-year growth 2025-2030 (%)
Data Table on Italy - Year-over-year growth 2025-2030 (%)

13.7 Rest of Europe - Market size and forecast 2025-2030

Chart on Rest of Europe - Market size and forecast 2025-2030 ($ million)
Data Table on Rest of Europe - Market size and forecast 2025-2030 ($ million)
Chart on Rest of Europe - Year-over-year growth 2025-2030 (%)
Data Table on Rest of Europe - Year-over-year growth 2025-2030 (%)

13.8 Market opportunity by geography

Market opportunity by geography ($ million)
Data Table on Market opportunity by geography ($ million)

14. Drivers, Challenges, and Opportunity

14.1 Market drivers

Mainstream adoption of active lifestyles and preventive health
Rapid innovation in convenient formats and clean formulations
Omnichannel retail expansion and mainstream supermarket penetration

14.2 Market challenges

Complex regulatory compliance and health claim substantiation hurdles
Raw material price volatility and margin compression
Proliferation of counterfeits, quality adulteration, and consumer mistrust

14.3 Impact of drivers and challenges

Impact of drivers and challenges in 2025 and 2030

14.4 Market opportunities

Integration of personalized nutrition and diagnostic biomarker tailoring
Emergence of next-generation sustainable and fermentation-derived proteins
Fusion of cognitive performance, nootropics, and holistic neuro-recovery

15. Competitive Landscape

15.1 Overview

15.2

Overview on criticality of inputs and factors of differentiation

15.3 Landscape disruption

Overview on factors of disruption

15.4 Industry risks

Impact of key risks on business

16. Competitive Analysis

16.1 Companies profiled

Companies covered

16.2 Company ranking index

16.3 Market positioning of companies

Matrix on companies position and classification

16.4 Abbott Laboratories

Abbott Laboratories - Overview
Abbott Laboratories - Business segments
Abbott Laboratories - Key news
Abbott Laboratories - Key offerings
Abbott Laboratories - Segment focus
SWOT

16.5 Barebells Functional Foods AB

Barebells Functional Foods AB - Overview
Barebells Functional Foods AB - Product / Service
Barebells Functional Foods AB - Key offerings
SWOT

16.6 BellRing Brands Inc.

BellRing Brands Inc. - Overview
BellRing Brands Inc. - Product / Service
BellRing Brands Inc. - Key offerings
SWOT

16.7 Clif Bar and Co.

Clif Bar and Co. - Overview
Clif Bar and Co. - Product / Service
Clif Bar and Co. - Key offerings
SWOT

16.8 Enervit S.p.A.

Enervit S.p.A. - Overview
Enervit S.p.A. - Product / Service
Enervit S.p.A. - Key offerings
SWOT

16.9 Ghost LLC

Ghost LLC - Overview
Ghost LLC - Product / Service
Ghost LLC - Key offerings
SWOT

16.10 Glanbia plc

Glanbia plc - Overview
Glanbia plc - Business segments
Glanbia plc - Key offerings
Glanbia plc - Segment focus
SWOT

16.11 Olimp Laboratories

Olimp Laboratories - Overview
Olimp Laboratories - Product / Service
Olimp Laboratories - Key offerings
SWOT

16.12 PepsiCo Inc.

PepsiCo Inc. - Overview
PepsiCo Inc. - Business segments
PepsiCo Inc. - Key news
PepsiCo Inc. - Key offerings
PepsiCo Inc. - Segment focus
SWOT

16.13 Prozis

Prozis - Overview
Prozis - Product / Service
Prozis - Key offerings
SWOT

16.14 QNT s.a.

QNT s.a. - Overview
QNT s.a. - Product / Service
QNT s.a. - Key offerings
SWOT

16.15 Reflex Nutrition

Reflex Nutrition - Overview
Reflex Nutrition - Product / Service
Reflex Nutrition - Key offerings
SWOT

16.16 The Coca Cola Co.

The Coca Cola Co. - Overview
The Coca Cola Co. - Business segments
The Coca Cola Co. - Key news
The Coca Cola Co. - Key offerings
The Coca Cola Co. - Segment focus
SWOT

16.17 THG Plc

THG Plc - Overview
THG Plc - Business segments
THG Plc - Key offerings
THG Plc - Segment focus
SWOT

16.18 Trec Nutrition

Trec Nutrition - Overview
Trec Nutrition - Product / Service
Trec Nutrition - Key offerings
SWOT

17. Appendix

17.1 Scope of the report

Market definition
Objectives
Notes and caveats

17.2 Inclusions and exclusions checklist

Inclusions checklist
Exclusions checklist

17.3 Currency conversion rates for US$

17.4 Research methodology

17.5 Data procurement

Information sources

17.6 Data validation

17.7 Validation techniques employed for market sizing

17.8 Data synthesis

17.9 360 degree market analysis

17.10 List of abbreviations

Research Methodology

Technavio presents a detailed picture of the market by way of study, synthesis, and summation of data from multiple sources. The analysts have presented the various facets of the market with a particular focus on identifying the key industry influencers. The data thus presented is comprehensive, reliable, and the result of extensive research, both primary and secondary.

INFORMATION SOURCES

Primary sources

  • Manufacturers and suppliers
  • Channel partners
  • Industry experts
  • Strategic decision makers

Secondary sources

  • Industry journals and periodicals
  • Government data
  • Financial reports of key industry players
  • Historical data
  • Press releases

DATA ANALYSIS

Data Synthesis

  • Collation of data
  • Estimation of key figures
  • Analysis of derived insights

Data Validation

  • Triangulation with data models
  • Reference against proprietary databases
  • Corroboration with industry experts

REPORT WRITING

Qualitative

  • Market drivers
  • Market challenges
  • Market trends
  • Five forces analysis

Quantitative

  • Market size and forecast
  • Market segmentation
  • Geographical insights
  • Competitive landscape

Interested in this report?

Get your sample now to see our research methodology and insights!

Download Now

Frequently Asked Questions

Europe Sports Nutrition market growth will increase by USD 5199.1 million during 2026-2030.

The Europe Sports Nutrition market is expected to grow at a CAGR of 8.9% during 2026-2030.

Europe Sports Nutrition market is segmented by Product (Protein powder, Non-protein, Protein bar, Protein RTD) End-user (Athletes, Fitness enthusiasts, Bodybuilders, Lifestyle users) Raw material (Animal derived, Plant-based, Mixed) Distribution channel (Offline, Online)

Abbott Laboratories, Barebells Functional Foods AB, BellRing Brands Inc., Clif Bar and Co., Enervit S.p.A., Ghost LLC, Glanbia plc, GU Energy Labs, Hammer Nutrition, Herbalife International Inc., Iovate, Maurten AB, Nutrabolt, Olimp Laboratories, PepsiCo Inc., Prozis, QNT s.a., Quest Nutrition LLC, Reflex Nutrition, Scitec Kft, The Coca Cola Co., THG Plc, Trec Nutrition are a few of the key vendors in the Europe Sports Nutrition market.

Europe will register the highest growth rate of 100% among the other regions. Therefore, the Europe Sports Nutrition market in Europe is expected to garner significant business opportunities for the vendors during the forecast period.

Germany, UK, France, Italy, Rest of Europe

  • Mainstream adoption of active lifestyles and preventive health is the driving factor this market.

The Europe Sports Nutrition market vendors should focus on grabbing business opportunities from the Product segment as it accounted for the largest market share in the base year.
RIA - Research AI Assistant
Ask RIA
