Sports App Market Analysis, Size, and Forecast 2026-2030: North America (US, Canada, and Mexico), APAC (China, India, and Japan), Europe (UK, Germany, and France), South America (Brazil, Argentina, and Colombia), Middle East and Africa (UAE, Saudi Arabia, and South Africa), and Rest of World (ROW)

Sports App Market Analysis, Size, and Forecast 2026-2030:
North America (US, Canada, and Mexico), APAC (China, India, and Japan), Europe (UK, Germany, and France), South America (Brazil, Argentina, and Colombia), Middle East and Africa (UAE, Saudi Arabia, and South Africa), and Rest of World (ROW)

Published: Apr 2026 279 Pages SKU: IRTNTR76546

Market Overview at a Glance

$3.96 B
Market Opportunity
12.3%
CAGR 2025 - 2030
30.9%
APAC Growth
$2.93 B
Health monitoring segment 2024

Sports App Market Size 2026-2030

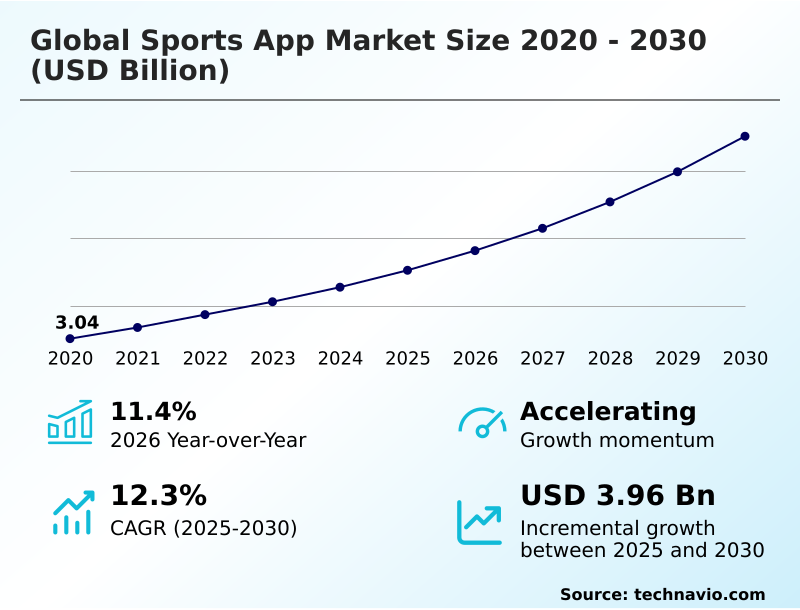
The sports app market size is valued to increase by USD 3.96 billion, at a CAGR of 12.3% from 2025 to 2030. Proliferation of low cost smartphones will drive the sports app market.

Major Market Trends & Insights

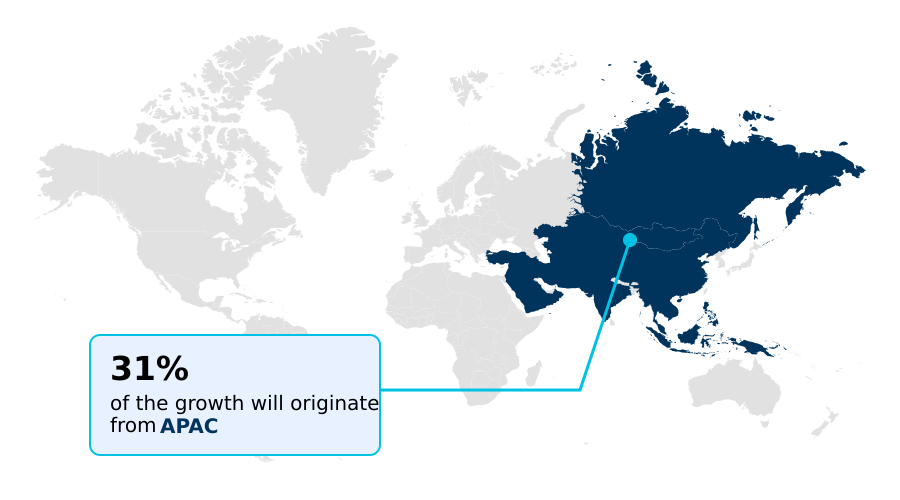
  • APAC dominated the market and accounted for a 30.9% growth during the forecast period.
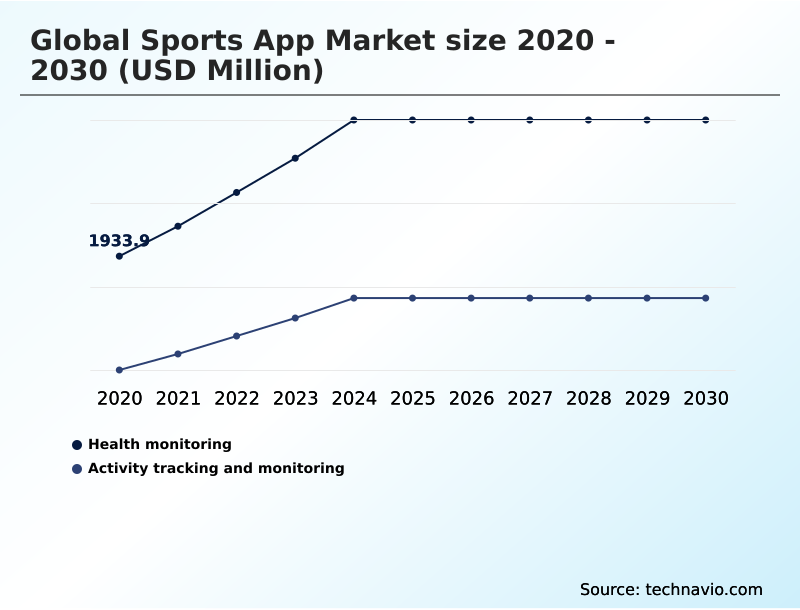
  • By Application - Health monitoring segment was valued at USD 2.93 billion in 2024
  • By Gender - Male segment accounted for the largest market revenue share in 2024

Market Size & Forecast

  • Market Opportunities: USD 5.99 billion
  • Market Future Opportunities: USD 3.96 billion
  • CAGR from 2025 to 2030 : 12.3%

Market Summary

  • The sports app market is undergoing a significant digital transformation, moving beyond simple score tracking to become sophisticated entertainment and wellness hubs. The increasing accessibility of high-speed mobile networks enables the seamless delivery of live streaming and on-demand video content, which are key drivers of user engagement.
  • A prominent trend is the integration of advanced technologies like augmented reality visuals, offering fans immersive experiences with features like real-time velocity metrics and tactical overlays. Concurrently, fitness-focused applications are leveraging wearable integration and mobile sensors to provide personalized athlete performance analytics and gamified fitness community platforms.
  • However, the industry faces challenges related to the complex and fragmented landscape of sports broadcasting rights. For instance, a media company must navigate numerous exclusive deals to build a comprehensive offering, using data from their apps to determine which content rights will yield the highest user acquisition and retention, thereby optimizing their significant investment in a competitive landscape.

What will be the Size of the Sports App Market during the forecast period?

Get Key Insights on Market Forecast (PDF) Request Free Sample

How is the Sports App Market Segmented?

The sports app industry research report provides comprehensive data (region-wise segment analysis), with forecasts and estimates in "USD million" for the period 2026-2030, as well as historical data from 2020-2024 for the following segments.

  • Application
    • Health monitoring
    • Activity tracking and monitoring
  • Gender
    • Male
    • Female
  • Platform
    • Google play store
    • Apple iOS store
  • Geography
    • North America
      • US
      • Canada
      • Mexico
    • APAC
      • China
      • India
      • Japan
    • Europe
      • UK
      • Germany
      • France
    • South America
      • Brazil
      • Argentina
      • Colombia
    • Middle East and Africa
      • UAE
      • Saudi Arabia
      • South Africa
    • Rest of World (ROW)

By Application Insights

The health monitoring segment is estimated to witness significant growth during the forecast period.

The health monitoring segment is evolving toward providing users with data of clinical-grade accuracy. This shift is driven by advancements in wearable technology ecosystems that capture biometric sensor data, including heart rate variability monitoring and blood oxygen saturation levels.

Platforms now leverage AI-driven fitness coaching and metabolic data analysis to offer insights previously reserved for professional athletes, such as muscle fatigue prediction. Some advanced systems now feature electronic health record integration, bridging consumer wellness and professional healthcare.

This evolution toward comprehensive, physiologically-based metrics, supported by AI-powered coaching algorithms and AI-powered sleep analysis for recovery optimization, defines the segment's premium tier, where strength and conditioning programs are data-informed, with platforms reporting up to a 20% improvement in user adherence to health plans.

Request Free Sample

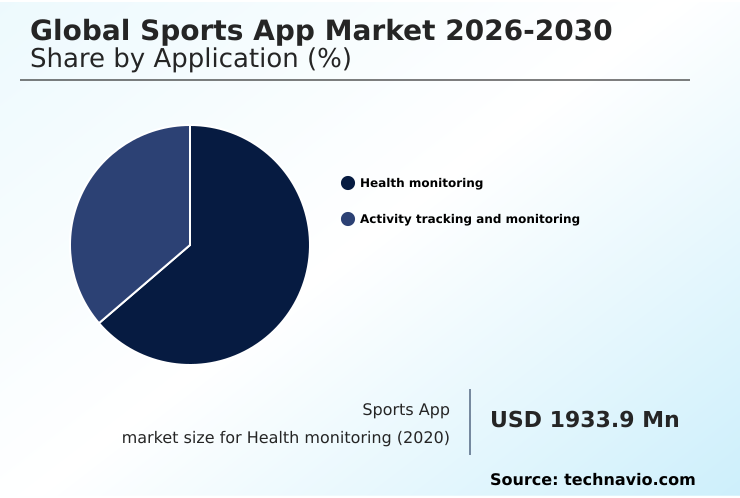
The Health monitoring segment was valued at USD 2.93 billion in 2024 and showed a gradual increase during the forecast period.

Request Free Sample

Regional Analysis

APAC is estimated to contribute 30.9% to the growth of the global market during the forecast period.Technavio’s analysts have elaborately explained the regional trends and drivers that shape the market during the forecast period.

See How Sports App Market Demand is Rising in APAC Request Free Sample

The market's geographic landscape shows distinct regional dynamics, with APAC leading incremental growth, contributing 30.9% of the global opportunity. This is fueled by high adoption of fitness and training applications centered on physical activity tracking and mobile sensor integration.

North America follows closely, representing 30.1% of the opportunity, where wearable device compatibility and personalized workout schedules drive high per-user monetization.

In Europe, which accounts for 28.7% of the market, there is a strong focus on personalized athlete analytics and the use of interactive 3D models.

The rise of gamified fitness communities and social mapping features is a global trend, with community-driven fitness challenges and youth sports team management tools gaining traction.

Some platforms in mature markets report a 40% higher average revenue per user through professional-grade coaching tools.
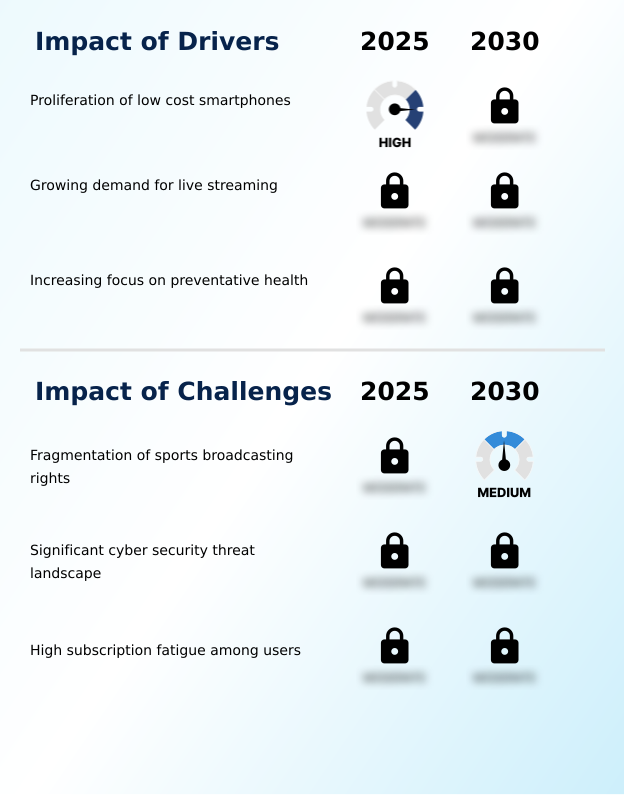
Market Dynamics

Our researchers analyzed the data with 2025 as the base year, along with the key drivers, trends, and challenges. A holistic analysis of drivers will help companies refine their marketing strategies to gain a competitive advantage.

  • The trajectory of the global sports app market is increasingly defined by technological convergence and evolving user expectations. The impact of 5G on sports streaming quality is profound, enabling higher-fidelity broadcasts and paving the way for mainstream adoption of augmented reality in live sports broadcasting.
  • This technological shift allows for the creation of virtual reality for immersive athlete training and more engaging real-time analytics for fan engagement. Simultaneously, the industry grapples with the persistent challenges of fragmented sports media rights, which complicates content acquisition and leads to strategies for managing user subscription fatigue.
  • Cybersecurity risks in sports data applications are also a primary concern, necessitating robust solutions to maintain user trust, especially as data privacy regulations in health apps become more stringent. Monetization strategies for fitness applications are diversifying beyond simple subscriptions to include gamified community fitness platforms and specialized software for youth sports team management.
  • For example, platforms that successfully implement social features in fitness apps see retention rates that are nearly double those that do not. The ability to offer low-bandwidth video streaming technology and effective performance tracking using GPS and sensor data is crucial for capturing market share, particularly in emerging economies.
  • The future lies in improving user engagement in sports apps through a blend of premium content, social connectivity, and innovative features like integrated betting.

What are the key market drivers leading to the rise in the adoption of Sports App Industry?

  • The proliferation of low-cost smartphones is a key driver, significantly expanding the market's addressable user base, particularly in developing economies.

  • The global expansion of the sports app market is fueled by low-cost smartphone proliferation and accelerating 5G network expansion, which together are driving mobile internet subscriber growth. This creates a vast addressable audience for high-definition streaming and localized sports content.
  • The adoption of digital payment integration facilitates monetization through in-app micro-transactions and ad-supported content models, lowering the barrier to entry for users. This ecosystem supports real-time video streaming for live events and high-intensity interval training sessions.
  • Developers are leveraging social workout tracking and advanced video compression to enhance user experience, while GPS activity recording enables features like muscle-building workout plans. This accessibility has led to a 60% increase in user acquisition in certain emerging markets.

What are the market trends shaping the Sports App Industry?

  • The integration of augmented reality visuals is emerging as a significant market trend. This provides users with an immersive and interactive viewing experience.

  • The integration of augmented reality visuals is reshaping the user experience, with interactive tactical overlays and real-time velocity metrics enhancing viewer understanding. This hyper-interactive consumption model relies on high-fidelity spatial data processed by advanced computer vision algorithms. To manage the computational load, developers are increasingly utilizing cloud-based rendering and edge computing for sports, which reduces latency for live events.
  • The use of content delivery network usage ensures that high-quality streams with features like player heat map overlays and multi-view streaming features are accessible globally. This approach improves fan engagement metrics by over 25%, as live statistics integration and topographical map integration create a more data-rich environment.
  • Innovations in low-bandwidth streaming optimization are making these features more accessible on a wider range of devices.

What challenges does the Sports App Industry face during its growth?

  • The fragmentation of sports broadcasting rights presents a key challenge, complicating the user experience and impacting industry growth.

  • The industry's growth is constrained by the challenge of fragmented broadcasting rights, which complicates access to live streaming content and on-demand video media. This forces users to navigate multiple platforms for real-time score updates, leading to user subscription fatigue.
  • The complex cybersecurity threat landscape requires significant investment to protect user data within comprehensive statistical databases and on platforms like virtual cycling platforms. This environment creates opportunities for new models, including direct-to-consumer streaming models and blockchain-based ticketing, to simplify access.
  • However, intense competition means platforms must innovate with features like interactive betting overlays and enhanced gamification of user experience through team communication platforms, as users with multiple subscriptions show a 50% higher churn rate.

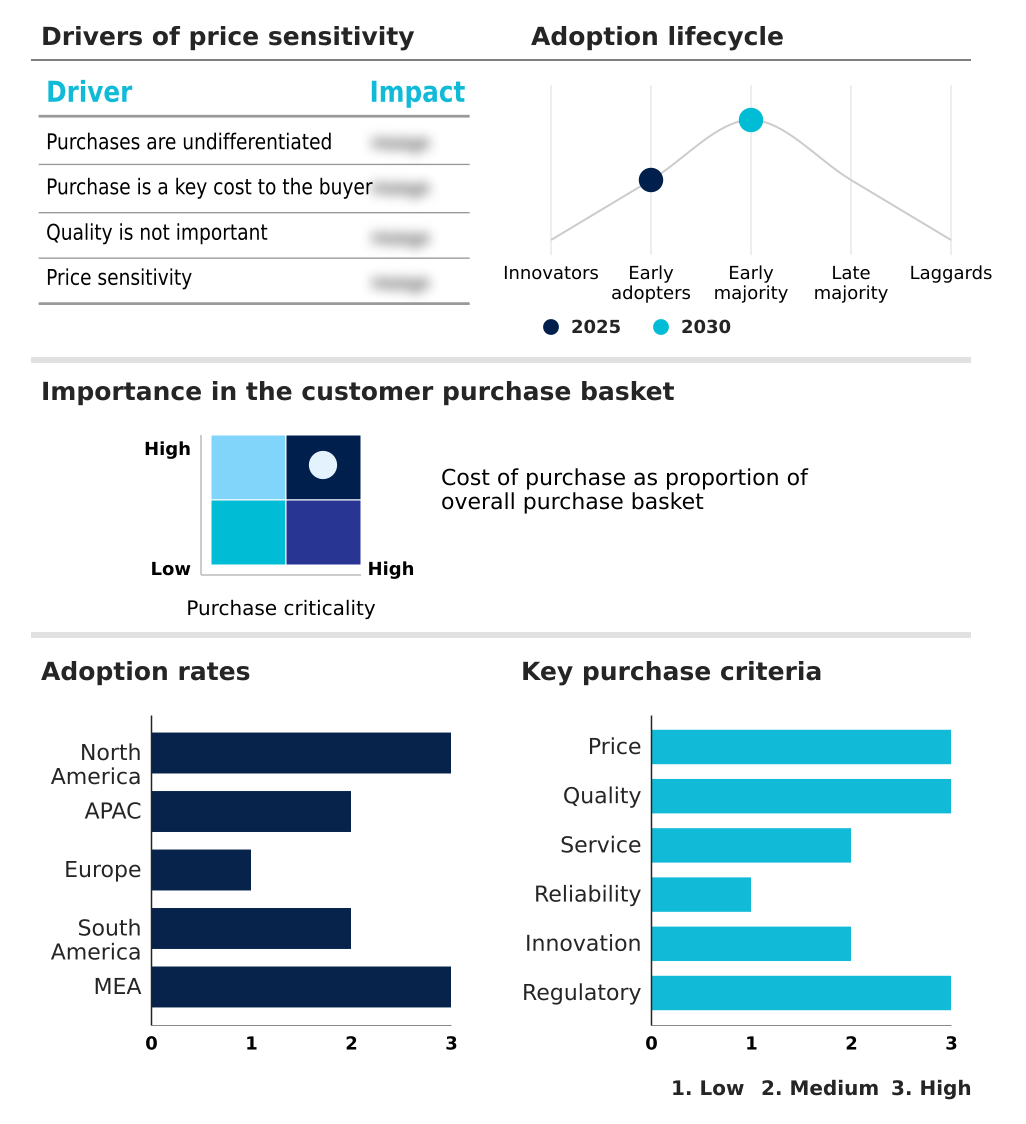
Exclusive Technavio Analysis on Customer Landscape

The sports app market forecasting report includes the adoption lifecycle of the market, covering from the innovator’s stage to the laggard’s stage. It focuses on adoption rates in different regions based on penetration. Furthermore, the sports app market report also includes key purchase criteria and drivers of price sensitivity to help companies evaluate and develop their market growth analysis strategies.

Customer Landscape of Sports App Industry

Competitive Landscape

Companies are implementing various strategies, such as strategic alliances, sports app market forecast, partnerships, mergers and acquisitions, geographical expansion, and product/service launches, to enhance their presence in the industry.

Apple Inc. - Offers a suite of applications for workout tracking, activity monitoring, and sports updates, fully integrated within a proprietary hardware and software ecosystem.

The industry research and growth report includes detailed analyses of the competitive landscape of the market and information about key companies, including:

  • Apple Inc.
  • DAZN Group Ltd
  • DICKS Sporting Goods Inc.
  • Fitbit LLC
  • FotMob
  • Fox Corp.
  • Freeletics GmbH
  • Garmin Ltd.
  • Heja Sports AB
  • Jefit Inc.
  • Jiostar India Pvt Ltd
  • LiveScore Group
  • NBCUniversal
  • Peloton Interactive Inc.
  • Sofa IT d.o.o.
  • Spond AS
  • SportEasy SAS
  • Strava Inc.
  • TrainHeroic Inc.
  • Zwift Inc.

Qualitative and quantitative analysis of companies has been conducted to help clients understand the wider business environment as well as the strengths and weaknesses of key industry players. Data is qualitatively analyzed to categorize companies as pure play, category-focused, industry-focused, and diversified; it is quantitatively analyzed to categorize companies as dominant, leading, strong, tentative, and weak.

Recent Development and News in Sports app market

  • In May 2025, Fox Corp. announced a strategic partnership aimed at enhancing its digital streaming capabilities for major league baseball, focusing on interactive features.
  • In March 2025, DAZN Group Ltd expanded its global rights portfolio by securing exclusive digital broadcasting agreements for several regional sports leagues, strengthening its content offering.
  • In February 2025, Fitbit LLC launched a specialized recovery dashboard that utilizes metabolic data to predict muscle fatigue, providing users with actionable recovery insights.
  • In January 2025, NBCUniversal updated its mobile platform to incorporate machine learning algorithms that deliver personalized game highlights based on user viewing history.

Dive into Technavio’s robust research methodology, blending expert interviews, extensive data synthesis, and validated models for unparalleled Sports App Market insights. See full methodology.

Market Scope
Page number 279
Base year 2025
Historic period 2020-2024
Forecast period 2026-2030
Growth momentum & CAGR Accelerate at a CAGR of 12.3%
Market growth 2026-2030 USD 3960.1 million
Market structure Fragmented
YoY growth 2025-2026(%) 11.4%
Key countries US, Canada, Mexico, China, India, Japan, Australia, South Korea, Thailand, UK, Germany, France, Italy, Spain, Sweden, Brazil, Argentina, Colombia, UAE, Saudi Arabia, South Africa, Egypt and Turkey
Competitive landscape Leading Companies, Market Positioning of Companies, Competitive Strategies, and Industry Risks

Request Free Sample

Research Analyst Overview

  • The market's evolution is marked by a definitive shift from basic physical activity tracking to sophisticated, data-centric fitness and training applications. This progression is enabled by widespread mobile sensor integration and enhanced wearable device compatibility. Modern platforms deliver a rich mix of live streaming content, on-demand video media, and real-time score updates through comprehensive statistical databases.
  • A key development is the use of personalized athlete analytics and AI-driven fitness coaching, often delivered through gamified fitness communities. Technologically, the adoption of augmented reality visuals, including player heat map overlays and real-time velocity metrics, demonstrates a move toward a hyper-interactive consumption model. This is supported by advancements in computer vision algorithms and cloud-based rendering.
  • The adoption of personalized analytics has already resulted in a 15% improvement in training efficiency for many amateur users. The proliferation of virtual cycling platforms and tools for high-intensity interval training, which rely on GPS activity recording, further diversifies the market's offerings.

What are the Key Data Covered in this Sports App Market Research and Growth Report?

  • What is the expected growth of the Sports App Market between 2026 and 2030?

    • USD 3.96 billion, at a CAGR of 12.3%

  • What segmentation does the market report cover?

    • The report is segmented by Application (Health monitoring, and Activity tracking and monitoring), Gender (Male, and Female), Platform (Google play store, and Apple iOS store) and Geography (North America, APAC, Europe, South America, Middle East and Africa)

  • Which regions are analyzed in the report?

    • North America, APAC, Europe, South America and Middle East and Africa

  • What are the key growth drivers and market challenges?

    • Proliferation of low cost smartphones, Fragmentation of sports broadcasting rights

  • Who are the major players in the Sports App Market?

    • Apple Inc., DAZN Group Ltd, DICKS Sporting Goods Inc., Fitbit LLC, FotMob, Fox Corp., Freeletics GmbH, Garmin Ltd., Heja Sports AB, Jefit Inc., Jiostar India Pvt Ltd, LiveScore Group, NBCUniversal, Peloton Interactive Inc., Sofa IT d.o.o., Spond AS, SportEasy SAS, Strava Inc., TrainHeroic Inc. and Zwift Inc.

Market Research Insights

  • The market is characterized by rapid technological evolution, where immersive fan engagement is becoming a key differentiator. The strategic use of wearable performance analytics and community-driven fitness challenges is boosting user retention by over 25% on some platforms. The integration of social mapping features and AI-driven sleep analysis tools is creating more holistic user experiences.
  • Direct-to-consumer streaming models are disrupting traditional broadcasting, while interactive betting overlays are opening new revenue streams, increasing in-app spending by 15% for early adopters. The focus is shifting toward creating comprehensive wearable technology ecosystems that support everything from strength and conditioning programs to AI-powered coaching algorithms, driving a more personalized and sticky user experience.

We can help! Our analysts can customize this sports app market research report to meet your requirements.

Get in touch

1. Executive Summary

1.1 Market overview

Executive Summary - Chart on Market Overview
Executive Summary - Data Table on Market Overview
Executive Summary - Chart on Global Market Characteristics
Executive Summary - Chart on Market by Geography
Executive Summary - Chart on Market Segmentation by Application
Executive Summary - Chart on Market Segmentation by Gender
Executive Summary - Chart on Market Segmentation by Platform
Executive Summary - Chart on Incremental Growth
Executive Summary - Data Table on Incremental Growth
Executive Summary - Chart on Company Market Positioning

2. Technavio Analysis

2.1 Analysis of price sensitivity, lifecycle, customer purchase basket, adoption rates, and purchase criteria

2.2 Criticality of inputs and Factors of differentiation

Chart on Overview on criticality of inputs and factors of differentiation

2.3 Factors of disruption

Chart on Overview on factors of disruption

2.4 Impact of drivers and challenges

Chart on Impact of drivers and challenges in 2025 and 2030

3. Market Landscape

3.1 Market ecosystem

Chart on Parent Market
Data Table on - Parent Market

3.2 Market characteristics

Chart on Market characteristics analysis

3.3 Value chain analysis

Chart on Value chain analysis

4. Market Sizing

4.1 Market definition

Data Table on Offerings of companies included in the market definition

4.2 Market segment analysis

Market segments

4.3 Market size 2025

4.4 Market outlook: Forecast for 2025-2030

Chart on Global - Market size and forecast 2025-2030 ($ million)
Data Table on Global - Market size and forecast 2025-2030 ($ million)
Chart on Global Market: Year-over-year growth 2025-2030 (%)
Data Table on Global Market: Year-over-year growth 2025-2030 (%)

5. Historic Market Size

5.1 Global Sports App Market 2020 - 2024

Historic Market Size - Data Table on Global Sports App Market 2020 - 2024 ($ million)

5.2 Application segment analysis 2020 - 2024

Historic Market Size - Application Segment 2020 - 2024 ($ million)

5.3 Gender segment analysis 2020 - 2024

Historic Market Size - Gender Segment 2020 - 2024 ($ million)

5.4 Platform segment analysis 2020 - 2024

Historic Market Size - Platform Segment 2020 - 2024 ($ million)

5.5 Geography segment analysis 2020 - 2024

Historic Market Size - Geography Segment 2020 - 2024 ($ million)

5.6 Country segment analysis 2020 - 2024

Historic Market Size - Country Segment 2020 - 2024 ($ million)

6. Qualitative Analysis

6.1 Impact of geopolitical conflicts on global sports app market

6.2 Impact of AI on global sports app market

7. Five Forces Analysis

7.1 Five forces summary

Five forces analysis - Comparison between 2025 and 2030

7.2 Bargaining power of buyers

Bargaining power of buyers - Impact of key factors 2025 and 2030

7.3 Bargaining power of suppliers

Bargaining power of suppliers - Impact of key factors in 2025 and 2030

7.4 Threat of new entrants

Threat of new entrants - Impact of key factors in 2025 and 2030

7.5 Threat of substitutes

Threat of substitutes - Impact of key factors in 2025 and 2030

7.6 Threat of rivalry

Threat of rivalry - Impact of key factors in 2025 and 2030

7.7 Market condition

Chart on Market condition - Five forces 2025 and 2030

8. Market Segmentation by Application

8.1 Market segments

Chart on Application - Market share 2025-2030 (%)
Data Table on Application - Market share 2025-2030 (%)

8.2 Comparison by Application

Chart on Comparison by Application
Data Table on Comparison by Application

8.3 Health monitoring - Market size and forecast 2025-2030

Chart on Health monitoring - Market size and forecast 2025-2030 ($ million)
Data Table on Health monitoring - Market size and forecast 2025-2030 ($ million)
Chart on Health monitoring - Year-over-year growth 2025-2030 (%)
Data Table on Health monitoring - Year-over-year growth 2025-2030 (%)

8.4 Activity tracking and monitoring - Market size and forecast 2025-2030

Chart on Activity tracking and monitoring - Market size and forecast 2025-2030 ($ million)
Data Table on Activity tracking and monitoring - Market size and forecast 2025-2030 ($ million)
Chart on Activity tracking and monitoring - Year-over-year growth 2025-2030 (%)
Data Table on Activity tracking and monitoring - Year-over-year growth 2025-2030 (%)

8.5 Market opportunity by Application

Market opportunity by Application ($ million)
Data Table on Market opportunity by Application ($ million)

9. Market Segmentation by Gender

9.1 Market segments

Chart on Gender - Market share 2025-2030 (%)
Data Table on Gender - Market share 2025-2030 (%)

9.2 Comparison by Gender

Chart on Comparison by Gender
Data Table on Comparison by Gender

9.3 Male - Market size and forecast 2025-2030

Chart on Male - Market size and forecast 2025-2030 ($ million)
Data Table on Male - Market size and forecast 2025-2030 ($ million)
Chart on Male - Year-over-year growth 2025-2030 (%)
Data Table on Male - Year-over-year growth 2025-2030 (%)

9.4 Female - Market size and forecast 2025-2030

Chart on Female - Market size and forecast 2025-2030 ($ million)
Data Table on Female - Market size and forecast 2025-2030 ($ million)
Chart on Female - Year-over-year growth 2025-2030 (%)
Data Table on Female - Year-over-year growth 2025-2030 (%)

9.5 Market opportunity by Gender

Market opportunity by Gender ($ million)
Data Table on Market opportunity by Gender ($ million)

10. Market Segmentation by Platform

10.1 Market segments

Chart on Platform - Market share 2025-2030 (%)
Data Table on Platform - Market share 2025-2030 (%)

10.2 Comparison by Platform

Chart on Comparison by Platform
Data Table on Comparison by Platform

10.3 Google play store - Market size and forecast 2025-2030

Chart on Google play store - Market size and forecast 2025-2030 ($ million)
Data Table on Google play store - Market size and forecast 2025-2030 ($ million)
Chart on Google play store - Year-over-year growth 2025-2030 (%)
Data Table on Google play store - Year-over-year growth 2025-2030 (%)

10.4 Apple iOS store - Market size and forecast 2025-2030

Chart on Apple iOS store - Market size and forecast 2025-2030 ($ million)
Data Table on Apple iOS store - Market size and forecast 2025-2030 ($ million)
Chart on Apple iOS store - Year-over-year growth 2025-2030 (%)
Data Table on Apple iOS store - Year-over-year growth 2025-2030 (%)

10.5 Market opportunity by Platform

Market opportunity by Platform ($ million)
Data Table on Market opportunity by Platform ($ million)

11. Customer Landscape

11.1 Customer landscape overview

Analysis of price sensitivity, lifecycle, customer purchase basket, adoption rates, and purchase criteria

12. Geographic Landscape

12.1 Geographic segmentation

Chart on Market share by geography 2025-2030 (%)
Data Table on Market share by geography 2025-2030 (%)

12.2 Geographic comparison

Chart on Geographic comparison
Data Table on Geographic comparison

12.3 North America - Market size and forecast 2025-2030

Chart on North America - Market size and forecast 2025-2030 ($ million)
Data Table on North America - Market size and forecast 2025-2030 ($ million)
Chart on North America - Year-over-year growth 2025-2030 (%)
Data Table on North America - Year-over-year growth 2025-2030 (%)
Chart on Regional Comparison - North America
Data Table on Regional Comparison - North America

12.3.1 US - Market size and forecast 2025-2030

Chart on US - Market size and forecast 2025-2030 ($ million)
Data Table on US - Market size and forecast 2025-2030 ($ million)
Chart on US - Year-over-year growth 2025-2030 (%)
Data Table on US - Year-over-year growth 2025-2030 (%)

12.3.2 Canada - Market size and forecast 2025-2030

Chart on Canada - Market size and forecast 2025-2030 ($ million)
Data Table on Canada - Market size and forecast 2025-2030 ($ million)
Chart on Canada - Year-over-year growth 2025-2030 (%)
Data Table on Canada - Year-over-year growth 2025-2030 (%)

12.3.3 Mexico - Market size and forecast 2025-2030

Chart on Mexico - Market size and forecast 2025-2030 ($ million)
Data Table on Mexico - Market size and forecast 2025-2030 ($ million)
Chart on Mexico - Year-over-year growth 2025-2030 (%)
Data Table on Mexico - Year-over-year growth 2025-2030 (%)

12.4 APAC - Market size and forecast 2025-2030

Chart on APAC - Market size and forecast 2025-2030 ($ million)
Data Table on APAC - Market size and forecast 2025-2030 ($ million)
Chart on APAC - Year-over-year growth 2025-2030 (%)
Data Table on APAC - Year-over-year growth 2025-2030 (%)
Chart on Regional Comparison - APAC
Data Table on Regional Comparison - APAC

12.4.1 China - Market size and forecast 2025-2030

Chart on China - Market size and forecast 2025-2030 ($ million)
Data Table on China - Market size and forecast 2025-2030 ($ million)
Chart on China - Year-over-year growth 2025-2030 (%)
Data Table on China - Year-over-year growth 2025-2030 (%)

12.4.2 India - Market size and forecast 2025-2030

Chart on India - Market size and forecast 2025-2030 ($ million)
Data Table on India - Market size and forecast 2025-2030 ($ million)
Chart on India - Year-over-year growth 2025-2030 (%)
Data Table on India - Year-over-year growth 2025-2030 (%)

12.4.3 Japan - Market size and forecast 2025-2030

Chart on Japan - Market size and forecast 2025-2030 ($ million)
Data Table on Japan - Market size and forecast 2025-2030 ($ million)
Chart on Japan - Year-over-year growth 2025-2030 (%)
Data Table on Japan - Year-over-year growth 2025-2030 (%)

12.4.4 Australia - Market size and forecast 2025-2030

Chart on Australia - Market size and forecast 2025-2030 ($ million)
Data Table on Australia - Market size and forecast 2025-2030 ($ million)
Chart on Australia - Year-over-year growth 2025-2030 (%)
Data Table on Australia - Year-over-year growth 2025-2030 (%)

12.4.5 South Korea - Market size and forecast 2025-2030

Chart on South Korea - Market size and forecast 2025-2030 ($ million)
Data Table on South Korea - Market size and forecast 2025-2030 ($ million)
Chart on South Korea - Year-over-year growth 2025-2030 (%)
Data Table on South Korea - Year-over-year growth 2025-2030 (%)

12.4.6 Thailand - Market size and forecast 2025-2030

Chart on Thailand - Market size and forecast 2025-2030 ($ million)
Data Table on Thailand - Market size and forecast 2025-2030 ($ million)
Chart on Thailand - Year-over-year growth 2025-2030 (%)
Data Table on Thailand - Year-over-year growth 2025-2030 (%)

12.5 Europe - Market size and forecast 2025-2030

Chart on Europe - Market size and forecast 2025-2030 ($ million)
Data Table on Europe - Market size and forecast 2025-2030 ($ million)
Chart on Europe - Year-over-year growth 2025-2030 (%)
Data Table on Europe - Year-over-year growth 2025-2030 (%)
Chart on Regional Comparison - Europe
Data Table on Regional Comparison - Europe

12.5.1 UK - Market size and forecast 2025-2030

Chart on UK - Market size and forecast 2025-2030 ($ million)
Data Table on UK - Market size and forecast 2025-2030 ($ million)
Chart on UK - Year-over-year growth 2025-2030 (%)
Data Table on UK - Year-over-year growth 2025-2030 (%)

12.5.2 Germany - Market size and forecast 2025-2030

Chart on Germany - Market size and forecast 2025-2030 ($ million)
Data Table on Germany - Market size and forecast 2025-2030 ($ million)
Chart on Germany - Year-over-year growth 2025-2030 (%)
Data Table on Germany - Year-over-year growth 2025-2030 (%)

12.5.3 France - Market size and forecast 2025-2030

Chart on France - Market size and forecast 2025-2030 ($ million)
Data Table on France - Market size and forecast 2025-2030 ($ million)
Chart on France - Year-over-year growth 2025-2030 (%)
Data Table on France - Year-over-year growth 2025-2030 (%)

12.5.4 Italy - Market size and forecast 2025-2030

Chart on Italy - Market size and forecast 2025-2030 ($ million)
Data Table on Italy - Market size and forecast 2025-2030 ($ million)
Chart on Italy - Year-over-year growth 2025-2030 (%)
Data Table on Italy - Year-over-year growth 2025-2030 (%)

12.5.5 Spain - Market size and forecast 2025-2030

Chart on Spain - Market size and forecast 2025-2030 ($ million)
Data Table on Spain - Market size and forecast 2025-2030 ($ million)
Chart on Spain - Year-over-year growth 2025-2030 (%)
Data Table on Spain - Year-over-year growth 2025-2030 (%)

12.5.6 Sweden - Market size and forecast 2025-2030

Chart on Sweden - Market size and forecast 2025-2030 ($ million)
Data Table on Sweden - Market size and forecast 2025-2030 ($ million)
Chart on Sweden - Year-over-year growth 2025-2030 (%)
Data Table on Sweden - Year-over-year growth 2025-2030 (%)

12.6 South America - Market size and forecast 2025-2030

Chart on South America - Market size and forecast 2025-2030 ($ million)
Data Table on South America - Market size and forecast 2025-2030 ($ million)
Chart on South America - Year-over-year growth 2025-2030 (%)
Data Table on South America - Year-over-year growth 2025-2030 (%)
Chart on Regional Comparison - South America
Data Table on Regional Comparison - South America

12.6.1 Brazil - Market size and forecast 2025-2030

Chart on Brazil - Market size and forecast 2025-2030 ($ million)
Data Table on Brazil - Market size and forecast 2025-2030 ($ million)
Chart on Brazil - Year-over-year growth 2025-2030 (%)
Data Table on Brazil - Year-over-year growth 2025-2030 (%)

12.6.2 Argentina - Market size and forecast 2025-2030

Chart on Argentina - Market size and forecast 2025-2030 ($ million)
Data Table on Argentina - Market size and forecast 2025-2030 ($ million)
Chart on Argentina - Year-over-year growth 2025-2030 (%)
Data Table on Argentina - Year-over-year growth 2025-2030 (%)

12.6.3 Colombia - Market size and forecast 2025-2030

Chart on Colombia - Market size and forecast 2025-2030 ($ million)
Data Table on Colombia - Market size and forecast 2025-2030 ($ million)
Chart on Colombia - Year-over-year growth 2025-2030 (%)
Data Table on Colombia - Year-over-year growth 2025-2030 (%)

12.7 Middle East and Africa - Market size and forecast 2025-2030

Chart on Middle East and Africa - Market size and forecast 2025-2030 ($ million)
Data Table on Middle East and Africa - Market size and forecast 2025-2030 ($ million)
Chart on Middle East and Africa - Year-over-year growth 2025-2030 (%)
Data Table on Middle East and Africa - Year-over-year growth 2025-2030 (%)
Chart on Regional Comparison - Middle East and Africa
Data Table on Regional Comparison - Middle East and Africa

12.7.1 UAE - Market size and forecast 2025-2030

Chart on UAE - Market size and forecast 2025-2030 ($ million)
Data Table on UAE - Market size and forecast 2025-2030 ($ million)
Chart on UAE - Year-over-year growth 2025-2030 (%)
Data Table on UAE - Year-over-year growth 2025-2030 (%)

12.7.2 Saudi Arabia - Market size and forecast 2025-2030

Chart on Saudi Arabia - Market size and forecast 2025-2030 ($ million)
Data Table on Saudi Arabia - Market size and forecast 2025-2030 ($ million)
Chart on Saudi Arabia - Year-over-year growth 2025-2030 (%)
Data Table on Saudi Arabia - Year-over-year growth 2025-2030 (%)

12.7.3 South Africa - Market size and forecast 2025-2030

Chart on South Africa - Market size and forecast 2025-2030 ($ million)
Data Table on South Africa - Market size and forecast 2025-2030 ($ million)
Chart on South Africa - Year-over-year growth 2025-2030 (%)
Data Table on South Africa - Year-over-year growth 2025-2030 (%)

12.7.4 Egypt - Market size and forecast 2025-2030

Chart on Egypt - Market size and forecast 2025-2030 ($ million)
Data Table on Egypt - Market size and forecast 2025-2030 ($ million)
Chart on Egypt - Year-over-year growth 2025-2030 (%)
Data Table on Egypt - Year-over-year growth 2025-2030 (%)

12.7.5 Turkey - Market size and forecast 2025-2030

Chart on Turkey - Market size and forecast 2025-2030 ($ million)
Data Table on Turkey - Market size and forecast 2025-2030 ($ million)
Chart on Turkey - Year-over-year growth 2025-2030 (%)
Data Table on Turkey - Year-over-year growth 2025-2030 (%)

12.8 Market opportunity by geography

Market opportunity by geography ($ million)
Data Tables on Market opportunity by geography ($ million)

13. Drivers, Challenges, and Opportunity

13.1 Market drivers

Proliferation of low cost smartphones
Growing demand for live streaming
Increasing focus on preventative health

13.2 Market challenges

Fragmentation of sports broadcasting rights
Significant cyber security threat landscape
High subscription fatigue among users

13.3 Impact of drivers and challenges

Impact of drivers and challenges in 2025 and 2030

13.4 Market opportunities

Integration of augmented reality visuals
Personalized athlete performance analytics systems
Gamified fitness community engagement platforms

14. Competitive Landscape

14.1 Overview

14.2

Overview on criticality of inputs and factors of differentiation

14.3 Landscape disruption

Overview on factors of disruption

14.4 Industry risks

Impact of key risks on business

15. Competitive Analysis

15.1 Companies profiled

Companies covered

15.2 Company ranking index

15.3 Market positioning of companies

Matrix on companies position and classification

15.4 Apple Inc.

Apple Inc. - Overview
Apple Inc. - Business segments
Apple Inc. - Key news
Apple Inc. - Key offerings
Apple Inc. - Segment focus
SWOT

15.5 DAZN Group Ltd

DAZN Group Ltd - Overview
DAZN Group Ltd - Product / Service
DAZN Group Ltd - Key offerings
SWOT

15.6 DICKS Sporting Goods Inc.

DICKS Sporting Goods Inc. - Overview
DICKS Sporting Goods Inc. - Product / Service
DICKS Sporting Goods Inc. - Key offerings
SWOT

15.7 Fitbit LLC

Fitbit LLC - Overview
Fitbit LLC - Product / Service
Fitbit LLC - Key offerings
SWOT

15.8 Fox Corp.

Fox Corp. - Overview
Fox Corp. - Business segments
Fox Corp. - Key offerings
Fox Corp. - Segment focus
SWOT

15.9 Garmin Ltd.

Garmin Ltd. - Overview
Garmin Ltd. - Business segments
Garmin Ltd. - Key news
Garmin Ltd. - Key offerings
Garmin Ltd. - Segment focus
SWOT

15.10 Heja Sports AB

Heja Sports AB - Overview
Heja Sports AB - Product / Service
Heja Sports AB - Key offerings
SWOT

15.11 Jiostar India Pvt Ltd

Jiostar India Pvt Ltd - Overview
Jiostar India Pvt Ltd - Product / Service
Jiostar India Pvt Ltd - Key offerings
SWOT

15.12 LiveScore Group

LiveScore Group - Overview
LiveScore Group - Product / Service
LiveScore Group - Key offerings
SWOT

15.13 NBCUniversal

NBCUniversal - Overview
NBCUniversal - Product / Service
NBCUniversal - Key offerings
SWOT

15.14 Peloton Interactive Inc.

Peloton Interactive Inc. - Overview
Peloton Interactive Inc. - Business segments
Peloton Interactive Inc. - Key offerings
Peloton Interactive Inc. - Segment focus
SWOT

15.15 Sofa IT d.o.o.

Sofa IT d.o.o. - Overview
Sofa IT d.o.o. - Product / Service
Sofa IT d.o.o. - Key offerings
SWOT

15.16 SportEasy SAS

SportEasy SAS - Overview
SportEasy SAS - Product / Service
SportEasy SAS - Key offerings
SWOT

15.17 TrainHeroic Inc.

TrainHeroic Inc. - Overview
TrainHeroic Inc. - Product / Service
TrainHeroic Inc. - Key offerings
SWOT

15.18 Zwift Inc.

Zwift Inc. - Overview
Zwift Inc. - Product / Service
Zwift Inc. - Key offerings
SWOT

16. Appendix

16.1 Scope of the report

Market definition
Objectives
Notes and caveats

16.2 Inclusions and exclusions checklist

Inclusions checklist
Exclusions checklist

16.3 Currency conversion rates for US$

16.4 Research methodology

16.5 Data procurement

Information sources

16.6 Data validation

16.7 Validation techniques employed for market sizing

16.8 Data synthesis

16.9 360 degree market analysis

16.10 List of abbreviations

Research Methodology

Technavio presents a detailed picture of the market by way of study, synthesis, and summation of data from multiple sources. The analysts have presented the various facets of the market with a particular focus on identifying the key industry influencers. The data thus presented is comprehensive, reliable, and the result of extensive research, both primary and secondary.

INFORMATION SOURCES

Primary sources

  • Manufacturers and suppliers
  • Channel partners
  • Industry experts
  • Strategic decision makers

Secondary sources

  • Industry journals and periodicals
  • Government data
  • Financial reports of key industry players
  • Historical data
  • Press releases

DATA ANALYSIS

Data Synthesis

  • Collation of data
  • Estimation of key figures
  • Analysis of derived insights

Data Validation

  • Triangulation with data models
  • Reference against proprietary databases
  • Corroboration with industry experts

REPORT WRITING

Qualitative

  • Market drivers
  • Market challenges
  • Market trends
  • Five forces analysis

Quantitative

  • Market size and forecast
  • Market segmentation
  • Geographical insights
  • Competitive landscape

Interested in this report?

Get your sample now to see our research methodology and insights!

Download Now

Frequently Asked Questions

Sports App market growth will increase by USD 3960.1 million during 2026-2030.

The Sports App market is expected to grow at a CAGR of 12.3% during 2026-2030.

Sports App market is segmented by Application (Health monitoring, Activity tracking and monitoring) Gender (Male, Female) Platform (Google play store, Apple iOS store)

Apple Inc., DAZN Group Ltd, DICKS Sporting Goods Inc., Fitbit LLC, FotMob, Fox Corp., Freeletics GmbH, Garmin Ltd., Heja Sports AB, Jefit Inc., Jiostar India Pvt Ltd, LiveScore Group, NBCUniversal, Peloton Interactive Inc., Sofa IT d.o.o., Spond AS, SportEasy SAS, Strava Inc., TrainHeroic Inc., Zwift Inc. are a few of the key vendors in the Sports App market.

APAC will register the highest growth rate of 30.9% among the other regions. Therefore, the Sports App market in APAC is expected to garner significant business opportunities for the vendors during the forecast period.

US, Canada, Mexico, China, India, Japan, Australia, South Korea, Thailand, UK, Germany, France, Italy, Spain, Sweden, Brazil, Argentina, Colombia, UAE, Saudi Arabia, South Africa, Egypt, Turkey

  • Proliferation of low cost smartphones is the driving factor this market.

The Sports App market vendors should focus on grabbing business opportunities from the Application segment as it accounted for the largest market share in the base year.
RIA - Research AI Assistant
Ask RIA