
Small Molecule API Market Analysis, Size, and Forecast 2026-2030: North America (US, Canada, and Mexico), Asia (China, Japan, and South Korea), Europe (Germany, UK, and France), South America (Brazil, Argentina, and Chile), Middle East and Africa (Saudi Arabia, South Africa, and UAE), Rest of World (ROW)

Small Molecule API Market Analysis, Size, and Forecast 2026-2030:
North America (US, Canada, and Mexico), Asia (China, Japan, and South Korea), Europe (Germany, UK, and France), South America (Brazil, Argentina, and Chile), Middle East and Africa (Saudi Arabia, South Africa, and UAE), Rest of World (ROW)

Published: Oct 2026 294 Pages SKU: IRTNTR71969

Market Overview at a Glance

$74.87 B
Market Opportunity
7.3%
CAGR 2025 - 2030
44.1%
North America Growth
$92.90 B
Captive APIs segment 2024

Small Molecule Api Market Size 2026-2030

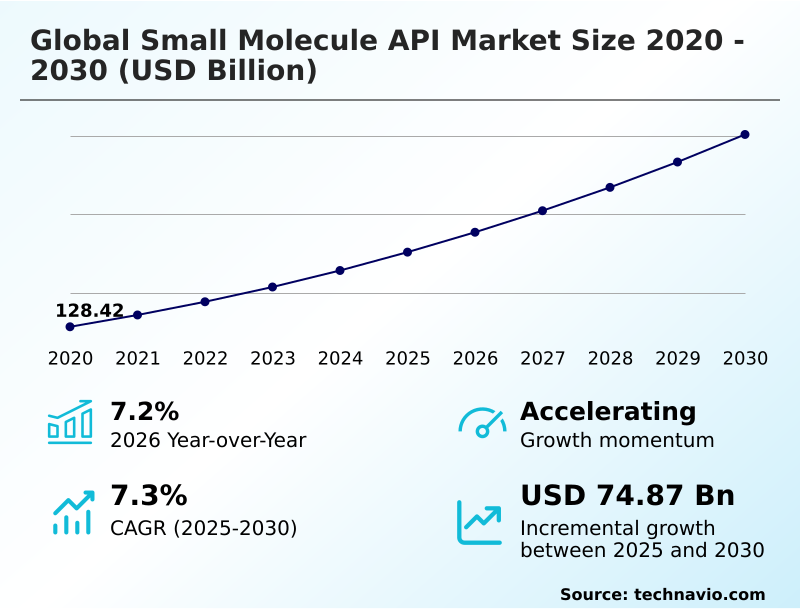
The small molecule api market size is valued to increase by USD 74.87 billion, at a CAGR of 7.3% from 2025 to 2030. Rising prevalence of chronic diseases steadily boosts global small molecule demand will drive the small molecule api market.

Major Market Trends & Insights

  • North America dominated the market and accounted for a 44.1% growth during the forecast period.
  • By Deployment - Captive APIs segment was valued at USD 92.90 billion in 2024
  • By Type - Synthetic segment accounted for the largest market revenue share in 2024

Market Size & Forecast

  • Market Opportunities: USD 122.37 billion
  • Market Future Opportunities: USD 74.87 billion
  • CAGR from 2025 to 2030 : 7.3%

Market Summary

  • The Small Molecule API Market exhibits robust expansion driven by the increasing necessity for specialized chemical synthesis across oncology and chronic disease therapeutics. Manufacturers are actively prioritizing process efficiency and regulatory compliance to meet surging clinical demands. As an operational baseline, pharmaceutical developers are shifting from traditional batch processing to advanced continuous manufacturing systems.
  • This transition creates measurable business impact, allowing facilities to increase production throughput by 25% while simultaneously reducing solvent waste. The primary driver propelling this sector is the escalating prevalence of chronic conditions, which demands high-volume, reliable active pharmaceutical ingredient supplies for long-term patient maintenance.
  • Conversely, stringent environmental protection regulations challenge profitability, forcing companies to invest heavily in pollution control infrastructure and green chemistry upgrades. To navigate these constraints, organizations are optimizing supply chains by localizing procurement and forging specialized contract manufacturing partnerships. Consequently, the industry continues to advance structurally, securing consistent chemical raw material availability for sophisticated drug pipelines.

What will be the Size of the Small Molecule Api Market during the forecast period?
Get Key Insights on Market Forecast (PDF) Get Free Sample

How is the Small Molecule Api Market Segmented?

The small molecule api industry research report provides comprehensive data (region-wise segment analysis), with forecasts and estimates in "USD million" for the period 2026-2030, as well as historical data from 2020-2024 for the following segments.

  • Deployment
    • Captive APIs
    • Contract APIs
  • Type
    • Synthetic
    • Biotech
  • Indication
    • Oncology
    • Cardiovascular diseases
    • Diabetes
    • Others
  • Geography
    • North America
      • US
      • Canada
      • Mexico
    • Asia
      • China
      • Japan
      • South Korea
      • India
      • Taiwan
      • Singapore
    • Europe
      • Germany
      • UK
      • France
      • Italy
      • Spain
      • The Netherlands
    • Rest of World (ROW)

By Deployment Insights

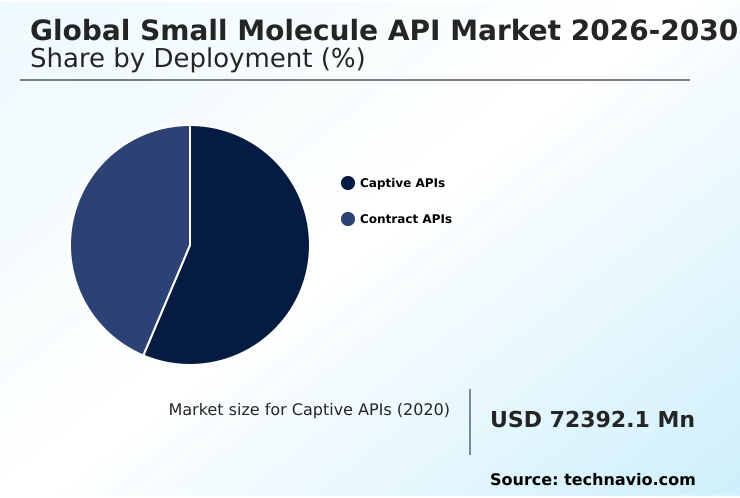
The captive apis segment is estimated to witness significant growth during the forecast period.

The captive APIs segment within the Global Small Molecule API Market 2026-2030 retains a dominant operational position driven by the strategic imperative to maintain direct oversight over proprietary high-potency active ingredient manufacturing and quality assurance.

Pharmaceutical innovators increasingly rely on internal manufacturing to protect highly specialized intellectual property, such as complex structural motifs and antibody-drug conjugate payloads.

By operating captive facilities, drug developers achieve a 15% reduction in cross-contamination risks while securing high-yield outputs for proteolysis targeting chimeras and other advanced therapeutics.

This internal production model empowers organizations to optimize therapeutic selectivity through precise chiral separations and advanced synthetic structural optimization. Furthermore, executing chiral synthesis and microbial fermentation in-house allows manufacturers to seamlessly integrate green chemistry catalysts within automated batch reactors.

Ultimately, retaining production internally ensures strict biochemical pathway disruption control and pharmaceutical quality compliance, expediting the transition from clinical testing to commercial distribution.
Get Free Sample

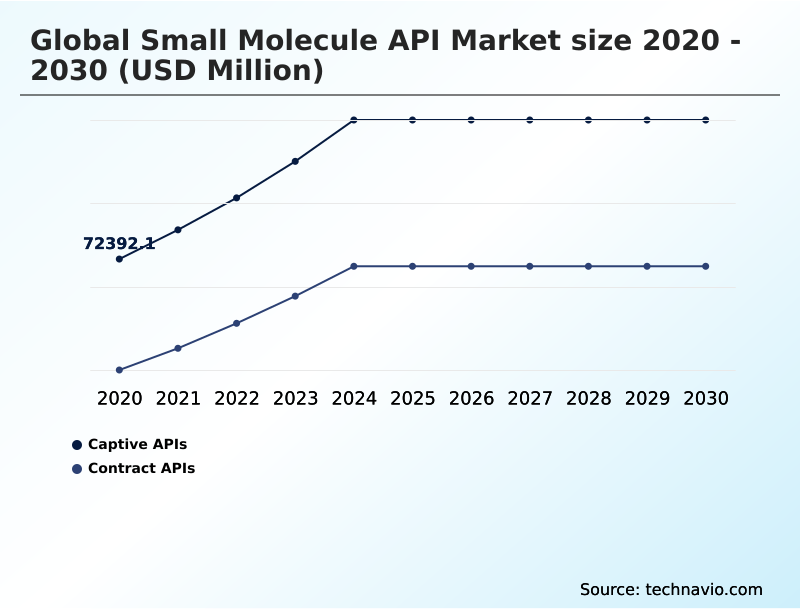
The Captive APIs segment was valued at USD 92.90 billion in 2024 and showed a gradual increase during the forecast period.
Get Free Sample

Regional Analysis

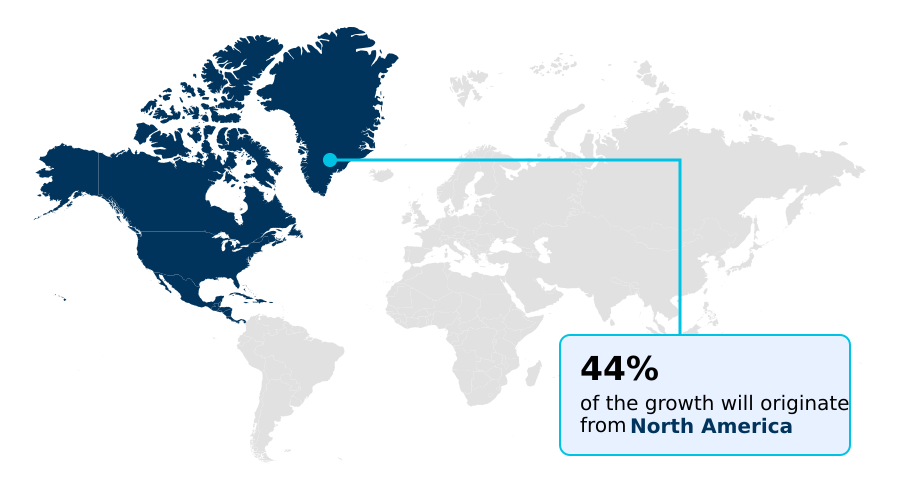
North America is estimated to contribute 44.1% to the growth of the global market during the forecast period.Technavio’s analysts have elaborately explained the regional trends and drivers that shape the market during the forecast period.
See How Small Molecule Api Market Demand is Rising in North America Get Free Sample

The geographic distribution of the Global Small Molecule API Market 2026-2030 highlights significant operational disparities between regions. North America commands a dominant market share, driven by aggressive investments in automated reaction monitoring and sophisticated active pharmaceutical ingredient synthesis capabilities.

Facilities in this region utilizing digital twin simulations have improved production yield predictability by 18% compared to traditional pilot programs.

Meanwhile, the Asia region demonstrates a rapid expansion trajectory, focusing heavily on scaling oral solid dosages and bioequivalent formulations for global export. Asian manufacturers implementing advanced catalytic methods and microreactor channels have achieved a 22% reduction in overall processing costs.

European operations distinctly prioritize synthetic route planning and the integration of generative artificial intelligence to minimize waste. Across all territories, establishing robust green chemistry catalysts frameworks remains critical for navigating strict regulatory oversight and ensuring seamless commercial distribution.

Market Dynamics

Our researchers analyzed the data with 2025 as the base year, along with the key drivers, trends, and challenges. A holistic analysis of drivers will help companies refine their marketing strategies to gain a competitive advantage.

  • The structural evolution of the Small Molecule API sector relies extensively on accelerating technological capabilities and sustainable manufacturing workflows. A major focus for industry leaders is achieving continuous flow reactor efficiency improvement, which allows for the seamless continuous extraction of product streams without the downtime associated with legacy holding tanks.
  • When comparing modern integrated facilities to traditional plants, the deployment of ai-driven synthetic route optimization yields a 35% higher rate of first-pass synthesis success, drastically reducing raw material waste. Furthermore, as pipelines shift toward targeted oncology, high-potency containment suite integration has become a mandatory infrastructural upgrade to protect personnel.
  • Organizations are simultaneously pioneering generative ai in small molecule design to identify viable clinical candidates faster. Once identified, scaling these candidates relies on predictive modeling for process development and multi-step organic synthesis scale-up. Operations have vastly improved quality control through automated process analytical technology integration and process analytical technology for impurity profiling, ensuring regulatory compliance.
  • The integration of machine learning for reaction anomalies prevents catastrophic batch failures in real-time. Additionally, sustainable practices are reshaping operations. Green chemistry solvent reduction methods and zero liquid discharge in chemical manufacturing ensure adherence to strict ecological mandates.
  • Companies are also leveraging microbial fermentation for small molecules alongside biocatalysis for chiral small molecules, which fundamentally streamlines chiral separation in small molecules and enhances the overall ecological profile of modern pharmaceutical production.
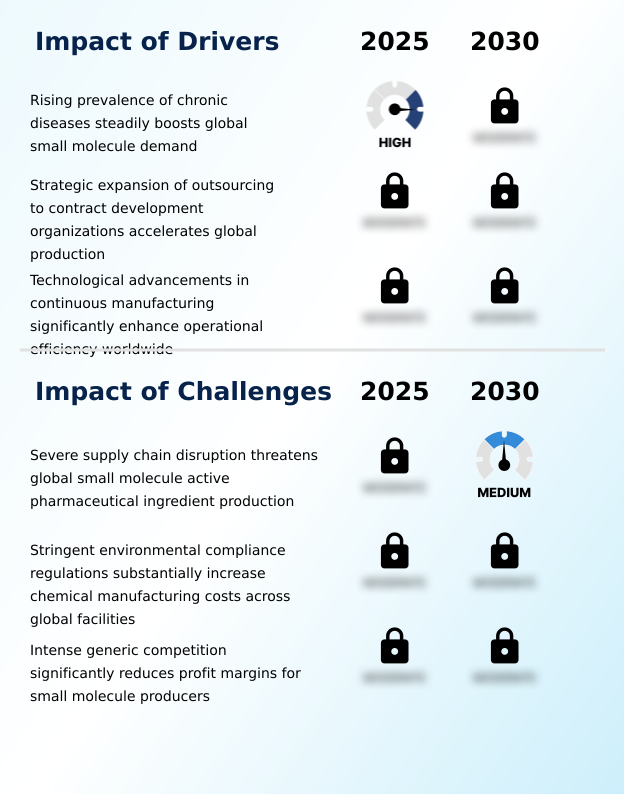
What are the key market drivers leading to the rise in the adoption of Small Molecule Api Industry?

  • The accelerating global prevalence of chronic diseases steadily boosts worldwide demand for advanced small molecule therapeutics and their fundamental chemical building blocks.

  • The accelerated demand for targeted oncology therapeutics and precision medicine approaches serves as a primary fundamental driver for the Global Small Molecule API Market 2026-2030.
  • Uncovering new targets through advanced biomarker discovery and high-throughput screening technologies forces manufacturers to optimize complex multi-step synthesis and extensive route scouting.
  • To fulfill these massive clinical requirements, producers are upgrading to energy-efficient reaction vessels, which have proven to lower facility power consumption by 15%.
  • This surging demand necessitates highly resilient production networks; consequently, firms are fortifying chemical feedstock availability and localizing advanced intermediate procurement.
  • Enhancing supply chain resilience and implementing robust quality assurance protocols has directly improved raw material delivery reliability by 22%, ensuring that active pharmaceutical ingredients transition smoothly through clinical batch scaling and into global commercial markets.

What are the market trends shaping the Small Molecule Api Industry?

  • The widespread adoption of advanced flow chemistry methods is revolutionizing small molecule synthesis processes across the global manufacturing landscape. This transition significantly enhances operational efficiency and safety in complex active pharmaceutical ingredient production.

  • The integration of continuous flow chemistry and machine-native chemistry platforms is a definitive operational trend transforming the Global Small Molecule API Market 2026-2030. Organizations are rapidly transitioning away from legacy infrastructure to adopt modular production suites and automated synthesis platforms.
  • By utilizing these continuous processing technologies, chemical manufacturers have successfully compressed process scale-up timelines by 25% while improving heat transfer efficiency. This shift is largely driven by the increasing complexity of modern therapeutics targeting complex intracellular pathways, which require precise pharmacokinetic properties and superior stability over traditional delivery methods.
  • Furthermore, the deployment of computational acceleration platforms and expansive combinatorial chemistry libraries allows developers to optimize molecular designs instantly. The resulting integration of real-time quality verification within these systems has reduced post-production analytical testing delays by 20%, ensuring faster commercial availability.

What challenges does the Small Molecule Api Industry face during its growth?

  • Severe supply chain disruptions and logistical bottlenecks persistently threaten the efficient production and procurement of critical small molecule active pharmaceutical ingredients.

  • Stringent environmental mandates and severe bottlenecks in cross-border logistics present formidable structural challenges within the Global Small Molecule API Market 2026-2030. Regulatory bodies increasingly compel facilities to implement zero liquid discharge systems and advanced continuous emissions monitoring, which dramatically inflates upfront capital expenditure.
  • While adopting these technologies aids in environmental toxicity reduction and supports biocatalytic transformations, it strains operational margins for mid-sized manufacturers. Furthermore, hyper-competitive bioequivalent formulation development requires flawless impurity profiling and rigorous stability testing utilizing sophisticated process analytical technology. Facilities overcoming these compliance hurdles have nonetheless reported a 14% increase in overall regulatory maintenance costs.
  • To bypass international shipping delays affecting crucial therapies for solid tumor malignancies, pharmaceutical developers are aggressively expanding domestic manufacturing capabilities, attempting to stabilize production output against persistent trade volatility.

Exclusive Technavio Analysis on Customer Landscape

The small molecule api market forecasting report includes the adoption lifecycle of the market, covering from the innovator’s stage to the laggard’s stage. It focuses on adoption rates in different regions based on penetration. Furthermore, the small molecule api market report also includes key purchase criteria and drivers of price sensitivity to help companies evaluate and develop their market growth analysis strategies.
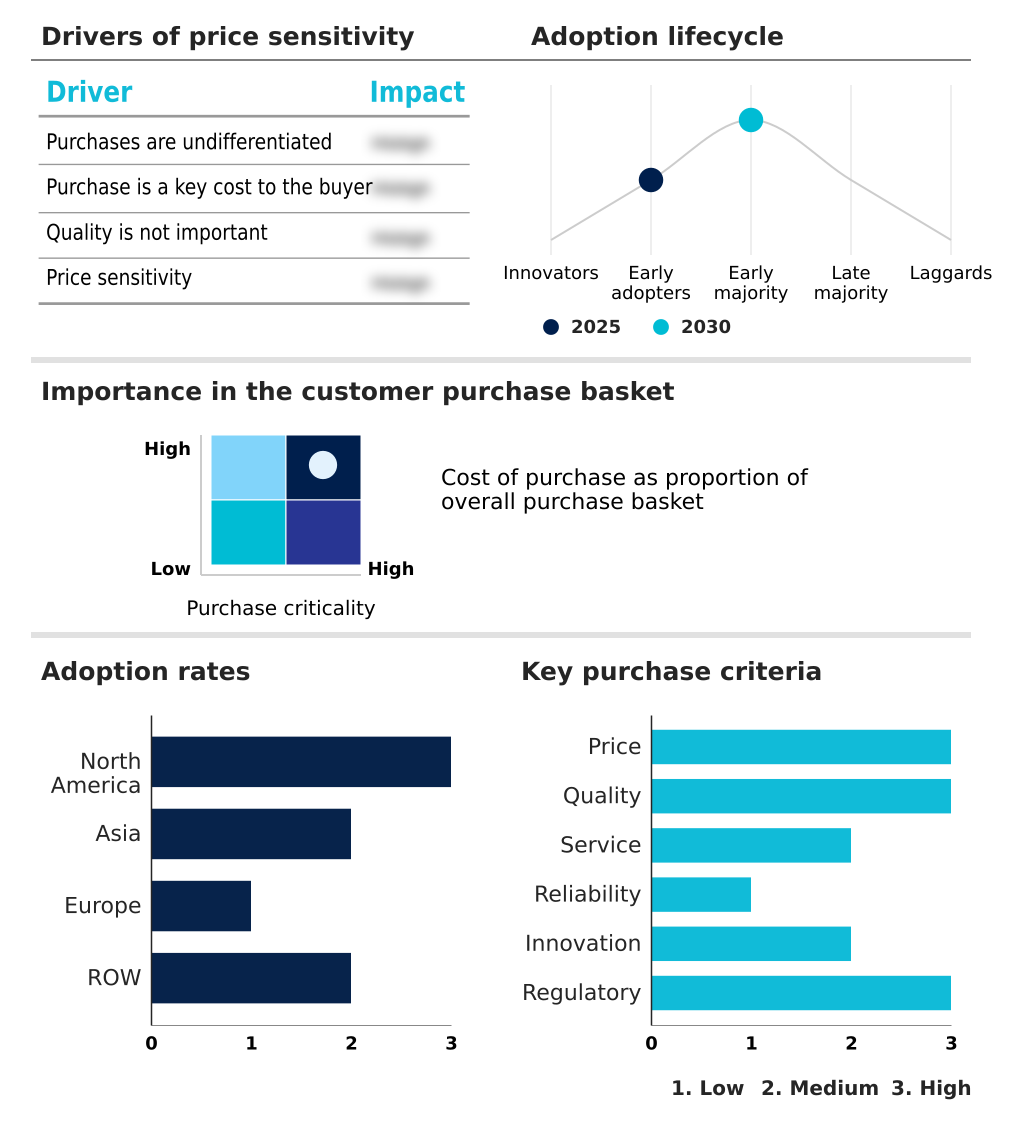
Customer Landscape of Small Molecule Api Industry

Competitive Landscape

Companies are implementing various strategies, such as strategic alliances, small molecule api market forecast, partnerships, mergers and acquisitions, geographical expansion, and product/service launches, to enhance their presence in the industry.

AbbVie Inc. - The company provides critical active pharmaceutical ingredients for oncology and immunology pipelines, supporting specialized solid tumor treatments and ensuring secure clinical supply chains for advanced therapeutic applications.

The industry research and growth report includes detailed analyses of the competitive landscape of the market and information about key companies, including:

  • AbbVie Inc.
  • Aragen Life Sciences Pvt. Ltd.
  • Asymchem Labs Tianjin Ltd.
  • Aurobindo Pharma Ltd.
  • Cambrex Corp.
  • Catalent Inc.
  • Cohance Lifesciences Ltd.
  • Curia Global Inc.
  • Divis Laboratories Ltd.
  • Dr. Reddys Laboratories Ltd.
  • Evonik Industries AG
  • Granules India Ltd.
  • Laurus Labs Ltd.
  • Lonza Group Ltd.
  • Neuland Laboratories
  • Pharmaron Beijing Co. Ltd.
  • Piramal Pharma Solutions
  • Siegfried Holding AG
  • Solara Active Pharma Sciences Ltd.
  • WuXi AppTec Co. Ltd.

Qualitative and quantitative analysis of companies has been conducted to help clients understand the wider business environment as well as the strengths and weaknesses of key industry players. Data is qualitatively analyzed to categorize companies as pure play, category-focused, industry-focused, and diversified; it is quantitatively analyzed to categorize companies as dominant, leading, strong, tentative, and weak.

Recent Development and News in Small molecule api market

  • In the Pharmaceuticals industry, the rapid deployment of continuous flow chemistry frameworks across primary manufacturing corridors optimized chemical synthesis pathways, directly impacting Small Molecule API demand by cutting intermediate isolation times by 20%.
  • The enforcement of stringent chemical waste management directives compelled industrial producers to adopt zero liquid discharge technologies, shifting Small Molecule API manufacturing strategies toward sustainable processing environments.
  • The structural shift toward advanced precision medicine approaches required enhanced combinatorial chemistry libraries, fundamentally expanding the Small Molecule API market requirement for targeted intracellular therapeutic formulations.
  • Widespread integration of automated process analytical technology across biopharmaceutical quality control systems reduced batch rejection rates by 14%, accelerating the commercial throughput of complex Small Molecule API product pipelines.

Dive into Technavio’s robust research methodology, blending expert interviews, extensive data synthesis, and validated models for unparalleled Small Molecule Api Market insights. See full methodology.

Market Scope
Page number 294
Base year 2025
Historic period 2020-2024
Forecast period 2026-2030
Growth momentum & CAGR Accelerate at a CAGR of 7.3%
Market growth 2026-2030 USD 74871.9 million
Market structure Fragmented
YoY growth 2025-2026(%) 7.2%
Key countries US, Canada, Mexico, China, Japan, South Korea, India, Taiwan, Singapore, Germany, UK, France, Italy, Spain, The Netherlands, Brazil, Saudi Arabia, South Africa, Argentina, UAE, Israel, Egypt and Chile
Competitive landscape Leading Companies, Market Positioning of Companies, Competitive Strategies, and Industry Risks

Request Free Sample

Research Analyst Overview

  • The Global Small Molecule API Market 2026-2030 is navigating a period of intense technological modernization and supply chain recalibration. Pharmaceutical manufacturers are shifting away from conventional batch operations in favor of advanced catalytic methods and microreactor channels, which offer superior thermal management and reaction selectivity. This fundamental operational shift allows facilities to process high-potency active ingredient payloads safely and effectively.
  • Organizations deploying automated reaction monitoring systems have reported a 28% decrease in out-of-specification batch deviations, representing a substantial measurable improvement in overall manufacturing reliability. Furthermore, the strategic application of generative artificial intelligence and sophisticated synthetic route planning software enables drug developers to bypass traditional empirical bottlenecks, accelerating the pathway from preclinical testing to commercial launch.
  • To align with increasingly stringent ecological mandates, production sites are actively integrating green chemistry catalysts to minimize hazardous byproducts. These proactive boardroom-level investments in digital process control and sustainable chemistry directly optimize operating margins and insulate essential pharmaceutical supply chains against future logistical vulnerabilities.

What are the Key Data Covered in this Small Molecule Api Market Research and Growth Report?

  • What is the expected growth of the Small Molecule Api Market between 2026 and 2030?

    • USD 74.87 billion, at a CAGR of 7.3%

  • What segmentation does the market report cover?

    • The report is segmented by Deployment (Captive APIs, and Contract APIs), Type (Synthetic, and Biotech), Indication (Oncology, Cardiovascular diseases, Diabetes, and Others) and Geography (North America, Asia, Europe, Rest of World (ROW))

  • Which regions are analyzed in the report?

    • North America, Asia, Europe and Rest of World (ROW)

  • What are the key growth drivers and market challenges?

    • Rising prevalence of chronic diseases steadily boosts global small molecule demand, Severe supply chain disruption threatens global small molecule active pharmaceutical ingredient production

  • Who are the major players in the Small Molecule Api Market?

    • AbbVie Inc., Aragen Life Sciences Pvt. Ltd., Asymchem Labs Tianjin Ltd., Aurobindo Pharma Ltd., Cambrex Corp., Catalent Inc., Cohance Lifesciences Ltd., Curia Global Inc., Divis Laboratories Ltd., Dr. Reddys Laboratories Ltd., Evonik Industries AG, Granules India Ltd., Laurus Labs Ltd., Lonza Group Ltd., Neuland Laboratories, Pharmaron Beijing Co. Ltd., Piramal Pharma Solutions, Siegfried Holding AG, Solara Active Pharma Sciences Ltd. and WuXi AppTec Co. Ltd.

Market Research Insights

  • The Small Molecule API Market is undergoing a rapid structural transformation as organizations pivot toward precision medicine approaches and highly targeted therapeutics. Companies deploying continuous processing technologies are achieving a 30% reduction in production cycle times compared to legacy batch methods. Furthermore, the integration of real-time quality verification systems within automated synthesis platforms has decreased regulatory compliance deviations by 18%.
  • To mitigate international logistics risks, pharmaceutical stakeholders are increasingly investing in domestic manufacturing capabilities, which has enhanced supply chain resilience and improved inventory turnover ratios by 22%. These strategic operational shifts empower manufacturers to optimize overall equipment effectiveness while ensuring the uninterrupted delivery of critical active pharmaceutical ingredients.

We can help! Our analysts can customize this small molecule api market research report to meet your requirements.

Get in touch

1. Executive Summary

1.1 Market overview

Executive Summary - Chart on Market Overview
Executive Summary - Data Table on Market Overview
Executive Summary - Chart on Global Market Characteristics
Executive Summary - Chart on Market by Geography
Executive Summary - Chart on Market Segmentation by Deployment
Executive Summary - Chart on Market Segmentation by Type
Executive Summary - Chart on Market Segmentation by Indication
Executive Summary - Chart on Incremental Growth
Executive Summary - Data Table on Incremental Growth
Executive Summary - Chart on Company Market Positioning

2. Technavio Analysis

2.1 Analysis of price sensitivity, lifecycle, customer purchase basket, adoption rates, and purchase criteria

2.2 Criticality of inputs and Factors of differentiation

Chart on Overview on criticality of inputs and factors of differentiation

2.3 Factors of disruption

Chart on Overview on factors of disruption

2.4 Impact of drivers and challenges

Chart on Impact of drivers and challenges in 2025 and 2030

3. Market Landscape

3.1 Market ecosystem

Chart on Parent Market
Data Table on - Parent Market

3.2 Market characteristics

Chart on Market characteristics analysis

3.3 Value chain analysis

Chart on Value chain analysis

4. Market Sizing

4.1 Market definition

Data Table on Offerings of companies included in the market definition

4.2 Market segment analysis

Market segments

4.3 Market size 2025

4.4 Market outlook: Forecast for 2025-2030

Chart on Global - Market size and forecast 2025-2030 ($ million)
Data Table on Global - Market size and forecast 2025-2030 ($ million)
Chart on Global Market: Year-over-year growth 2025-2030 (%)
Data Table on Global Market: Year-over-year growth 2025-2030 (%)

5. Historic Market Size

5.1 Global Small Molecule API Market 2020 - 2024

Historic Market Size - Data Table on Global Small Molecule API Market 2020 - 2024 ($ million)

5.2 Deployment segment analysis 2020 - 2024

Historic Market Size - Deployment Segment 2020 - 2024 ($ million)

5.3 Type segment analysis 2020 - 2024

Historic Market Size - Type Segment 2020 - 2024 ($ million)

5.4 Indication segment analysis 2020 - 2024

Historic Market Size - Indication Segment 2020 - 2024 ($ million)

5.5 Geography segment analysis 2020 - 2024

Historic Market Size - Geography Segment 2020 - 2024 ($ million)

5.6 Country segment analysis 2020 - 2024

Historic Market Size - Country Segment 2020 - 2024 ($ million)

6. Qualitative Analysis

6.1 Impact of AI on global small molecule API market

6.2 Impact of geopolitical conflicts on global small molecule API market

7. Five Forces Analysis

7.1 Five forces summary

Five forces analysis - Comparison between 2025 and 2030

7.2 Bargaining power of buyers

Bargaining power of buyers - Impact of key factors 2025 and 2030

7.3 Bargaining power of suppliers

Bargaining power of suppliers - Impact of key factors in 2025 and 2030

7.4 Threat of new entrants

Threat of new entrants - Impact of key factors in 2025 and 2030

7.5 Threat of substitutes

Threat of substitutes - Impact of key factors in 2025 and 2030

7.6 Threat of rivalry

Threat of rivalry - Impact of key factors in 2025 and 2030

7.7 Market condition

Chart on Market condition - Five forces 2025 and 2030

8. Market Segmentation by Deployment

8.1 Market segments

Chart on Deployment - Market share 2025-2030 (%)
Data Table on Deployment - Market share 2025-2030 (%)

8.2 Comparison by Deployment

Chart on Comparison by Deployment
Data Table on Comparison by Deployment

8.3 Captive APIs - Market size and forecast 2025-2030

Chart on Captive APIs - Market size and forecast 2025-2030 ($ million)
Data Table on Captive APIs - Market size and forecast 2025-2030 ($ million)
Chart on Captive APIs - Year-over-year growth 2025-2030 (%)
Data Table on Captive APIs - Year-over-year growth 2025-2030 (%)

8.4 Contract APIs - Market size and forecast 2025-2030

Chart on Contract APIs - Market size and forecast 2025-2030 ($ million)
Data Table on Contract APIs - Market size and forecast 2025-2030 ($ million)
Chart on Contract APIs - Year-over-year growth 2025-2030 (%)
Data Table on Contract APIs - Year-over-year growth 2025-2030 (%)

8.5 Market opportunity by Deployment

Market opportunity by Deployment ($ million)
Data Table on Market opportunity by Deployment ($ million)

9. Market Segmentation by Type

9.1 Market segments

Chart on Type - Market share 2025-2030 (%)
Data Table on Type - Market share 2025-2030 (%)

9.2 Comparison by Type

Chart on Comparison by Type
Data Table on Comparison by Type

9.3 Synthetic - Market size and forecast 2025-2030

Chart on Synthetic - Market size and forecast 2025-2030 ($ million)
Data Table on Synthetic - Market size and forecast 2025-2030 ($ million)
Chart on Synthetic - Year-over-year growth 2025-2030 (%)
Data Table on Synthetic - Year-over-year growth 2025-2030 (%)

9.4 Biotech - Market size and forecast 2025-2030

Chart on Biotech - Market size and forecast 2025-2030 ($ million)
Data Table on Biotech - Market size and forecast 2025-2030 ($ million)
Chart on Biotech - Year-over-year growth 2025-2030 (%)
Data Table on Biotech - Year-over-year growth 2025-2030 (%)

9.5 Market opportunity by Type

Market opportunity by Type ($ million)
Data Table on Market opportunity by Type ($ million)

10. Market Segmentation by Indication

10.1 Market segments

Chart on Indication - Market share 2025-2030 (%)
Data Table on Indication - Market share 2025-2030 (%)

10.2 Comparison by Indication

Chart on Comparison by Indication
Data Table on Comparison by Indication

10.3 Oncology - Market size and forecast 2025-2030

Chart on Oncology - Market size and forecast 2025-2030 ($ million)
Data Table on Oncology - Market size and forecast 2025-2030 ($ million)
Chart on Oncology - Year-over-year growth 2025-2030 (%)
Data Table on Oncology - Year-over-year growth 2025-2030 (%)

10.4 Cardiovascular diseases - Market size and forecast 2025-2030

Chart on Cardiovascular diseases - Market size and forecast 2025-2030 ($ million)
Data Table on Cardiovascular diseases - Market size and forecast 2025-2030 ($ million)
Chart on Cardiovascular diseases - Year-over-year growth 2025-2030 (%)
Data Table on Cardiovascular diseases - Year-over-year growth 2025-2030 (%)

10.5 Diabetes - Market size and forecast 2025-2030

Chart on Diabetes - Market size and forecast 2025-2030 ($ million)
Data Table on Diabetes - Market size and forecast 2025-2030 ($ million)
Chart on Diabetes - Year-over-year growth 2025-2030 (%)
Data Table on Diabetes - Year-over-year growth 2025-2030 (%)

10.6 Others - Market size and forecast 2025-2030

Chart on Others - Market size and forecast 2025-2030 ($ million)
Data Table on Others - Market size and forecast 2025-2030 ($ million)
Chart on Others - Year-over-year growth 2025-2030 (%)
Data Table on Others - Year-over-year growth 2025-2030 (%)

10.7 Market opportunity by Indication

Market opportunity by Indication ($ million)
Data Table on Market opportunity by Indication ($ million)

11. Customer Landscape

11.1 Customer landscape overview

Analysis of price sensitivity, lifecycle, customer purchase basket, adoption rates, and purchase criteria

12. Geographic Landscape

12.1 Geographic segmentation

Chart on Market share by geography 2025-2030 (%)
Data Table on Market share by geography 2025-2030 (%)

12.2 Geographic comparison

Chart on Geographic comparison
Data Table on Geographic comparison

12.3 North America - Market size and forecast 2025-2030

Chart on North America - Market size and forecast 2025-2030 ($ million)
Data Table on North America - Market size and forecast 2025-2030 ($ million)
Chart on North America - Year-over-year growth 2025-2030 (%)
Data Table on North America - Year-over-year growth 2025-2030 (%)
Chart on Regional Comparison - North America
Data Table on Regional Comparison - North America

12.3.1 US - Market size and forecast 2025-2030

Chart on US - Market size and forecast 2025-2030 ($ million)
Data Table on US - Market size and forecast 2025-2030 ($ million)
Chart on US - Year-over-year growth 2025-2030 (%)
Data Table on US - Year-over-year growth 2025-2030 (%)

12.3.2 Canada - Market size and forecast 2025-2030

Chart on Canada - Market size and forecast 2025-2030 ($ million)
Data Table on Canada - Market size and forecast 2025-2030 ($ million)
Chart on Canada - Year-over-year growth 2025-2030 (%)
Data Table on Canada - Year-over-year growth 2025-2030 (%)

12.3.3 Mexico - Market size and forecast 2025-2030

Chart on Mexico - Market size and forecast 2025-2030 ($ million)
Data Table on Mexico - Market size and forecast 2025-2030 ($ million)
Chart on Mexico - Year-over-year growth 2025-2030 (%)
Data Table on Mexico - Year-over-year growth 2025-2030 (%)

12.4 Asia - Market size and forecast 2025-2030

Chart on Asia - Market size and forecast 2025-2030 ($ million)
Data Table on Asia - Market size and forecast 2025-2030 ($ million)
Chart on Asia - Year-over-year growth 2025-2030 (%)
Data Table on Asia - Year-over-year growth 2025-2030 (%)
Chart on Regional Comparison - Asia
Data Table on Regional Comparison - Asia

12.4.1 China - Market size and forecast 2025-2030

Chart on China - Market size and forecast 2025-2030 ($ million)
Data Table on China - Market size and forecast 2025-2030 ($ million)
Chart on China - Year-over-year growth 2025-2030 (%)
Data Table on China - Year-over-year growth 2025-2030 (%)

12.4.2 Japan - Market size and forecast 2025-2030

Chart on Japan - Market size and forecast 2025-2030 ($ million)
Data Table on Japan - Market size and forecast 2025-2030 ($ million)
Chart on Japan - Year-over-year growth 2025-2030 (%)
Data Table on Japan - Year-over-year growth 2025-2030 (%)

12.4.3 South Korea - Market size and forecast 2025-2030

Chart on South Korea - Market size and forecast 2025-2030 ($ million)
Data Table on South Korea - Market size and forecast 2025-2030 ($ million)
Chart on South Korea - Year-over-year growth 2025-2030 (%)
Data Table on South Korea - Year-over-year growth 2025-2030 (%)

12.4.4 India - Market size and forecast 2025-2030

Chart on India - Market size and forecast 2025-2030 ($ million)
Data Table on India - Market size and forecast 2025-2030 ($ million)
Chart on India - Year-over-year growth 2025-2030 (%)
Data Table on India - Year-over-year growth 2025-2030 (%)

12.4.5 Taiwan - Market size and forecast 2025-2030

Chart on Taiwan - Market size and forecast 2025-2030 ($ million)
Data Table on Taiwan - Market size and forecast 2025-2030 ($ million)
Chart on Taiwan - Year-over-year growth 2025-2030 (%)
Data Table on Taiwan - Year-over-year growth 2025-2030 (%)

12.4.6 Singapore - Market size and forecast 2025-2030

Chart on Singapore - Market size and forecast 2025-2030 ($ million)
Data Table on Singapore - Market size and forecast 2025-2030 ($ million)
Chart on Singapore - Year-over-year growth 2025-2030 (%)
Data Table on Singapore - Year-over-year growth 2025-2030 (%)

12.5 Europe - Market size and forecast 2025-2030

Chart on Europe - Market size and forecast 2025-2030 ($ million)
Data Table on Europe - Market size and forecast 2025-2030 ($ million)
Chart on Europe - Year-over-year growth 2025-2030 (%)
Data Table on Europe - Year-over-year growth 2025-2030 (%)
Chart on Regional Comparison - Europe
Data Table on Regional Comparison - Europe

12.5.1 Germany - Market size and forecast 2025-2030

Chart on Germany - Market size and forecast 2025-2030 ($ million)
Data Table on Germany - Market size and forecast 2025-2030 ($ million)
Chart on Germany - Year-over-year growth 2025-2030 (%)
Data Table on Germany - Year-over-year growth 2025-2030 (%)

12.5.2 UK - Market size and forecast 2025-2030

Chart on UK - Market size and forecast 2025-2030 ($ million)
Data Table on UK - Market size and forecast 2025-2030 ($ million)
Chart on UK - Year-over-year growth 2025-2030 (%)
Data Table on UK - Year-over-year growth 2025-2030 (%)

12.5.3 France - Market size and forecast 2025-2030

Chart on France - Market size and forecast 2025-2030 ($ million)
Data Table on France - Market size and forecast 2025-2030 ($ million)
Chart on France - Year-over-year growth 2025-2030 (%)
Data Table on France - Year-over-year growth 2025-2030 (%)

12.5.4 Italy - Market size and forecast 2025-2030

Chart on Italy - Market size and forecast 2025-2030 ($ million)
Data Table on Italy - Market size and forecast 2025-2030 ($ million)
Chart on Italy - Year-over-year growth 2025-2030 (%)
Data Table on Italy - Year-over-year growth 2025-2030 (%)

12.5.5 Spain - Market size and forecast 2025-2030

Chart on Spain - Market size and forecast 2025-2030 ($ million)
Data Table on Spain - Market size and forecast 2025-2030 ($ million)
Chart on Spain - Year-over-year growth 2025-2030 (%)
Data Table on Spain - Year-over-year growth 2025-2030 (%)

12.5.6 The Netherlands - Market size and forecast 2025-2030

Chart on The Netherlands - Market size and forecast 2025-2030 ($ million)
Data Table on The Netherlands - Market size and forecast 2025-2030 ($ million)
Chart on The Netherlands - Year-over-year growth 2025-2030 (%)
Data Table on The Netherlands - Year-over-year growth 2025-2030 (%)

12.6 Rest of World (ROW) - Market size and forecast 2025-2030

Chart on Rest of World (ROW) - Market size and forecast 2025-2030 ($ million)
Data Table on Rest of World (ROW) - Market size and forecast 2025-2030 ($ million)
Chart on Rest of World (ROW) - Year-over-year growth 2025-2030 (%)
Data Table on Rest of World (ROW) - Year-over-year growth 2025-2030 (%)
Chart on Regional Comparison - Rest of World (ROW)
Data Table on Regional Comparison - Rest of World (ROW)

12.6.1 Brazil - Market size and forecast 2025-2030

Chart on Brazil - Market size and forecast 2025-2030 ($ million)
Data Table on Brazil - Market size and forecast 2025-2030 ($ million)
Chart on Brazil - Year-over-year growth 2025-2030 (%)
Data Table on Brazil - Year-over-year growth 2025-2030 (%)

12.6.2 Saudi Arabia - Market size and forecast 2025-2030

Chart on Saudi Arabia - Market size and forecast 2025-2030 ($ million)
Data Table on Saudi Arabia - Market size and forecast 2025-2030 ($ million)
Chart on Saudi Arabia - Year-over-year growth 2025-2030 (%)
Data Table on Saudi Arabia - Year-over-year growth 2025-2030 (%)

12.6.3 South Africa - Market size and forecast 2025-2030

Chart on South Africa - Market size and forecast 2025-2030 ($ million)
Data Table on South Africa - Market size and forecast 2025-2030 ($ million)
Chart on South Africa - Year-over-year growth 2025-2030 (%)
Data Table on South Africa - Year-over-year growth 2025-2030 (%)

12.6.4 Argentina - Market size and forecast 2025-2030

Chart on Argentina - Market size and forecast 2025-2030 ($ million)
Data Table on Argentina - Market size and forecast 2025-2030 ($ million)
Chart on Argentina - Year-over-year growth 2025-2030 (%)
Data Table on Argentina - Year-over-year growth 2025-2030 (%)

12.6.5 UAE - Market size and forecast 2025-2030

Chart on UAE - Market size and forecast 2025-2030 ($ million)
Data Table on UAE - Market size and forecast 2025-2030 ($ million)
Chart on UAE - Year-over-year growth 2025-2030 (%)
Data Table on UAE - Year-over-year growth 2025-2030 (%)

12.6.6 Israel - Market size and forecast 2025-2030

Chart on Israel - Market size and forecast 2025-2030 ($ million)
Data Table on Israel - Market size and forecast 2025-2030 ($ million)
Chart on Israel - Year-over-year growth 2025-2030 (%)
Data Table on Israel - Year-over-year growth 2025-2030 (%)

12.6.7 Egypt - Market size and forecast 2025-2030

Chart on Egypt - Market size and forecast 2025-2030 ($ million)
Data Table on Egypt - Market size and forecast 2025-2030 ($ million)
Chart on Egypt - Year-over-year growth 2025-2030 (%)
Data Table on Egypt - Year-over-year growth 2025-2030 (%)

12.6.8 Chile - Market size and forecast 2025-2030

Chart on Chile - Market size and forecast 2025-2030 ($ million)
Data Table on Chile - Market size and forecast 2025-2030 ($ million)
Chart on Chile - Year-over-year growth 2025-2030 (%)
Data Table on Chile - Year-over-year growth 2025-2030 (%)

12.7 Market opportunity by geography

Market opportunity by geography ($ million)
Data Tables on Market opportunity by geography ($ million)

13. Drivers, Challenges, and Opportunity

13.1 Market drivers

Rising prevalence of chronic diseases steadily boosts global small molecule demand
Strategic expansion of outsourcing to contract development organizations accelerates global production
Technological advancements in continuous manufacturing significantly enhance operational efficiency worldwide

13.2 Market challenges

Severe supply chain disruption threatens global small molecule active pharmaceutical ingredient production
Stringent environmental compliance regulations substantially increase chemical manufacturing costs across global facilities
Intense generic competition significantly reduces profit margins for small molecule producers

13.3 Impact of drivers and challenges

Impact of drivers and challenges in 2025 and 2030

13.4 Market opportunities

Adoption of advanced flow chemistry methods revolutionizes small molecule synthesis processes
Integration of AI technology optimizes chemical synthesis pathways globally
Strategic nearshoring and reshoring initiatives transform global active pharmaceutical ingredient supply chains

14. Competitive Landscape

14.1 Overview

14.2

Overview on criticality of inputs and factors of differentiation

14.3 Landscape disruption

Overview on factors of disruption

14.4 Industry risks

Impact of key risks on business

15. Competitive Analysis

15.1 Companies profiled

Companies covered

15.2 Company ranking index

15.3 Market positioning of companies

Matrix on companies position and classification

15.4 AbbVie Inc.

AbbVie Inc. - Overview
AbbVie Inc. - Business segments
AbbVie Inc. - Key news
AbbVie Inc. - Key offerings
AbbVie Inc. - Segment focus
SWOT

15.5 Aragen Life Sciences Pvt. Ltd.

Aragen Life Sciences Pvt. Ltd. - Overview
Aragen Life Sciences Pvt. Ltd. - Product / Service
Aragen Life Sciences Pvt. Ltd. - Key offerings
SWOT

15.6 Asymchem Labs Tianjin Ltd.

Asymchem Labs Tianjin Ltd. - Overview
Asymchem Labs Tianjin Ltd. - Product / Service
Asymchem Labs Tianjin Ltd. - Key offerings
SWOT

15.7 Aurobindo Pharma Ltd.

Aurobindo Pharma Ltd. - Overview
Aurobindo Pharma Ltd. - Business segments
Aurobindo Pharma Ltd. - Key news
Aurobindo Pharma Ltd. - Key offerings
Aurobindo Pharma Ltd. - Segment focus
SWOT

15.8 Cambrex Corp.

Cambrex Corp. - Overview
Cambrex Corp. - Product / Service
Cambrex Corp. - Key offerings
SWOT

15.9 Catalent Inc.

Catalent Inc. - Overview
Catalent Inc. - Product / Service
Catalent Inc. - Key offerings
SWOT

15.10 Cohance Lifesciences Ltd.

Cohance Lifesciences Ltd. - Overview
Cohance Lifesciences Ltd. - Product / Service
Cohance Lifesciences Ltd. - Key offerings
SWOT

15.11 Curia Global Inc.

Curia Global Inc. - Overview
Curia Global Inc. - Product / Service
Curia Global Inc. - Key offerings
SWOT

15.12 Dr. Reddys Laboratories Ltd.

Dr. Reddys Laboratories Ltd. - Overview
Dr. Reddys Laboratories Ltd. - Business segments
Dr. Reddys Laboratories Ltd. - Key news
Dr. Reddys Laboratories Ltd. - Key offerings
Dr. Reddys Laboratories Ltd. - Segment focus
SWOT

15.13 Evonik Industries AG

Evonik Industries AG - Overview
Evonik Industries AG - Business segments
Evonik Industries AG - Key news
Evonik Industries AG - Key offerings
Evonik Industries AG - Segment focus
SWOT

15.14 Granules India Ltd.

Granules India Ltd. - Overview
Granules India Ltd. - Product / Service
Granules India Ltd. - Key offerings
SWOT

15.15 Lonza Group Ltd.

Lonza Group Ltd. - Overview
Lonza Group Ltd. - Business segments
Lonza Group Ltd. - Key news
Lonza Group Ltd. - Key offerings
Lonza Group Ltd. - Segment focus
SWOT

15.16 Pharmaron Beijing Co. Ltd.

Pharmaron Beijing Co. Ltd. - Overview
Pharmaron Beijing Co. Ltd. - Product / Service
Pharmaron Beijing Co. Ltd. - Key offerings
SWOT

15.17 Piramal Pharma Solutions

Piramal Pharma Solutions - Overview
Piramal Pharma Solutions - Business segments
Piramal Pharma Solutions - Key offerings
Piramal Pharma Solutions - Segment focus
SWOT

15.18 WuXi AppTec Co. Ltd.

WuXi AppTec Co. Ltd. - Overview
WuXi AppTec Co. Ltd. - Business segments
WuXi AppTec Co. Ltd. - Key offerings
WuXi AppTec Co. Ltd. - Segment focus
SWOT

16. Appendix

16.1 Scope of the report

Market definition
Objectives
Notes and caveats

16.2 Inclusions and exclusions checklist

Inclusions checklist
Exclusions checklist

16.3 Currency conversion rates for US$

16.4 Research methodology

16.5 Data procurement

Information sources

16.6 Data validation

16.7 Validation techniques employed for market sizing

16.8 Data synthesis

16.9 360 degree market analysis

16.10 List of abbreviations

Research Methodology

Technavio presents a detailed picture of the market by way of study, synthesis, and summation of data from multiple sources. The analysts have presented the various facets of the market with a particular focus on identifying the key industry influencers. The data thus presented is comprehensive, reliable, and the result of extensive research, both primary and secondary.

INFORMATION SOURCES

Primary sources

  • Manufacturers and suppliers
  • Channel partners
  • Industry experts
  • Strategic decision makers

Secondary sources

  • Industry journals and periodicals
  • Government data
  • Financial reports of key industry players
  • Historical data
  • Press releases

DATA ANALYSIS

Data Synthesis

  • Collation of data
  • Estimation of key figures
  • Analysis of derived insights

Data Validation

  • Triangulation with data models
  • Reference against proprietary databases
  • Corroboration with industry experts

REPORT WRITING

Qualitative

  • Market drivers
  • Market challenges
  • Market trends
  • Five forces analysis

Quantitative

  • Market size and forecast
  • Market segmentation
  • Geographical insights
  • Competitive landscape

Interested in this report?

Get your sample now to see our research methodology and insights!

Download Now

Frequently Asked Questions

Small Molecule Api market growth will increase by USD 74871.9 million during 2026-2030.

The Small Molecule Api market is expected to grow at a CAGR of 7.3% during 2026-2030.

Small Molecule Api market is segmented by Deployment (Captive APIs, Contract APIs) Type (Synthetic, Biotech) Indication (Oncology, Cardiovascular diseases, Diabetes, Others)

AbbVie Inc., Aragen Life Sciences Pvt. Ltd., Asymchem Labs Tianjin Ltd., Aurobindo Pharma Ltd., Cambrex Corp., Catalent Inc., Cohance Lifesciences Ltd., Curia Global Inc., Divis Laboratories Ltd., Dr. Reddys Laboratories Ltd., Evonik Industries AG, Granules India Ltd., Laurus Labs Ltd., Lonza Group Ltd., Neuland Laboratories, Pharmaron Beijing Co. Ltd., Piramal Pharma Solutions, Siegfried Holding AG, Solara Active Pharma Sciences Ltd., WuXi AppTec Co. Ltd. are a few of the key vendors in the Small Molecule Api market.

North America will register the highest growth rate of 44.1% among the other regions. Therefore, the Small Molecule Api market in North America is expected to garner significant business opportunities for the vendors during the forecast period.

US, Canada, Mexico, China, Japan, South Korea, India, Taiwan, Singapore, Germany, UK, France, Italy, Spain, The Netherlands, Brazil, Saudi Arabia, South Africa, Argentina, UAE, Israel, Egypt, Chile

  • Rising prevalence of chronic diseases steadily boosts global small molecule demand is the driving factor this market.

The Small Molecule Api market vendors should focus on grabbing business opportunities from the Deployment segment as it accounted for the largest market share in the base year.
RIA - Research AI Assistant
Ask RIA
