Rolling Stock Market Analysis, Size, and Forecast 2026-2030: APAC (China, Japan, and India), Europe (Germany, France, and UK), North America (US, Canada, and Mexico), South America (Brazil and Argentina), Middle East and Africa (Saudi Arabia, UAE, and South Africa), and Rest of World (ROW)

Rolling Stock Market Analysis, Size, and Forecast 2026-2030:
APAC (China, Japan, and India), Europe (Germany, France, and UK), North America (US, Canada, and Mexico), South America (Brazil and Argentina), Middle East and Africa (Saudi Arabia, UAE, and South Africa), and Rest of World (ROW)

Published: Apr 2026 291 Pages SKU: IRTNTR76541

Market Overview at a Glance

$12.74 B
Market Opportunity
4%
CAGR 2025 - 2030
47.7%
APAC Growth
$34.53 B
Rail freight segment 2024

Rolling Stock Market Size 2026-2030

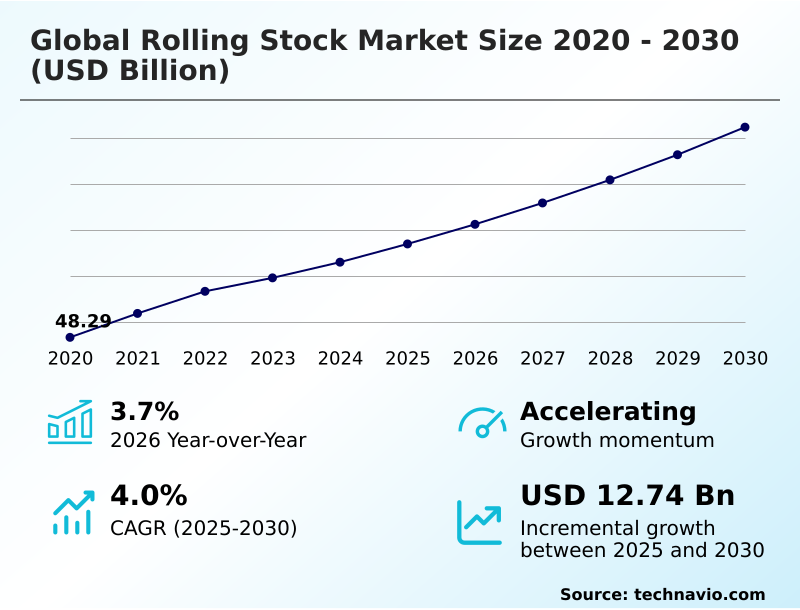
The rolling stock market size is valued to increase by USD 12.74 billion, at a CAGR of 4% from 2025 to 2030. Strategic acceleration of railway electrification and decarbonization will drive the rolling stock market.

Major Market Trends & Insights

  • APAC dominated the market and accounted for a 47.7% growth during the forecast period.
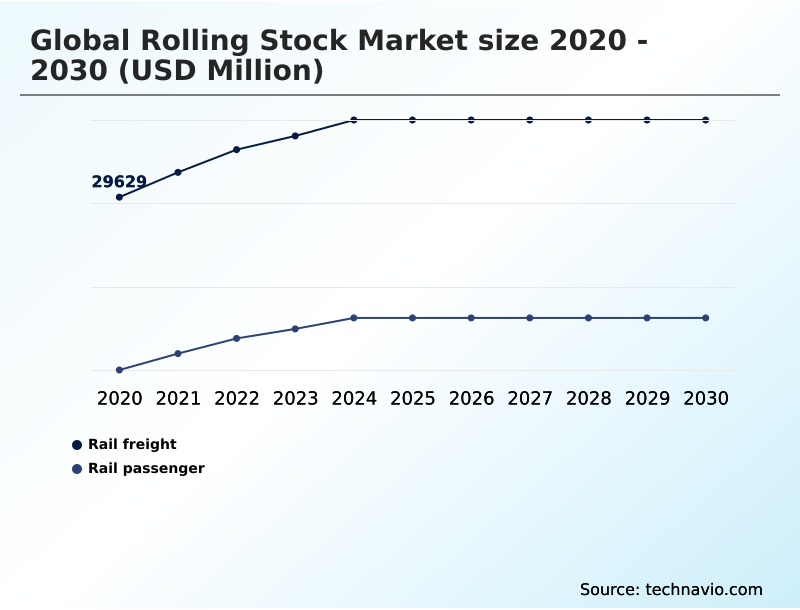
  • By Application - Rail freight segment was valued at USD 34.53 billion in 2024
  • By Type - Diesel segment accounted for the largest market revenue share in 2024

Market Size & Forecast

  • Market Opportunities: USD 22.94 billion
  • Market Future Opportunities: USD 12.74 billion
  • CAGR from 2025 to 2030 : 4%

Market Summary

  • The rolling stock market is undergoing a significant transformation, driven by the dual imperatives of modernization and sustainability. A primary focus is the shift away from legacy systems toward solutions offering greater operational efficiency and lower environmental impact. This includes the development of zero-emission propulsion technologies and the widespread adoption of digital tools.
  • For example, a freight operator utilizing onboard telematics and predictive maintenance algorithms can proactively identify a potential component failure in its locomotives, allowing for rerouting and scheduled maintenance that avoids costly, unplanned service disruption. This scenario underscores the industry's move toward data-driven decision-making to enhance reliability and asset performance.
  • Key drivers include government-led railway electrification programs and the expansion of urban mass transit networks to alleviate congestion. However, the high capital investment required for new fleets and infrastructure upgrades remains a significant consideration for operators globally, influencing procurement strategies and the pace of technological adoption in the rolling stock sector.

What will be the Size of the Rolling Stock Market during the forecast period?

Get Key Insights on Market Forecast (PDF) Request Free Sample

How is the Rolling Stock Market Segmented?

The rolling stock industry research report provides comprehensive data (region-wise segment analysis), with forecasts and estimates in "USD million" for the period 2026-2030, as well as historical data from 2020-2024 for the following segments.

  • Application
    • Rail freight
    • Rail passenger
  • Type
    • Diesel
    • Electric
    • Electro-diesel
  • Product
    • Locomotive
    • Rapid transit vehicle
    • Wagon
  • Geography
    • APAC
      • China
      • Japan
      • India
    • Europe
      • Germany
      • France
      • UK
    • North America
      • US
      • Canada
      • Mexico
    • South America
      • Brazil
      • Argentina
    • Middle East and Africa
      • Saudi Arabia
      • UAE
      • South Africa
    • Rest of World (ROW)

By Application Insights

The rail freight segment is estimated to witness significant growth during the forecast period.

The rail freight segment is central to heavy industrial logistics and intermodal freight transport, undergoing a shift from diesel-electric propulsion to electrified solutions. This transition addresses demands for decarbonization and enhanced efficiency in cross-border logistics.

Key advancements include the adoption of high-horsepower locomotives and high-capacity freight wagons designed for heavy-haul operations. The integration of onboard telematics and IoT sensor integration facilitates predictive maintenance algorithms, improving railcar fleet management.

For instance, locomotive fleet modernization efforts incorporating advanced energy management software have demonstrated fuel consumption reductions of approximately 15%.

This focus on digital asset management and railway electrification is crucial for optimizing the railway value chain and supporting sustainable transport solutions and shunting locomotives.

Request Free Sample

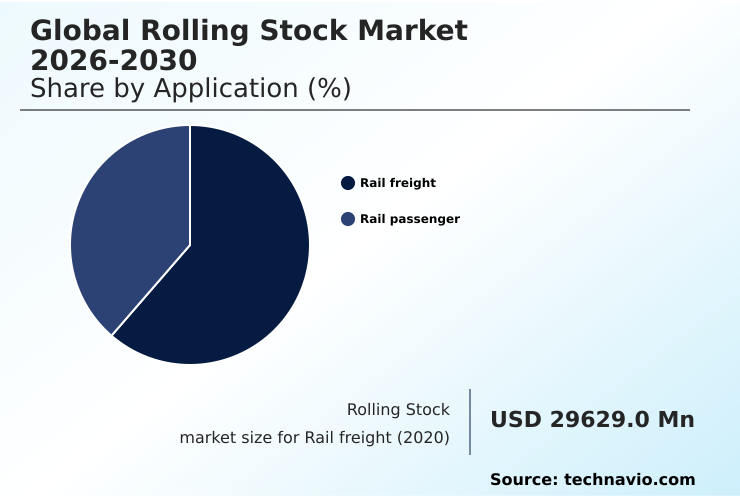
The Rail freight segment was valued at USD 34.53 billion in 2024 and showed a gradual increase during the forecast period.

Request Free Sample

Regional Analysis

APAC is estimated to contribute 47.7% to the growth of the global market during the forecast period.Technavio’s analysts have elaborately explained the regional trends and drivers that shape the market during the forecast period.

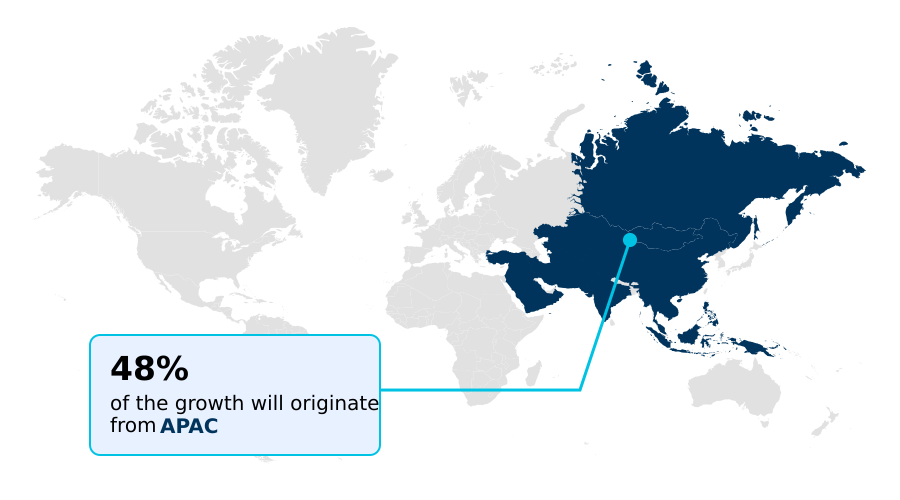
See How Rolling Stock Market Demand is Rising in APAC Request Free Sample

The geographic landscape of the rolling stock market is led by APAC, which is projected to account for 47.7% of the industry's incremental growth.

This dominance is propelled by massive rail infrastructure investment in high-speed rail vehicles and urban mass transit systems. The region's expansion rate, exceeding 4.6%, outpaces that of Europe, reflecting aggressive railway electrification and decarbonization policies.

In this competitive environment, the focus is on deploying advanced signaling solutions and achieving rail interoperability standards to support cross-border logistics. Financial viability is a key factor, with governments championing green rail initiatives through substantial capital investment.

Meanwhile, manufacturers are adopting lightweight vehicle design and alternative propulsion systems to meet demands for energy consumption optimization and urban congestion relief.

Market Dynamics

Our researchers analyzed the data with 2025 as the base year, along with the key drivers, trends, and challenges. A holistic analysis of drivers will help companies refine their marketing strategies to gain a competitive advantage.

  • The evolution of the global rolling stock market is increasingly defined by complex, interconnected strategies aimed at balancing performance, cost, and sustainability. A critical area of focus is understanding the impact of electrification on rolling stock design, which necessitates new approaches to engineering and manufacturing.
  • Simultaneously, the role of autonomous trains in urban transit is expanding, demanding sophisticated automated train control systems with robust cybersecurity measures. To manage these advanced assets, operators are leveraging digital twin for predictive maintenance in rail, which, when combined with software for railcar fleet management and logistics, can improve asset availability by over 20% compared to legacy methods.
  • The industry is also conducting cost-benefit analysis of hydrogen fuel cell trains as a viable path toward decarbonization, alongside advancements in lightweight materials for railcars to enhance efficiency. Navigating rolling stock procurement financing models remains a key task for public transport authorities, especially when upgrading legacy diesel-electric locomotive fleets.
  • Meeting regulatory standards for zero-emission rail vehicles and resolving challenges in cross-border rolling stock interoperability are essential for future growth. Furthermore, the industry is closely examining supply chain risks for rolling stock manufacturing while integrating IoT sensors in freight wagons to improve logistics.
  • As technology advances, so do maintenance strategies for modern rolling stock, with a focus on optimizing energy efficiency in electric locomotives and harnessing advancements in regenerative braking for EMUs. The impact of 5G on rail communication systems is poised to further revolutionize operations, while stakeholders continue comparing high-speed rail and maglev systems for future infrastructure projects.
  • These dynamics create a complex environment where rolling stock solutions for heavy-haul freight must coexist with innovations in passenger transport.

What are the key market drivers leading to the rise in the adoption of Rolling Stock Industry?

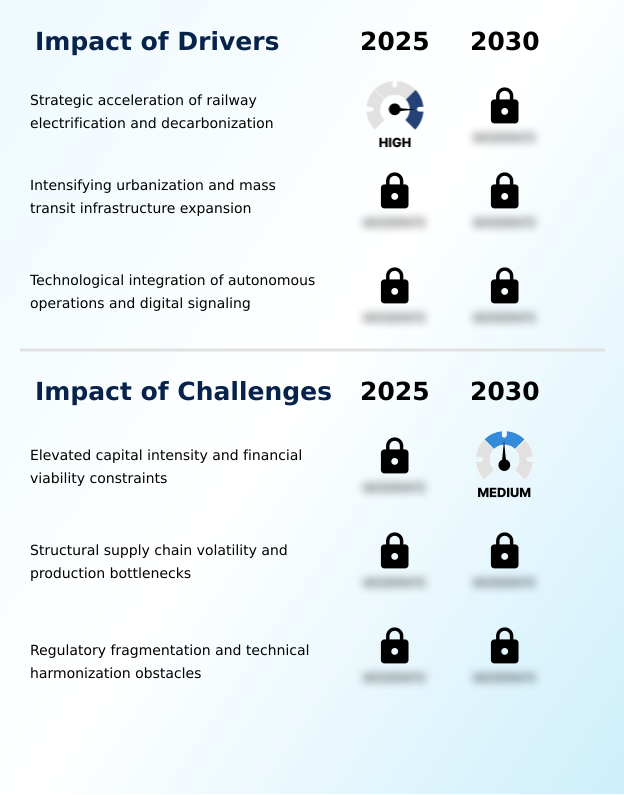
  • The strategic acceleration of railway electrification and decarbonization initiatives is a key driver for the market.

  • Growth in the rolling stock market is primarily driven by global transport decarbonization efforts and large-scale rail infrastructure investment. Government-led railway electrification mandates are accelerating the replacement of diesel-electric propulsion with electric traction systems and other zero-emission propulsion methods.
  • This transition to green rail initiatives is not only environmental but also economic, as electric multiple units and high-horsepower locomotives offer superior energy efficiency, reducing operational costs by over 10% in many use cases.
  • The expansion of mass transit infrastructure to combat urban congestion is fueling demand for urban mass transit vehicles.
  • Moreover, the development of dual-mode capabilities and advanced energy storage systems, including regenerative braking systems, is expanding the viability of electric and battery-hybrid technology on non-electrified lines, contributing to a more sustainable and interconnected global rail network.

What are the market trends shaping the Rolling Stock Industry?

  • A prominent market trend is the digital transformation of rolling stock operations. This is driven by the adoption of digital twins and predictive maintenance technologies to enhance efficiency.

  • Key trends reshaping the rolling stock sector center on digitalization and efficiency. The adoption of digital twin technology is becoming standard for railcar fleet management, enabling operators to simulate operational stress and predict failures, which has been shown to reduce unplanned service disruption by up to 20%.
  • This is complemented by condition-based monitoring, powered by advanced predictive maintenance algorithms and traction motor monitoring. The integration of high-speed 5G enabled connectivity and real-time data transmission allows for remote vehicle diagnostics, significantly improving operational uptime enhancement.
  • Furthermore, a focus on digital asset management and rolling stock refurbishment is extending the life of assets, which can defer capital expenditures by 15% in certain cases. This push for smart rail mobility is crucial for optimizing the total cost of ownership across all rolling stock.

What challenges does the Rolling Stock Industry face during its growth?

  • Elevated capital intensity and financial viability constraints pose a key challenge affecting industry growth.

  • The primary challenge constraining the rolling stock market is high capital investment intensity, which strains the financial viability of operators. The procurement of advanced locomotives and passenger coaches requires substantial upfront funding, with project costs often exceeding initial budgets by as much as 25% due to unforeseen complexities.
  • This is compounded by structural supply chain volatility and production bottlenecks, which can delay deliveries and increase component costs. Regulatory fragmentation across different regions creates significant hurdles for achieving seamless rail interoperability standards, adding to the complexity and cost of developing multi-system rolling stock.
  • Consequently, many operators are forced to prioritize less capital-intensive rail vehicle refurbishment over new acquisitions, slowing the adoption of cleaner, more efficient technologies and hindering progress toward achieving widespread autonomous rail operations.

Exclusive Technavio Analysis on Customer Landscape

The rolling stock market forecasting report includes the adoption lifecycle of the market, covering from the innovator’s stage to the laggard’s stage. It focuses on adoption rates in different regions based on penetration. Furthermore, the rolling stock market report also includes key purchase criteria and drivers of price sensitivity to help companies evaluate and develop their market growth analysis strategies.

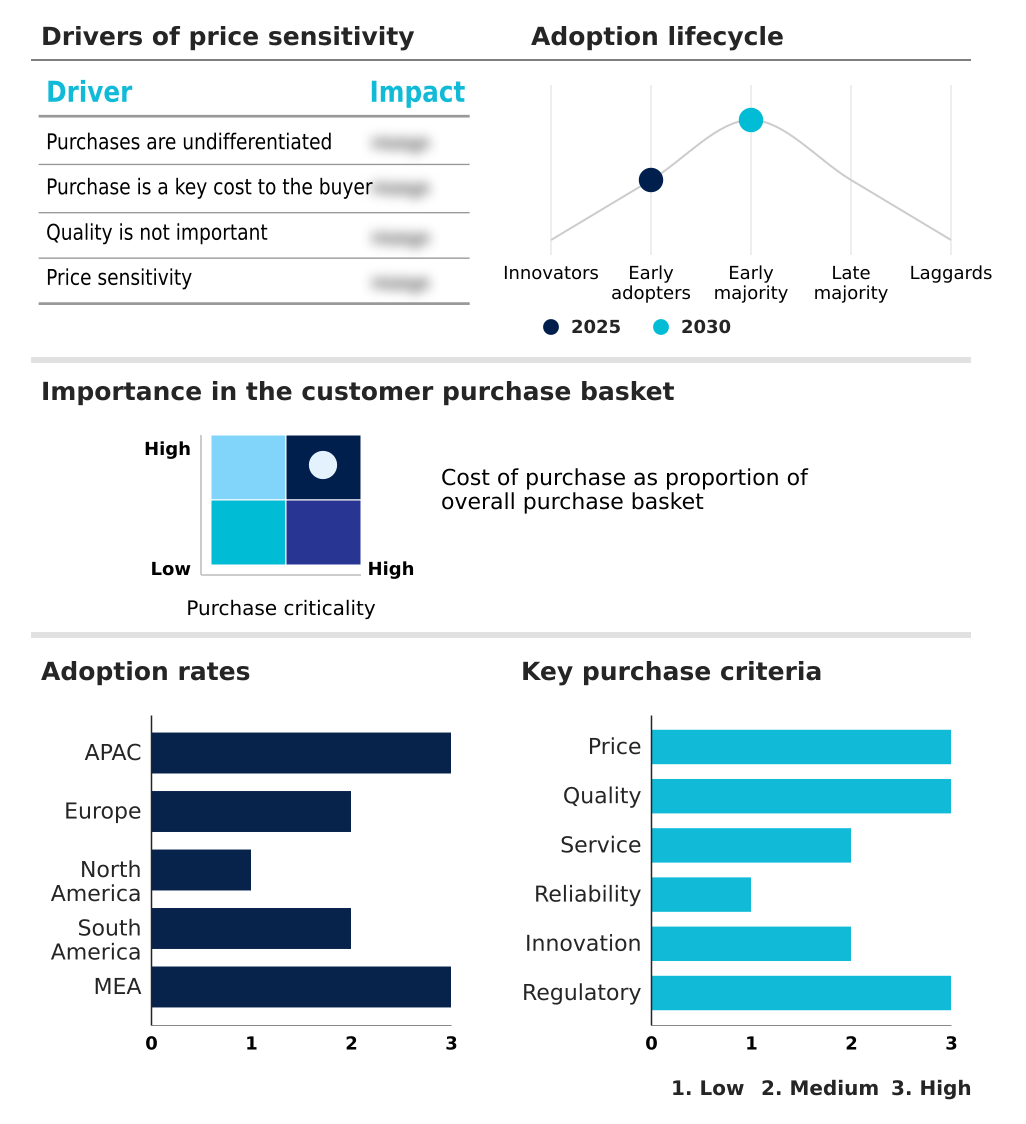
Customer Landscape of Rolling Stock Industry

Competitive Landscape

Companies are implementing various strategies, such as strategic alliances, rolling stock market forecast, partnerships, mergers and acquisitions, geographical expansion, and product/service launches, to enhance their presence in the industry.

ALSTOM SA - Analysis centers on the provision of advanced rolling stock, including high-speed, regional, and metro trains, complemented by integrated signaling, digital services, and complete lifecycle maintenance solutions.

The industry research and growth report includes detailed analyses of the competitive landscape of the market and information about key companies, including:

  • ALSTOM SA
  • CAF
  • Caterpillar Inc.
  • Central Japan Railway Co.
  • CRRC Corp. Ltd.
  • Hitachi Ltd.
  • Hyundai Motor Co.
  • IHI Corp.
  • Kawasaki Heavy Industries Ltd.
  • MAPNA Group Co.
  • PATENTES TALGO S.L.U.
  • Pesa Group
  • PPF Group
  • Siemens AG
  • Stadler Rail Ag
  • Tatravagonka a.s. Poprad
  • The Greenbrier Companies Inc.
  • The Kinki Sharyo Co. Ltd.
  • Trinity Industries Inc.
  • Wabtec Corp.

Qualitative and quantitative analysis of companies has been conducted to help clients understand the wider business environment as well as the strengths and weaknesses of key industry players. Data is qualitatively analyzed to categorize companies as pure play, category-focused, industry-focused, and diversified; it is quantitatively analyzed to categorize companies as dominant, leading, strong, tentative, and weak.

Recent Development and News in Rolling stock market

  • In May, 2025, Alstom finalized a framework agreement with Hamburger Hochbahn AG to supply up to 374 new metro trains, reinforcing investment in urban public transport electrification.
  • In March, 2025, Stadler Rail secured a framework agreement to deliver up to 200 multi-system EURO9000 locomotives to NEXRAIL, meeting demand for high-performance cross-border freight operations in Europe.
  • In February, 2025, Wabtec Corp. concluded a major agreement with a North American railroad to modernize a significant portion of its locomotive fleet, concentrating on fuel efficiency and emissions reduction via advanced engine upgrades.
  • In October, 2024, Hyundai Rotem announced plans for a new manufacturing facility in North Africa as part of a contract to supply 48 electric trains, supporting localized industrial growth.

Dive into Technavio’s robust research methodology, blending expert interviews, extensive data synthesis, and validated models for unparalleled Rolling Stock Market insights. See full methodology.

Market Scope
Page number 291
Base year 2025
Historic period 2020-2024
Forecast period 2026-2030
Growth momentum & CAGR Accelerate at a CAGR of 4%
Market growth 2026-2030 USD 12742.9 million
Market structure Fragmented
YoY growth 2025-2026(%) 3.7%
Key countries China, Japan, India, Singapore, Australia, Malaysia, Germany, France, UK, Italy, Spain, Poland, US, Canada, Mexico, Brazil, Argentina, Chile, Saudi Arabia, UAE, South Africa, Egypt and Qatar
Competitive landscape Leading Companies, Market Positioning of Companies, Competitive Strategies, and Industry Risks

Request Free Sample

Research Analyst Overview

  • The rolling stock market is defined by a fundamental shift toward digitally integrated and sustainable rail mobility. This evolution compels manufacturers to innovate beyond traditional engineering, embedding predictive maintenance algorithms and digital twin technology into their core offerings.
  • The industry's trajectory is heavily influenced by the need to modernize global fleets with high-horsepower locomotives and specialized multiple units that meet stringent environmental and operational standards. A key boardroom consideration is the strategic allocation of capital toward electric traction systems and zero-emission propulsion technologies like hydrogen fuel cell trains and battery-hybrid technology.
  • Investing in digital asset management and advanced control systems is no longer optional but essential for maintaining a competitive edge. For instance, modern electric multiple units with regenerative braking systems can recover up to 30% of their energy, directly impacting operational costs.
  • The market for locomotives, passenger coaches, and freight wagons is driven by advancements such as automated train coupling and onboard telematics. Success hinges on delivering smart rail mobility through solutions like 5G enabled connectivity, IoT sensor integration, and remote vehicle diagnostics, which collectively enhance railcar fleet management and support heavy-haul operations.

What are the Key Data Covered in this Rolling Stock Market Research and Growth Report?

  • What is the expected growth of the Rolling Stock Market between 2026 and 2030?

    • USD 12.74 billion, at a CAGR of 4%

  • What segmentation does the market report cover?

    • The report is segmented by Application (Rail freight, and Rail passenger), Type (Diesel, Electric, and Electro-diesel), Product (Locomotive, Rapid transit vehicle, and Wagon) and Geography (APAC, Europe, North America, South America, Middle East and Africa)

  • Which regions are analyzed in the report?

    • APAC, Europe, North America, South America and Middle East and Africa

  • What are the key growth drivers and market challenges?

    • Strategic acceleration of railway electrification and decarbonization, Elevated capital intensity and financial viability constraints

  • Who are the major players in the Rolling Stock Market?

    • ALSTOM SA, CAF, Caterpillar Inc., Central Japan Railway Co., CRRC Corp. Ltd., Hitachi Ltd., Hyundai Motor Co., IHI Corp., Kawasaki Heavy Industries Ltd., MAPNA Group Co., PATENTES TALGO S.L.U., Pesa Group, PPF Group, Siemens AG, Stadler Rail Ag, Tatravagonka a.s. Poprad, The Greenbrier Companies Inc., The Kinki Sharyo Co. Ltd., Trinity Industries Inc. and Wabtec Corp.

Market Research Insights

  • Market dynamics are shaped by a strategic push toward sustainable transport solutions, fueling investments in mass transit expansion and the modernization of freight networks. This pivot emphasizes reducing the total cost of ownership and improving operational performance through technological integration.
  • For instance, the deployment of intelligent signaling systems has been shown to increase network capacity by up to 25%, while locomotive fleet modernization programs have achieved fuel consumption reductions of approximately 15%. Operators are navigating challenges such as capital investment intensity and supply chain volatility while capitalizing on opportunities in green rail initiatives.
  • The focus on turnkey transportation solutions and enhancing the overall railway value chain underscores the industry's commitment to efficiency and long-term financial viability amid evolving global transport decarbonization goals.

We can help! Our analysts can customize this rolling stock market research report to meet your requirements.

Get in touch

1. Executive Summary

1.1 Market overview

Executive Summary - Chart on Market Overview
Executive Summary - Data Table on Market Overview
Executive Summary - Chart on Global Market Characteristics
Executive Summary - Chart on Market by Geography
Executive Summary - Chart on Market Segmentation by Application
Executive Summary - Chart on Market Segmentation by Type
Executive Summary - Chart on Market Segmentation by Product
Executive Summary - Chart on Incremental Growth
Executive Summary - Data Table on Incremental Growth
Executive Summary - Chart on Company Market Positioning

2. Technavio Analysis

2.1 Analysis of price sensitivity, lifecycle, customer purchase basket, adoption rates, and purchase criteria

2.2 Criticality of inputs and Factors of differentiation

Chart on Overview on criticality of inputs and factors of differentiation

2.3 Factors of disruption

Chart on Overview on factors of disruption

2.4 Impact of drivers and challenges

Chart on Impact of drivers and challenges in 2025 and 2030

3. Market Landscape

3.1 Market ecosystem

Chart on Parent Market
Data Table on - Parent Market

3.2 Market characteristics

Chart on Market characteristics analysis

3.3 Value chain analysis

Chart on Value chain analysis

4. Market Sizing

4.1 Market definition

Data Table on Offerings of companies included in the market definition

4.2 Market segment analysis

Market segments

4.3 Market size 2025

4.4 Market outlook: Forecast for 2025-2030

Chart on Global - Market size and forecast 2025-2030 ($ million)
Data Table on Global - Market size and forecast 2025-2030 ($ million)
Chart on Global Market: Year-over-year growth 2025-2030 (%)
Data Table on Global Market: Year-over-year growth 2025-2030 (%)

5. Historic Market Size

5.1 Global Rolling Stock Market 2020 - 2024

Historic Market Size - Data Table on Global Rolling Stock Market 2020 - 2024 ($ million)

5.2 Application segment analysis 2020 - 2024

Historic Market Size - Application Segment 2020 - 2024 ($ million)

5.3 Type segment analysis 2020 - 2024

Historic Market Size - Type Segment 2020 - 2024 ($ million)

5.4 Product segment analysis 2020 - 2024

Historic Market Size - Product Segment 2020 - 2024 ($ million)

5.5 Geography segment analysis 2020 - 2024

Historic Market Size - Geography Segment 2020 - 2024 ($ million)

5.6 Country segment analysis 2020 - 2024

Historic Market Size - Country Segment 2020 - 2024 ($ million)

6. Qualitative Analysis

6.1 Impact of AI on Global Rolling Stock Market

6.2 Impact of Geopolitical Conflicts on Global Rolling Stock Market

7. Five Forces Analysis

7.1 Five forces summary

Five forces analysis - Comparison between 2025 and 2030

7.2 Bargaining power of buyers

Bargaining power of buyers - Impact of key factors 2025 and 2030

7.3 Bargaining power of suppliers

Bargaining power of suppliers - Impact of key factors in 2025 and 2030

7.4 Threat of new entrants

Threat of new entrants - Impact of key factors in 2025 and 2030

7.5 Threat of substitutes

Threat of substitutes - Impact of key factors in 2025 and 2030

7.6 Threat of rivalry

Threat of rivalry - Impact of key factors in 2025 and 2030

7.7 Market condition

Chart on Market condition - Five forces 2025 and 2030

8. Market Segmentation by Application

8.1 Market segments

Chart on Application - Market share 2025-2030 (%)
Data Table on Application - Market share 2025-2030 (%)

8.2 Comparison by Application

Chart on Comparison by Application
Data Table on Comparison by Application

8.3 Rail freight - Market size and forecast 2025-2030

Chart on Rail freight - Market size and forecast 2025-2030 ($ million)
Data Table on Rail freight - Market size and forecast 2025-2030 ($ million)
Chart on Rail freight - Year-over-year growth 2025-2030 (%)
Data Table on Rail freight - Year-over-year growth 2025-2030 (%)

8.4 Rail passenger - Market size and forecast 2025-2030

Chart on Rail passenger - Market size and forecast 2025-2030 ($ million)
Data Table on Rail passenger - Market size and forecast 2025-2030 ($ million)
Chart on Rail passenger - Year-over-year growth 2025-2030 (%)
Data Table on Rail passenger - Year-over-year growth 2025-2030 (%)

8.5 Market opportunity by Application

Market opportunity by Application ($ million)
Data Table on Market opportunity by Application ($ million)

9. Market Segmentation by Type

9.1 Market segments

Chart on Type - Market share 2025-2030 (%)
Data Table on Type - Market share 2025-2030 (%)

9.2 Comparison by Type

Chart on Comparison by Type
Data Table on Comparison by Type

9.3 Diesel - Market size and forecast 2025-2030

Chart on Diesel - Market size and forecast 2025-2030 ($ million)
Data Table on Diesel - Market size and forecast 2025-2030 ($ million)
Chart on Diesel - Year-over-year growth 2025-2030 (%)
Data Table on Diesel - Year-over-year growth 2025-2030 (%)

9.4 Electric - Market size and forecast 2025-2030

Chart on Electric - Market size and forecast 2025-2030 ($ million)
Data Table on Electric - Market size and forecast 2025-2030 ($ million)
Chart on Electric - Year-over-year growth 2025-2030 (%)
Data Table on Electric - Year-over-year growth 2025-2030 (%)

9.5 Electro-diesel - Market size and forecast 2025-2030

Chart on Electro-diesel - Market size and forecast 2025-2030 ($ million)
Data Table on Electro-diesel - Market size and forecast 2025-2030 ($ million)
Chart on Electro-diesel - Year-over-year growth 2025-2030 (%)
Data Table on Electro-diesel - Year-over-year growth 2025-2030 (%)

9.6 Market opportunity by Type

Market opportunity by Type ($ million)
Data Table on Market opportunity by Type ($ million)

10. Market Segmentation by Product

10.1 Market segments

Chart on Product - Market share 2025-2030 (%)
Data Table on Product - Market share 2025-2030 (%)

10.2 Comparison by Product

Chart on Comparison by Product
Data Table on Comparison by Product

10.3 Locomotive - Market size and forecast 2025-2030

Chart on Locomotive - Market size and forecast 2025-2030 ($ million)
Data Table on Locomotive - Market size and forecast 2025-2030 ($ million)
Chart on Locomotive - Year-over-year growth 2025-2030 (%)
Data Table on Locomotive - Year-over-year growth 2025-2030 (%)

10.4 Rapid transit vehicle - Market size and forecast 2025-2030

Chart on Rapid transit vehicle - Market size and forecast 2025-2030 ($ million)
Data Table on Rapid transit vehicle - Market size and forecast 2025-2030 ($ million)
Chart on Rapid transit vehicle - Year-over-year growth 2025-2030 (%)
Data Table on Rapid transit vehicle - Year-over-year growth 2025-2030 (%)

10.5 Wagon - Market size and forecast 2025-2030

Chart on Wagon - Market size and forecast 2025-2030 ($ million)
Data Table on Wagon - Market size and forecast 2025-2030 ($ million)
Chart on Wagon - Year-over-year growth 2025-2030 (%)
Data Table on Wagon - Year-over-year growth 2025-2030 (%)

10.6 Market opportunity by Product

Market opportunity by Product ($ million)
Data Table on Market opportunity by Product ($ million)

11. Customer Landscape

11.1 Customer landscape overview

Analysis of price sensitivity, lifecycle, customer purchase basket, adoption rates, and purchase criteria

12. Geographic Landscape

12.1 Geographic segmentation

Chart on Market share by geography 2025-2030 (%)
Data Table on Market share by geography 2025-2030 (%)

12.2 Geographic comparison

Chart on Geographic comparison
Data Table on Geographic comparison

12.3 APAC - Market size and forecast 2025-2030

Chart on APAC - Market size and forecast 2025-2030 ($ million)
Data Table on APAC - Market size and forecast 2025-2030 ($ million)
Chart on APAC - Year-over-year growth 2025-2030 (%)
Data Table on APAC - Year-over-year growth 2025-2030 (%)
Chart on Regional Comparison - APAC
Data Table on Regional Comparison - APAC

12.3.1 China - Market size and forecast 2025-2030

Chart on China - Market size and forecast 2025-2030 ($ million)
Data Table on China - Market size and forecast 2025-2030 ($ million)
Chart on China - Year-over-year growth 2025-2030 (%)
Data Table on China - Year-over-year growth 2025-2030 (%)

12.3.2 Japan - Market size and forecast 2025-2030

Chart on Japan - Market size and forecast 2025-2030 ($ million)
Data Table on Japan - Market size and forecast 2025-2030 ($ million)
Chart on Japan - Year-over-year growth 2025-2030 (%)
Data Table on Japan - Year-over-year growth 2025-2030 (%)

12.3.3 India - Market size and forecast 2025-2030

Chart on India - Market size and forecast 2025-2030 ($ million)
Data Table on India - Market size and forecast 2025-2030 ($ million)
Chart on India - Year-over-year growth 2025-2030 (%)
Data Table on India - Year-over-year growth 2025-2030 (%)

12.3.4 Singapore - Market size and forecast 2025-2030

Chart on Singapore - Market size and forecast 2025-2030 ($ million)
Data Table on Singapore - Market size and forecast 2025-2030 ($ million)
Chart on Singapore - Year-over-year growth 2025-2030 (%)
Data Table on Singapore - Year-over-year growth 2025-2030 (%)

12.3.5 Australia - Market size and forecast 2025-2030

Chart on Australia - Market size and forecast 2025-2030 ($ million)
Data Table on Australia - Market size and forecast 2025-2030 ($ million)
Chart on Australia - Year-over-year growth 2025-2030 (%)
Data Table on Australia - Year-over-year growth 2025-2030 (%)

12.3.6 Malaysia - Market size and forecast 2025-2030

Chart on Malaysia - Market size and forecast 2025-2030 ($ million)
Data Table on Malaysia - Market size and forecast 2025-2030 ($ million)
Chart on Malaysia - Year-over-year growth 2025-2030 (%)
Data Table on Malaysia - Year-over-year growth 2025-2030 (%)

12.4 Europe - Market size and forecast 2025-2030

Chart on Europe - Market size and forecast 2025-2030 ($ million)
Data Table on Europe - Market size and forecast 2025-2030 ($ million)
Chart on Europe - Year-over-year growth 2025-2030 (%)
Data Table on Europe - Year-over-year growth 2025-2030 (%)
Chart on Regional Comparison - Europe
Data Table on Regional Comparison - Europe

12.4.1 Germany - Market size and forecast 2025-2030

Chart on Germany - Market size and forecast 2025-2030 ($ million)
Data Table on Germany - Market size and forecast 2025-2030 ($ million)
Chart on Germany - Year-over-year growth 2025-2030 (%)
Data Table on Germany - Year-over-year growth 2025-2030 (%)

12.4.2 France - Market size and forecast 2025-2030

Chart on France - Market size and forecast 2025-2030 ($ million)
Data Table on France - Market size and forecast 2025-2030 ($ million)
Chart on France - Year-over-year growth 2025-2030 (%)
Data Table on France - Year-over-year growth 2025-2030 (%)

12.4.3 UK - Market size and forecast 2025-2030

Chart on UK - Market size and forecast 2025-2030 ($ million)
Data Table on UK - Market size and forecast 2025-2030 ($ million)
Chart on UK - Year-over-year growth 2025-2030 (%)
Data Table on UK - Year-over-year growth 2025-2030 (%)

12.4.4 Italy - Market size and forecast 2025-2030

Chart on Italy - Market size and forecast 2025-2030 ($ million)
Data Table on Italy - Market size and forecast 2025-2030 ($ million)
Chart on Italy - Year-over-year growth 2025-2030 (%)
Data Table on Italy - Year-over-year growth 2025-2030 (%)

12.4.5 Spain - Market size and forecast 2025-2030

Chart on Spain - Market size and forecast 2025-2030 ($ million)
Data Table on Spain - Market size and forecast 2025-2030 ($ million)
Chart on Spain - Year-over-year growth 2025-2030 (%)
Data Table on Spain - Year-over-year growth 2025-2030 (%)

12.4.6 Poland - Market size and forecast 2025-2030

Chart on Poland - Market size and forecast 2025-2030 ($ million)
Data Table on Poland - Market size and forecast 2025-2030 ($ million)
Chart on Poland - Year-over-year growth 2025-2030 (%)
Data Table on Poland - Year-over-year growth 2025-2030 (%)

12.5 North America - Market size and forecast 2025-2030

Chart on North America - Market size and forecast 2025-2030 ($ million)
Data Table on North America - Market size and forecast 2025-2030 ($ million)
Chart on North America - Year-over-year growth 2025-2030 (%)
Data Table on North America - Year-over-year growth 2025-2030 (%)
Chart on Regional Comparison - North America
Data Table on Regional Comparison - North America

12.5.1 US - Market size and forecast 2025-2030

Chart on US - Market size and forecast 2025-2030 ($ million)
Data Table on US - Market size and forecast 2025-2030 ($ million)
Chart on US - Year-over-year growth 2025-2030 (%)
Data Table on US - Year-over-year growth 2025-2030 (%)

12.5.2 Canada - Market size and forecast 2025-2030

Chart on Canada - Market size and forecast 2025-2030 ($ million)
Data Table on Canada - Market size and forecast 2025-2030 ($ million)
Chart on Canada - Year-over-year growth 2025-2030 (%)
Data Table on Canada - Year-over-year growth 2025-2030 (%)

12.5.3 Mexico - Market size and forecast 2025-2030

Chart on Mexico - Market size and forecast 2025-2030 ($ million)
Data Table on Mexico - Market size and forecast 2025-2030 ($ million)
Chart on Mexico - Year-over-year growth 2025-2030 (%)
Data Table on Mexico - Year-over-year growth 2025-2030 (%)

12.6 South America - Market size and forecast 2025-2030

Chart on South America - Market size and forecast 2025-2030 ($ million)
Data Table on South America - Market size and forecast 2025-2030 ($ million)
Chart on South America - Year-over-year growth 2025-2030 (%)
Data Table on South America - Year-over-year growth 2025-2030 (%)
Chart on Regional Comparison - South America
Data Table on Regional Comparison - South America

12.6.1 Brazil - Market size and forecast 2025-2030

Chart on Brazil - Market size and forecast 2025-2030 ($ million)
Data Table on Brazil - Market size and forecast 2025-2030 ($ million)
Chart on Brazil - Year-over-year growth 2025-2030 (%)
Data Table on Brazil - Year-over-year growth 2025-2030 (%)

12.6.2 Argentina - Market size and forecast 2025-2030

Chart on Argentina - Market size and forecast 2025-2030 ($ million)
Data Table on Argentina - Market size and forecast 2025-2030 ($ million)
Chart on Argentina - Year-over-year growth 2025-2030 (%)
Data Table on Argentina - Year-over-year growth 2025-2030 (%)

12.6.3 Chile - Market size and forecast 2025-2030

Chart on Chile - Market size and forecast 2025-2030 ($ million)
Data Table on Chile - Market size and forecast 2025-2030 ($ million)
Chart on Chile - Year-over-year growth 2025-2030 (%)
Data Table on Chile - Year-over-year growth 2025-2030 (%)

12.7 Middle East and Africa - Market size and forecast 2025-2030

Chart on Middle East and Africa - Market size and forecast 2025-2030 ($ million)
Data Table on Middle East and Africa - Market size and forecast 2025-2030 ($ million)
Chart on Middle East and Africa - Year-over-year growth 2025-2030 (%)
Data Table on Middle East and Africa - Year-over-year growth 2025-2030 (%)
Chart on Regional Comparison - Middle East and Africa
Data Table on Regional Comparison - Middle East and Africa

12.7.1 Saudi Arabia - Market size and forecast 2025-2030

Chart on Saudi Arabia - Market size and forecast 2025-2030 ($ million)
Data Table on Saudi Arabia - Market size and forecast 2025-2030 ($ million)
Chart on Saudi Arabia - Year-over-year growth 2025-2030 (%)
Data Table on Saudi Arabia - Year-over-year growth 2025-2030 (%)

12.7.2 UAE - Market size and forecast 2025-2030

Chart on UAE - Market size and forecast 2025-2030 ($ million)
Data Table on UAE - Market size and forecast 2025-2030 ($ million)
Chart on UAE - Year-over-year growth 2025-2030 (%)
Data Table on UAE - Year-over-year growth 2025-2030 (%)

12.7.3 South Africa - Market size and forecast 2025-2030

Chart on South Africa - Market size and forecast 2025-2030 ($ million)
Data Table on South Africa - Market size and forecast 2025-2030 ($ million)
Chart on South Africa - Year-over-year growth 2025-2030 (%)
Data Table on South Africa - Year-over-year growth 2025-2030 (%)

12.7.4 Egypt - Market size and forecast 2025-2030

Chart on Egypt - Market size and forecast 2025-2030 ($ million)
Data Table on Egypt - Market size and forecast 2025-2030 ($ million)
Chart on Egypt - Year-over-year growth 2025-2030 (%)
Data Table on Egypt - Year-over-year growth 2025-2030 (%)

12.7.5 Qatar - Market size and forecast 2025-2030

Chart on Qatar - Market size and forecast 2025-2030 ($ million)
Data Table on Qatar - Market size and forecast 2025-2030 ($ million)
Chart on Qatar - Year-over-year growth 2025-2030 (%)
Data Table on Qatar - Year-over-year growth 2025-2030 (%)

12.8 Market opportunity by geography

Market opportunity by geography ($ million)
Data Tables on Market opportunity by geography ($ million)

13. Drivers, Challenges, and Opportunity

13.1 Market drivers

Strategic acceleration of railway electrification and decarbonization
Intensifying urbanization and mass transit infrastructure expansion
Technological integration of autonomous operations and digital signaling

13.2 Market challenges

Elevated capital intensity and financial viability constraints
Structural supply chain volatility and production bottlenecks
Regulatory fragmentation and technical harmonization obstacles

13.3 Impact of drivers and challenges

Impact of drivers and challenges in 2025 and 2030

13.4 Market opportunities

Digital transformation through digital twins and predictive maintenance
Expansion of alternative propulsion and zero-emission technologies
Advancement toward full autonomy and intelligent rail systems

14. Competitive Landscape

14.1 Overview

14.2

Overview on criticality of inputs and factors of differentiation

14.3 Landscape disruption

Overview on factors of disruption

14.4 Industry risks

Impact of key risks on business

15. Competitive Analysis

15.1 Companies profiled

Companies covered

15.2 Company ranking index

15.3 Market positioning of companies

Matrix on companies position and classification

15.4 ALSTOM SA

ALSTOM SA - Overview
ALSTOM SA - Business segments
ALSTOM SA - Key offerings
ALSTOM SA - Segment focus
SWOT

15.5 CAF

CAF - Overview
CAF - Product / Service
CAF - Key offerings
SWOT

15.6 Caterpillar Inc.

Caterpillar Inc. - Overview
Caterpillar Inc. - Business segments
Caterpillar Inc. - Key news
Caterpillar Inc. - Key offerings
Caterpillar Inc. - Segment focus
SWOT

15.7 Central Japan Railway Co.

Central Japan Railway Co. - Overview
Central Japan Railway Co. - Product / Service
Central Japan Railway Co. - Key offerings
SWOT

15.8 CRRC Corp. Ltd.

CRRC Corp. Ltd. - Overview
CRRC Corp. Ltd. - Product / Service
CRRC Corp. Ltd. - Key offerings
SWOT

15.9 Hitachi Ltd.

Hitachi Ltd. - Overview
Hitachi Ltd. - Business segments
Hitachi Ltd. - Key offerings
Hitachi Ltd. - Segment focus
SWOT

15.10 Hyundai Motor Co.

Hyundai Motor Co. - Overview
Hyundai Motor Co. - Business segments
Hyundai Motor Co. - Key offerings
Hyundai Motor Co. - Segment focus
SWOT

15.11 IHI Corp.

IHI Corp. - Overview
IHI Corp. - Business segments
IHI Corp. - Key offerings
IHI Corp. - Segment focus
SWOT

15.12 Kawasaki Heavy Industries Ltd.

Kawasaki Heavy Industries Ltd. - Overview
Kawasaki Heavy Industries Ltd. - Business segments
Kawasaki Heavy Industries Ltd. - Key news
Kawasaki Heavy Industries Ltd. - Key offerings
Kawasaki Heavy Industries Ltd. - Segment focus
SWOT

15.13 MAPNA Group Co.

MAPNA Group Co. - Overview
MAPNA Group Co. - Product / Service
MAPNA Group Co. - Key offerings
SWOT

15.14 PPF Group

PPF Group - Overview
PPF Group - Product / Service
PPF Group - Key offerings
SWOT

15.15 Siemens AG

Siemens AG - Overview
Siemens AG - Business segments
Siemens AG - Key news
Siemens AG - Key offerings
Siemens AG - Segment focus
SWOT

15.16 The Kinki Sharyo Co. Ltd.

The Kinki Sharyo Co. Ltd. - Overview
The Kinki Sharyo Co. Ltd. - Product / Service
The Kinki Sharyo Co. Ltd. - Key offerings
SWOT

15.17 Trinity Industries Inc.

Trinity Industries Inc. - Overview
Trinity Industries Inc. - Business segments
Trinity Industries Inc. - Key offerings
Trinity Industries Inc. - Segment focus
SWOT

15.18 Wabtec Corp.

Wabtec Corp. - Overview
Wabtec Corp. - Business segments
Wabtec Corp. - Key offerings
Wabtec Corp. - Segment focus
SWOT

16. Appendix

16.1 Scope of the report

Market definition
Objectives
Notes and caveats

16.2 Inclusions and exclusions checklist

Inclusions checklist
Exclusions checklist

16.3 Currency conversion rates for US$

16.4 Research methodology

16.5 Data procurement

Information sources

16.6 Data validation

16.7 Validation techniques employed for market sizing

16.8 Data synthesis

16.9 360 degree market analysis

16.10 List of abbreviations

Research Methodology

Technavio presents a detailed picture of the market by way of study, synthesis, and summation of data from multiple sources. The analysts have presented the various facets of the market with a particular focus on identifying the key industry influencers. The data thus presented is comprehensive, reliable, and the result of extensive research, both primary and secondary.

INFORMATION SOURCES

Primary sources

  • Manufacturers and suppliers
  • Channel partners
  • Industry experts
  • Strategic decision makers

Secondary sources

  • Industry journals and periodicals
  • Government data
  • Financial reports of key industry players
  • Historical data
  • Press releases

DATA ANALYSIS

Data Synthesis

  • Collation of data
  • Estimation of key figures
  • Analysis of derived insights

Data Validation

  • Triangulation with data models
  • Reference against proprietary databases
  • Corroboration with industry experts

REPORT WRITING

Qualitative

  • Market drivers
  • Market challenges
  • Market trends
  • Five forces analysis

Quantitative

  • Market size and forecast
  • Market segmentation
  • Geographical insights
  • Competitive landscape

Interested in this report?

Get your sample now to see our research methodology and insights!

Download Now

Frequently Asked Questions

Rolling Stock market growth will increase by USD 12742.9 million during 2026-2030.

The Rolling Stock market is expected to grow at a CAGR of 4% during 2026-2030.

Rolling Stock market is segmented by Application (Rail freight, Rail passenger) Type (Diesel, Electric, Electro-diesel) Product (Locomotive, Rapid transit vehicle, Wagon)

ALSTOM SA, CAF, Caterpillar Inc., Central Japan Railway Co., CRRC Corp. Ltd., Hitachi Ltd., Hyundai Motor Co., IHI Corp., Kawasaki Heavy Industries Ltd., MAPNA Group Co., PATENTES TALGO S.L.U., Pesa Group, PPF Group, Siemens AG, Stadler Rail Ag, Tatravagonka a.s. Poprad, The Greenbrier Companies Inc., The Kinki Sharyo Co. Ltd., Trinity Industries Inc., Wabtec Corp. are a few of the key vendors in the Rolling Stock market.

APAC will register the highest growth rate of 47.7% among the other regions. Therefore, the Rolling Stock market in APAC is expected to garner significant business opportunities for the vendors during the forecast period.

China, Japan, India, Singapore, Australia, Malaysia, Germany, France, UK, Italy, Spain, Poland, US, Canada, Mexico, Brazil, Argentina, Chile, Saudi Arabia, UAE, South Africa, Egypt, Qatar

  • Strategic acceleration of railway electrification and decarbonization is the driving factor this market.

The Rolling Stock market vendors should focus on grabbing business opportunities from the Application segment as it accounted for the largest market share in the base year.
RIA - Research AI Assistant
Ask RIA