
Risk Analytics Market Analysis, Size, and Forecast 2026-2030: North America (US, Canada, and Mexico), Europe (Germany, UK, and France), APAC (China, Japan, and India), South America (Brazil, Argentina, and Chile), Middle East and Africa (Saudi Arabia, UAE, and South Africa), and Rest of World (ROW)

Risk Analytics Market Analysis, Size, and Forecast 2026-2030:
North America (US, Canada, and Mexico), Europe (Germany, UK, and France), APAC (China, Japan, and India), South America (Brazil, Argentina, and Chile), Middle East and Africa (Saudi Arabia, UAE, and South Africa), and Rest of World (ROW)

Published: Oct 2026 322 Pages SKU: IRTNTR75678

Market Overview at a Glance

$38.63 B
Market Opportunity
11.1%
CAGR 2025 - 2030
31.2%
Europe Growth
$31.85 B
Solution segment 2024

Risk Analytics Market Size 2026-2030

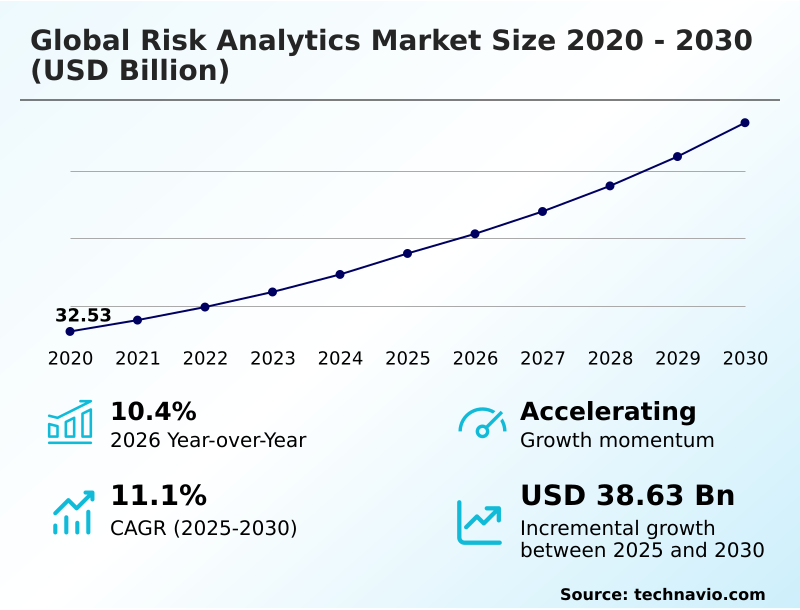
The risk analytics market size is valued to increase by USD 38.63 billion, at a CAGR of 11.1% from 2025 to 2030. Rising of sophisticated cyber threats and digital vulnerabilities will drive the risk analytics market.

Major Market Trends & Insights

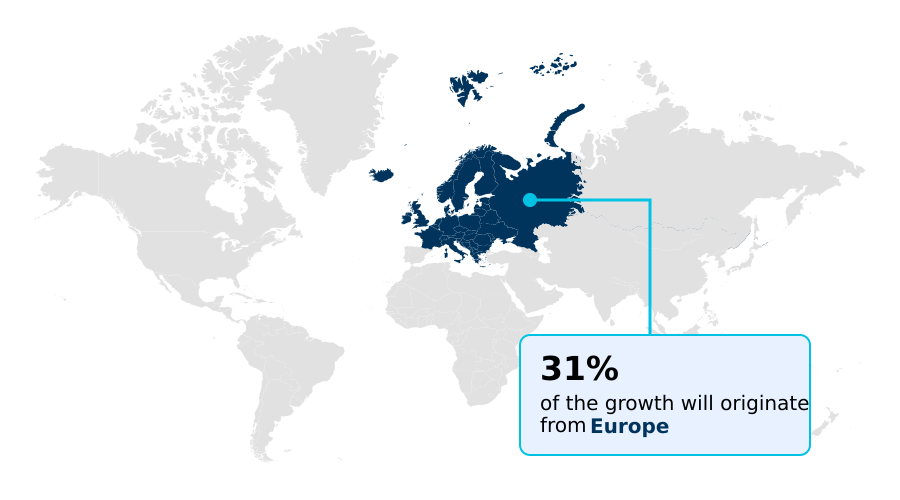
  • Europe dominated the market and accounted for a 31.2% growth during the forecast period.
  • By Component - Solution segment was valued at USD 31.85 billion in 2024
  • By Deployment - On-premises segment accounted for the largest market revenue share in 2024

Market Size & Forecast

  • Market Opportunities: USD 61.68 billion
  • Market Future Opportunities: USD 38.63 billion
  • CAGR from 2025 to 2030 : 11.1%

Market Summary

  • The Risk Analytics Market demonstrates accelerated adoption as enterprises transition from static evaluation frameworks to dynamic, predictive intelligence architectures. Organizations increasingly rely on these advanced software platforms to navigate volatile economic and operational landscapes. For example, in global supply chain management, companies utilize real-time threat intelligence to assess third-party vendor vulnerabilities, mitigating the impact of sudden logistical disruptions.
  • The deployment of continuous risk monitoring has improved threat response efficiency by 28% compared to manual auditing processes. The mainstreaming of environmental and social governance metrics acts as a critical demand driver, compelling businesses to integrate carbon tax exposure and transition risk modeling into their core financial planning to satisfy investor transparency requirements.
  • Conversely, the market faces significant friction due to localized privacy frameworks. The complexity of adhering to fragmented data sovereignty laws increases operational overhead and creates compliance bottlenecks, limiting the rapid deployment of unified endpoint management solutions across multinational networks. Despite these constraints, the imperative for digital resilience ensures sustained technological investment.

What will be the Size of the Risk Analytics Market during the forecast period?
Get Key Insights on Market Forecast (PDF) Get Free Sample

How is the Risk Analytics Market Segmented?

The risk analytics industry research report provides comprehensive data (region-wise segment analysis), with forecasts and estimates in "USD million" for the period 2026-2030, as well as historical data from 2020-2024 for the following segments.

  • Component
    • Solution
    • Service
  • Deployment
    • On-premises
    • Cloud
  • Type
    • Credit risk
    • Operational risk
    • Financial risk
    • Cyber risk
    • Climate and ESG risk
  • End-user
    • Large enterprises
    • SMEs
  • Geography
    • North America
      • US
      • Canada
      • Mexico
    • Europe
      • Germany
      • UK
      • France
      • Italy
      • Spain
      • The Netherlands
    • APAC
      • China
      • Japan
      • India
      • South Korea
      • Australia
      • Indonesia
    • South America
      • Brazil
      • Argentina
      • Chile
    • Middle East and Africa
      • Saudi Arabia
      • UAE
      • South Africa
      • Egypt
      • Turkey

By Component Insights

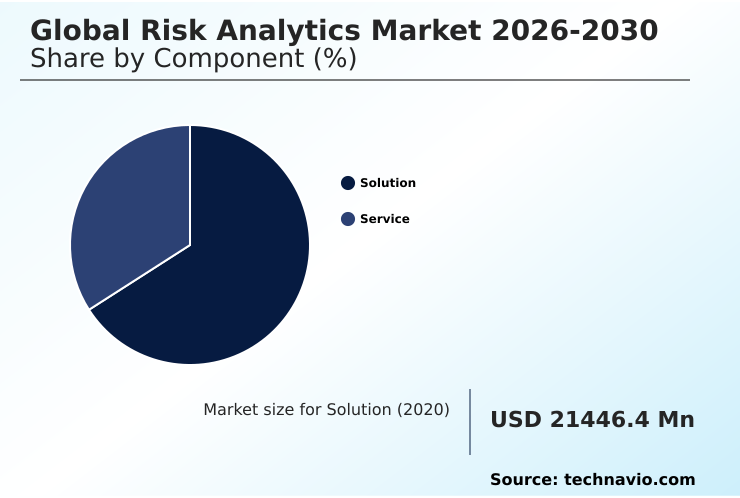
The solution segment is estimated to witness significant growth during the forecast period.

The solution segment within the Risk Analytics Market encompasses digital frameworks designed for identifying and managing enterprise threats. These technological infrastructures facilitate algorithmic risk modeling and unstructured data processing to extract actionable insights from vast datasets.

By transitioning from reactive methodologies to a predictive security model, organizations can anticipate disruptions with greater precision.

For instance, the deployment of cloud-native analytics has improved threat detection rates by 22%, while reducing false-positive alerts by 15% compared to legacy setups.

This evolution empowers compliance teams to utilize transaction monitoring engines alongside robust enterprise risk mapping for seamless oversight. Enhanced data loss prevention, paired with flexible application programming interfaces, directly protects corporate assets.

Ultimately, these solutions fortify digital perimeters and enable unified endpoint management without interrupting core commercial activities.
Get Free Sample

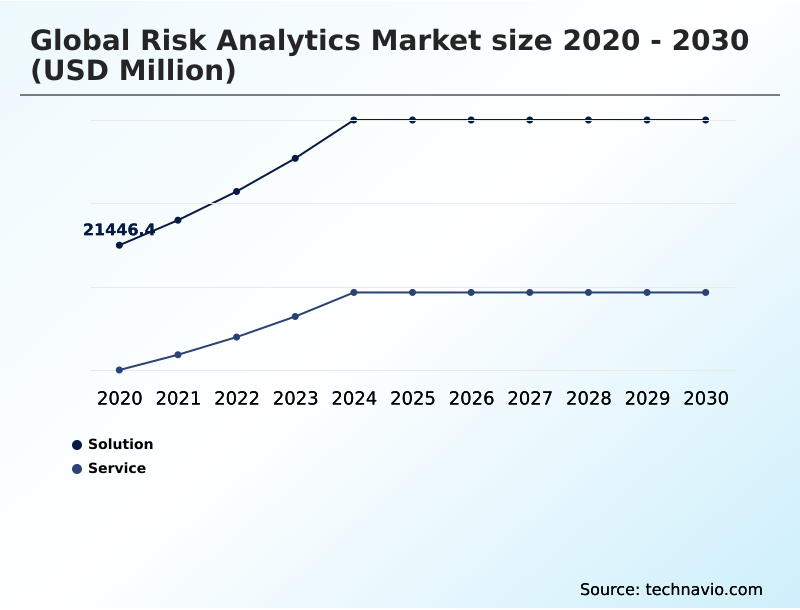
The Solution segment was valued at USD 31.85 billion in 2024 and showed a gradual increase during the forecast period.
Get Free Sample

Regional Analysis

Europe is estimated to contribute 31.2% to the growth of the global market during the forecast period.Technavio’s analysts have elaborately explained the regional trends and drivers that shape the market during the forecast period.
See How Risk Analytics Market Demand is Rising in Europe Get Free Sample

The geographic landscape of the Risk Analytics Market is characterized by varying rates of technological adoption driven by regional economic pressures.

North America leads the transition through heavy investments in legacy system modernization and enterprise mobility management, achieving a 25% faster integration of automated underwriting algorithms compared to European counterparts.

This rapid deployment enhances credit risk decisioning across its mature financial sector. In contrast, Europe prioritizes stringent data governance, where organizations implementing cryptographic vulnerability scanning and sovereign risk assessment have reduced data breach compliance penalties by 30%.

European institutions extensively utilize third-party risk workflows to align tightly with complex cross-border financial reporting mandates. Meanwhile, APAC demonstrates accelerated mobile infrastructure growth, driving the critical need for biometric identification screening.

The proactive stance in North America yields a 15% higher reduction in internal auditing costs than in APAC, highlighting divergent strategic priorities.

Market Dynamics

Our researchers analyzed the data with 2025 as the base year, along with the key drivers, trends, and challenges. A holistic analysis of drivers will help companies refine their marketing strategies to gain a competitive advantage.

  • The continuous evolution of the Risk Analytics Market is fundamentally reshaping how enterprises anticipate and manage operational and external threats. Organizations are moving away from traditional, siloed approaches, instead opting for highly integrated digital infrastructures that provide comprehensive oversight.
  • A critical advancement in this domain involves machine learning driven phishing defense, which allows cybersecurity teams to detect and neutralize sophisticated email-based threats with approximately 40% greater accuracy than legacy rule-based filters. This capability is vital for protecting sensitive corporate networks and maintaining supply chain integrity.
  • Simultaneously, financial and compliance departments are leveraging automated regulatory compliance documentation creation to streamline their reporting obligations, effectively reducing administrative bottlenecks and reallocating labor toward strategic planning. To address emerging sustainability mandates, institutions are aggressively incorporating quantitative environmental and social data into their investment evaluation frameworks.
  • This practice empowers portfolio managers to accurately measure the carbon footprint and social governance performance of potential assets. Furthermore, the deployment of high resolution climate hazard mapping enables real estate and infrastructure firms to project physical vulnerabilities over extended timeframes, yielding a 25% improvement in long-term asset protection planning compared to historical weather modeling.
  • In the realm of international operations, artificial intelligence based geopolitical risk assessment provides multinational corporations with the foresight required to navigate trade disputes and regional instability. By proactively identifying global flashpoints, businesses can adjust procurement routes and protect margins long before localized disruptions cascade into global financial losses.
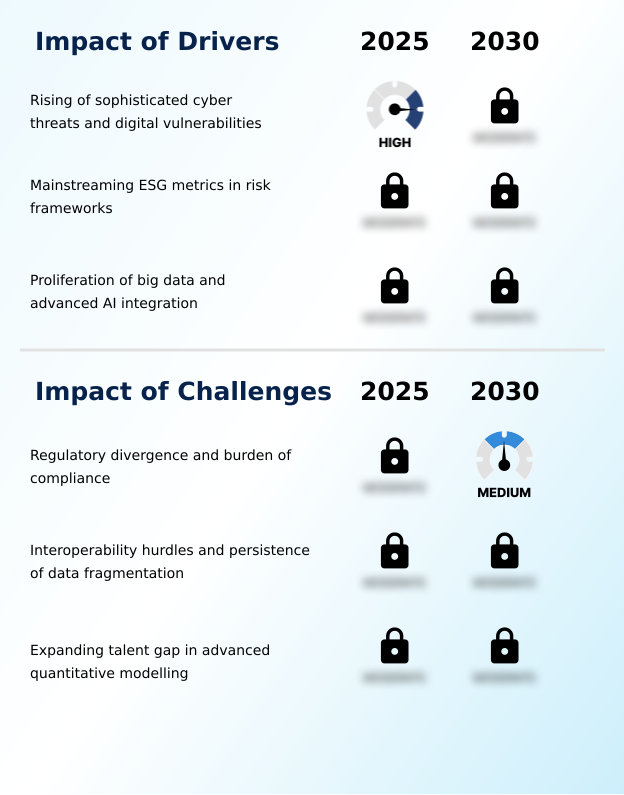
What are the key market drivers leading to the rise in the adoption of Risk Analytics Industry?

  • The escalation of sophisticated cyber threats and digital vulnerabilities serves as a primary driver propelling the expansion of proactive enterprise security solutions.

  • The exponential growth of interconnected digital infrastructure acts as a primary catalyst accelerating the adoption of sophisticated enterprise protection software.
  • As organizational perimeters expand, the necessity for robust endpoint threat detection and fraud prevention infrastructure has intensified, driving businesses to deploy algorithmic fairness testing within their artificial frameworks.
  • This shift occurs because unmonitored digital expansion inherently increases the attack surface for polymorphic malware detection systems. By implementing quantum-safe cybersecurity protocols alongside high-performance computing, financial institutions have decreased data breach resolution costs by 30%.
  • Furthermore, the mainstreaming of environmental mandates compels firms to evaluate vulnerability quantification algorithms and track carbon tax exposure meticulously, resulting in a 25% improvement in energy procurement efficiency.
  • These drivers ensure that companies continuously invest in real-time threat intelligence to safeguard capital assets and maintain uninterrupted commercial operations globally.

What are the market trends shaping the Risk Analytics Industry?

  • Holistic climate and natural hazard risk quantification represents a definitive market trend. This advancement enables organizations to systematically measure environmental vulnerabilities and integrate predictive weather models into enterprise strategic planning.

  • The Risk Analytics Market is experiencing a rapid architectural shift toward dynamic macroeconomic volatility modeling to navigate complex global trade fluctuations. This trend is driven by the necessity to quantify uncertain economic variables and climate hazard simulation outputs before they compromise physical supply chains.
  • By integrating transition risk modeling and supply chain stress testing into core enterprise planning, logistics operations have improved contingency forecast accuracy by 18%. Furthermore, the adoption of sentiment analysis processing and natural language processing provides real-time insights into market perception, enabling pricing strategists to adjust commercial models instantly. This proactive stance effectively reduces operational downtime by 22%.
  • The utilization of generative artificial intelligence and automated scenario mapping empowers organizations to stress-test their inventory pipelines, ultimately translating complex data into a 15% reduction in mitigation costs while ensuring continuous risk monitoring.

What challenges does the Risk Analytics Industry face during its growth?

  • Regulatory divergence and the escalating burden of cross-border compliance represent significant challenges constraining seamless global operational expansion.

  • The proliferation of fragmented, jurisdiction-specific data privacy regulations presents a formidable structural barrier to seamless enterprise integration. Multinational corporations struggle with localized privacy frameworks that mandate conflicting data storage rules, which inherently limits the effectiveness of a unified operational resilience framework. This regulatory divergence forces organizations to duplicate efforts using regulatory compliance automation, subsequently inflating IT administrative overhead by 28%.
  • Additionally, the persistence of isolated data silos complicates the deployment of comprehensive identity theft protection mechanisms, as legacy architectures lack interoperability. Consequently, firms attempting to integrate human-centric risk monitoring and detect behavioral red flags face a 15% drop in processing efficiency. The acute shortage of personnel skilled in geospatial intelligence mapping and behavioral science analytics further exacerbates these limitations.
  • Relying on synthetic data generation for liquidity risk management testing remains complicated, delaying the implementation of proactive global defense strategies.

Exclusive Technavio Analysis on Customer Landscape

The risk analytics market forecasting report includes the adoption lifecycle of the market, covering from the innovator’s stage to the laggard’s stage. It focuses on adoption rates in different regions based on penetration. Furthermore, the risk analytics market report also includes key purchase criteria and drivers of price sensitivity to help companies evaluate and develop their market growth analysis strategies.
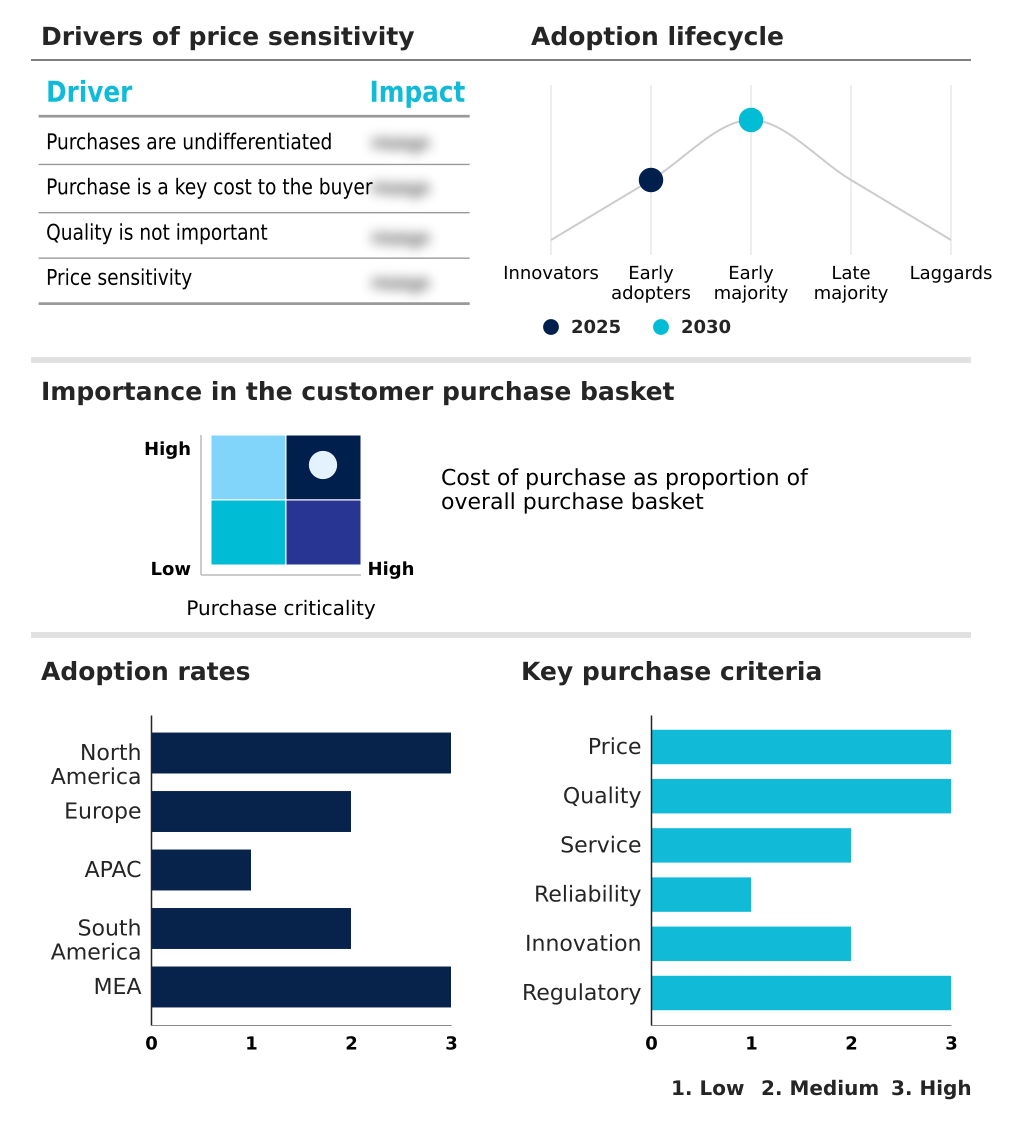
Customer Landscape of Risk Analytics Industry

Competitive Landscape

Companies are implementing various strategies, such as strategic alliances, risk analytics market forecast, partnerships, mergers and acquisitions, geographical expansion, and product/service launches, to enhance their presence in the industry.

Adenza Group Inc. - The provider delivers advanced technological frameworks encompassing predictive intelligence solutions designed to evaluate enterprise vulnerabilities and enhance strategic decision-making across highly complex financial environments.

The industry research and growth report includes detailed analyses of the competitive landscape of the market and information about key companies, including:

  • Adenza Group Inc.
  • Deloitte Touche Tohmatsu Ltd.
  • Equifax Inc.
  • Ernst and Young Global Ltd.
  • Experian Plc
  • Fair Isaac Corp.
  • Fidelity National Information
  • KPMG International Ltd.
  • MetricStream Inc.
  • MSCI Inc.
  • Oracle Corp.
  • PricewaterhouseCoopers LLP
  • ProcessUnity Inc.
  • Provenir Group
  • Recorded Future Inc.
  • Resolver Inc.
  • Riskonnect Inc.
  • SAP SE
  • TransUnion
  • Verisk Analytics Inc.
  • Wolters Kluwer NV

Qualitative and quantitative analysis of companies has been conducted to help clients understand the wider business environment as well as the strengths and weaknesses of key industry players. Data is qualitatively analyzed to categorize companies as pure play, category-focused, industry-focused, and diversified; it is quantitatively analyzed to categorize companies as dominant, leading, strong, tentative, and weak.

Recent Development and News in Risk analytics market

  • In the Systems Software industry, the widespread integration of generative artificial intelligence into enterprise automation workflows has significantly enhanced anomaly identification algorithms, directly impacting Risk Analytics demand by enabling faster detection of cyber threats.
  • The enforcement of localized data privacy regulations and stringent reporting mandates has accelerated the modernization of legacy compliance architectures, compelling institutions to adopt automated tools that mitigate legal vulnerabilities.
  • The transition toward high-performance computing in cloud infrastructures has reduced data latency for unstructured data processing, allowing financial sectors to execute real-time liquidity risk management with 40% greater computational efficiency.
  • The rising frequency of supply chain disruptions has driven the deployment of automated scenario mapping and geospatial intelligence mapping tools, increasing the reliance on continuous monitoring platforms to safeguard global operational resilience.

Dive into Technavio’s robust research methodology, blending expert interviews, extensive data synthesis, and validated models for unparalleled Risk Analytics Market insights. See full methodology.

Market Scope
Page number 322
Base year 2025
Historic period 2020-2024
Forecast period 2026-2030
Growth momentum & CAGR Accelerate at a CAGR of 11.1%
Market growth 2026-2030 USD 38634.5 million
Market structure Fragmented
YoY growth 2025-2026(%) 10.4%
Key countries US, Canada, Mexico, Germany, UK, France, Italy, Spain, The Netherlands, China, Japan, India, South Korea, Australia, Indonesia, Brazil, Argentina, Chile, Saudi Arabia, UAE, South Africa, Egypt and Turkey
Competitive landscape Leading Companies, Market Positioning of Companies, Competitive Strategies, and Industry Risks

Request Free Sample

Research Analyst Overview

  • The Risk Analytics Market functions as the critical nervous system for modern enterprises navigating volatile economic and regulatory environments. The shift toward an operational resilience framework dictates that boardroom executives now treat vulnerability quantification algorithms as essential tools for capital allocation and strategic product development.
  • By embedding behavioral science analytics into human resources and insider threat protocols, multinational corporations have recorded a 24% reduction in internal data exfiltration incidents. This human-centric risk monitoring empowers leadership to address ethical drift and systemic burnout before they trigger severe compliance failures.
  • Furthermore, the adoption of advanced polymorphic malware detection allows IT governance committees to actively prioritize cybersecurity budgets based on empirical threat severity rather than reactive incident response. Board-level integration of enterprise risk mapping ensures that disparate departmental data silos are unified into a single, actionable dashboard.
  • Utilizing synthetic data generation facilitates the rigorous testing of financial models without exposing sensitive consumer information, directly aligning aggressive commercial expansion strategies with stringent privacy regulations and safeguarding long-term institutional stability.

What are the Key Data Covered in this Risk Analytics Market Research and Growth Report?

  • What is the expected growth of the Risk Analytics Market between 2026 and 2030?

    • USD 38.63 billion, at a CAGR of 11.1%

  • What segmentation does the market report cover?

    • The report is segmented by Component (Solution, and Service), Deployment (On-premises, and Cloud), Type (Credit risk, Operational risk, Financial risk, Cyber risk, and Climate and ESG risk), End-user (Large enterprises, and SMEs) and Geography (North America, Europe, APAC, South America, Middle East and Africa)

  • Which regions are analyzed in the report?

    • North America, Europe, APAC, South America and Middle East and Africa

  • What are the key growth drivers and market challenges?

    • Rising of sophisticated cyber threats and digital vulnerabilities, Regulatory divergence and burden of compliance

  • Who are the major players in the Risk Analytics Market?

    • Adenza Group Inc., Deloitte Touche Tohmatsu Ltd., Equifax Inc., Ernst and Young Global Ltd., Experian Plc, Fair Isaac Corp., Fidelity National Information, KPMG International Ltd., MetricStream Inc., MSCI Inc., Oracle Corp., PricewaterhouseCoopers LLP, ProcessUnity Inc., Provenir Group, Recorded Future Inc., Resolver Inc., Riskonnect Inc., SAP SE, TransUnion, Verisk Analytics Inc. and Wolters Kluwer NV

Market Research Insights

  • The Risk Analytics Market is rapidly evolving to address complex enterprise vulnerabilities through advanced digital frameworks. By implementing high-performance computing, financial institutions have accelerated unstructured data processing speeds by 35%, drastically reducing the time required for accurate sovereign risk assessment. Furthermore, the integration of generative artificial intelligence into compliance workflows has decreased manual reporting errors by 20%, directly improving ROI.
  • Utilizing application programming interfaces to connect isolated departmental data silos enhances continuous risk monitoring across disparate corporate networks. This modernization effort allows organizations to deploy real-time threat intelligence, mitigating exposure to polymorphic malware and ensuring robust regulatory adherence while reducing overarching cybersecurity mitigation costs by 18%.

We can help! Our analysts can customize this risk analytics market research report to meet your requirements.

Get in touch

1. Executive Summary

1.1 Market overview

Executive Summary - Chart on Market Overview
Executive Summary - Data Table on Market Overview
Executive Summary - Chart on Global Market Characteristics
Executive Summary - Chart on Market by Geography
Executive Summary - Chart on Market Segmentation by Component
Executive Summary - Chart on Market Segmentation by Deployment
Executive Summary - Chart on Market Segmentation by Type
Executive Summary - Chart on Market Segmentation by End-user
Executive Summary - Chart on Incremental Growth
Executive Summary - Data Table on Incremental Growth
Executive Summary - Chart on Company Market Positioning

2. Technavio Analysis

2.1 Analysis of price sensitivity, lifecycle, customer purchase basket, adoption rates, and purchase criteria

2.2 Criticality of inputs and Factors of differentiation

Chart on Overview on criticality of inputs and factors of differentiation

2.3 Factors of disruption

Chart on Overview on factors of disruption

2.4 Impact of drivers and challenges

Chart on Impact of drivers and challenges in 2025 and 2030

3. Market Landscape

3.1 Market ecosystem

Chart on Parent Market
Data Table on - Parent Market

3.2 Market characteristics

Chart on Market characteristics analysis

3.3 Value chain analysis

Chart on Value chain analysis

4. Market Sizing

4.1 Market definition

Data Table on Offerings of companies included in the market definition

4.2 Market segment analysis

Market segments

4.3 Market size 2025

4.4 Market outlook: Forecast for 2025-2030

Chart on Global - Market size and forecast 2025-2030 ($ million)
Data Table on Global - Market size and forecast 2025-2030 ($ million)
Chart on Global Market: Year-over-year growth 2025-2030 (%)
Data Table on Global Market: Year-over-year growth 2025-2030 (%)

5. Historic Market Size

5.1 Global Risk Analytics Market 2020 - 2024

Historic Market Size - Data Table on Global Risk Analytics Market 2020 - 2024 ($ million)

5.2 Component segment analysis 2020 - 2024

Historic Market Size - Component Segment 2020 - 2024 ($ million)

5.3 Deployment segment analysis 2020 - 2024

Historic Market Size - Deployment Segment 2020 - 2024 ($ million)

5.4 Type segment analysis 2020 - 2024

Historic Market Size - Type Segment 2020 - 2024 ($ million)

5.5 End-user segment analysis 2020 - 2024

Historic Market Size - End-user Segment 2020 - 2024 ($ million)

5.6 Geography segment analysis 2020 - 2024

Historic Market Size - Geography Segment 2020 - 2024 ($ million)

5.7 Country segment analysis 2020 - 2024

Historic Market Size - Country Segment 2020 - 2024 ($ million)

6. Qualitative Analysis

6.1 Impact of AI on Global Risk Analytics Market

6.2 Impact of Geopolitical Conflict on Global Risk Analytics Market

7. Five Forces Analysis

7.1 Five forces summary

Five forces analysis - Comparison between 2025 and 2030

7.2 Bargaining power of buyers

Bargaining power of buyers - Impact of key factors 2025 and 2030

7.3 Bargaining power of suppliers

Bargaining power of suppliers - Impact of key factors in 2025 and 2030

7.4 Threat of new entrants

Threat of new entrants - Impact of key factors in 2025 and 2030

7.5 Threat of substitutes

Threat of substitutes - Impact of key factors in 2025 and 2030

7.6 Threat of rivalry

Threat of rivalry - Impact of key factors in 2025 and 2030

7.7 Market condition

Chart on Market condition - Five forces 2025 and 2030

8. Market Segmentation by Component

8.1 Market segments

Chart on Component - Market share 2025-2030 (%)
Data Table on Component - Market share 2025-2030 (%)

8.2 Comparison by Component

Chart on Comparison by Component
Data Table on Comparison by Component

8.3 Solution - Market size and forecast 2025-2030

Chart on Solution - Market size and forecast 2025-2030 ($ million)
Data Table on Solution - Market size and forecast 2025-2030 ($ million)
Chart on Solution - Year-over-year growth 2025-2030 (%)
Data Table on Solution - Year-over-year growth 2025-2030 (%)

8.4 Service - Market size and forecast 2025-2030

Chart on Service - Market size and forecast 2025-2030 ($ million)
Data Table on Service - Market size and forecast 2025-2030 ($ million)
Chart on Service - Year-over-year growth 2025-2030 (%)
Data Table on Service - Year-over-year growth 2025-2030 (%)

8.5 Market opportunity by Component

Market opportunity by Component ($ million)
Data Table on Market opportunity by Component ($ million)

9. Market Segmentation by Deployment

9.1 Market segments

Chart on Deployment - Market share 2025-2030 (%)
Data Table on Deployment - Market share 2025-2030 (%)

9.2 Comparison by Deployment

Chart on Comparison by Deployment
Data Table on Comparison by Deployment

9.3 On-premises - Market size and forecast 2025-2030

Chart on On-premises - Market size and forecast 2025-2030 ($ million)
Data Table on On-premises - Market size and forecast 2025-2030 ($ million)
Chart on On-premises - Year-over-year growth 2025-2030 (%)
Data Table on On-premises - Year-over-year growth 2025-2030 (%)

9.4 Cloud - Market size and forecast 2025-2030

Chart on Cloud - Market size and forecast 2025-2030 ($ million)
Data Table on Cloud - Market size and forecast 2025-2030 ($ million)
Chart on Cloud - Year-over-year growth 2025-2030 (%)
Data Table on Cloud - Year-over-year growth 2025-2030 (%)

9.5 Market opportunity by Deployment

Market opportunity by Deployment ($ million)
Data Table on Market opportunity by Deployment ($ million)

10. Market Segmentation by Type

10.1 Market segments

Chart on Type - Market share 2025-2030 (%)
Data Table on Type - Market share 2025-2030 (%)

10.2 Comparison by Type

Chart on Comparison by Type
Data Table on Comparison by Type

10.3 Credit risk - Market size and forecast 2025-2030

Chart on Credit risk - Market size and forecast 2025-2030 ($ million)
Data Table on Credit risk - Market size and forecast 2025-2030 ($ million)
Chart on Credit risk - Year-over-year growth 2025-2030 (%)
Data Table on Credit risk - Year-over-year growth 2025-2030 (%)

10.4 Operational risk - Market size and forecast 2025-2030

Chart on Operational risk - Market size and forecast 2025-2030 ($ million)
Data Table on Operational risk - Market size and forecast 2025-2030 ($ million)
Chart on Operational risk - Year-over-year growth 2025-2030 (%)
Data Table on Operational risk - Year-over-year growth 2025-2030 (%)

10.5 Financial risk - Market size and forecast 2025-2030

Chart on Financial risk - Market size and forecast 2025-2030 ($ million)
Data Table on Financial risk - Market size and forecast 2025-2030 ($ million)
Chart on Financial risk - Year-over-year growth 2025-2030 (%)
Data Table on Financial risk - Year-over-year growth 2025-2030 (%)

10.6 Cyber risk - Market size and forecast 2025-2030

Chart on Cyber risk - Market size and forecast 2025-2030 ($ million)
Data Table on Cyber risk - Market size and forecast 2025-2030 ($ million)
Chart on Cyber risk - Year-over-year growth 2025-2030 (%)
Data Table on Cyber risk - Year-over-year growth 2025-2030 (%)

10.7 Climate and ESG risk - Market size and forecast 2025-2030

Chart on Climate and ESG risk - Market size and forecast 2025-2030 ($ million)
Data Table on Climate and ESG risk - Market size and forecast 2025-2030 ($ million)
Chart on Climate and ESG risk - Year-over-year growth 2025-2030 (%)
Data Table on Climate and ESG risk - Year-over-year growth 2025-2030 (%)

10.8 Market opportunity by Type

Market opportunity by Type ($ million)
Data Table on Market opportunity by Type ($ million)

11. Market Segmentation by End-user

11.1 Market segments

Chart on End-user - Market share 2025-2030 (%)
Data Table on End-user - Market share 2025-2030 (%)

11.2 Comparison by End-user

Chart on Comparison by End-user
Data Table on Comparison by End-user

11.3 Large enterprises - Market size and forecast 2025-2030

Chart on Large enterprises - Market size and forecast 2025-2030 ($ million)
Data Table on Large enterprises - Market size and forecast 2025-2030 ($ million)
Chart on Large enterprises - Year-over-year growth 2025-2030 (%)
Data Table on Large enterprises - Year-over-year growth 2025-2030 (%)

11.4 SMEs - Market size and forecast 2025-2030

Chart on SMEs - Market size and forecast 2025-2030 ($ million)
Data Table on SMEs - Market size and forecast 2025-2030 ($ million)
Chart on SMEs - Year-over-year growth 2025-2030 (%)
Data Table on SMEs - Year-over-year growth 2025-2030 (%)

11.5 Market opportunity by End-user

Market opportunity by End-user ($ million)
Data Table on Market opportunity by End-user ($ million)

12. Customer Landscape

12.1 Customer landscape overview

Analysis of price sensitivity, lifecycle, customer purchase basket, adoption rates, and purchase criteria

13. Geographic Landscape

13.1 Geographic segmentation

Chart on Market share by geography 2025-2030 (%)
Data Table on Market share by geography 2025-2030 (%)

13.2 Geographic comparison

Chart on Geographic comparison
Data Table on Geographic comparison

13.3 North America - Market size and forecast 2025-2030

Chart on North America - Market size and forecast 2025-2030 ($ million)
Data Table on North America - Market size and forecast 2025-2030 ($ million)
Chart on North America - Year-over-year growth 2025-2030 (%)
Data Table on North America - Year-over-year growth 2025-2030 (%)
Chart on Regional Comparison - North America
Data Table on Regional Comparison - North America

13.3.1 US - Market size and forecast 2025-2030

Chart on US - Market size and forecast 2025-2030 ($ million)
Data Table on US - Market size and forecast 2025-2030 ($ million)
Chart on US - Year-over-year growth 2025-2030 (%)
Data Table on US - Year-over-year growth 2025-2030 (%)

13.3.2 Canada - Market size and forecast 2025-2030

Chart on Canada - Market size and forecast 2025-2030 ($ million)
Data Table on Canada - Market size and forecast 2025-2030 ($ million)
Chart on Canada - Year-over-year growth 2025-2030 (%)
Data Table on Canada - Year-over-year growth 2025-2030 (%)

13.3.3 Mexico - Market size and forecast 2025-2030

Chart on Mexico - Market size and forecast 2025-2030 ($ million)
Data Table on Mexico - Market size and forecast 2025-2030 ($ million)
Chart on Mexico - Year-over-year growth 2025-2030 (%)
Data Table on Mexico - Year-over-year growth 2025-2030 (%)

13.4 Europe - Market size and forecast 2025-2030

Chart on Europe - Market size and forecast 2025-2030 ($ million)
Data Table on Europe - Market size and forecast 2025-2030 ($ million)
Chart on Europe - Year-over-year growth 2025-2030 (%)
Data Table on Europe - Year-over-year growth 2025-2030 (%)
Chart on Regional Comparison - Europe
Data Table on Regional Comparison - Europe

13.4.1 Germany - Market size and forecast 2025-2030

Chart on Germany - Market size and forecast 2025-2030 ($ million)
Data Table on Germany - Market size and forecast 2025-2030 ($ million)
Chart on Germany - Year-over-year growth 2025-2030 (%)
Data Table on Germany - Year-over-year growth 2025-2030 (%)

13.4.2 UK - Market size and forecast 2025-2030

Chart on UK - Market size and forecast 2025-2030 ($ million)
Data Table on UK - Market size and forecast 2025-2030 ($ million)
Chart on UK - Year-over-year growth 2025-2030 (%)
Data Table on UK - Year-over-year growth 2025-2030 (%)

13.4.3 France - Market size and forecast 2025-2030

Chart on France - Market size and forecast 2025-2030 ($ million)
Data Table on France - Market size and forecast 2025-2030 ($ million)
Chart on France - Year-over-year growth 2025-2030 (%)
Data Table on France - Year-over-year growth 2025-2030 (%)

13.4.4 Italy - Market size and forecast 2025-2030

Chart on Italy - Market size and forecast 2025-2030 ($ million)
Data Table on Italy - Market size and forecast 2025-2030 ($ million)
Chart on Italy - Year-over-year growth 2025-2030 (%)
Data Table on Italy - Year-over-year growth 2025-2030 (%)

13.4.5 Spain - Market size and forecast 2025-2030

Chart on Spain - Market size and forecast 2025-2030 ($ million)
Data Table on Spain - Market size and forecast 2025-2030 ($ million)
Chart on Spain - Year-over-year growth 2025-2030 (%)
Data Table on Spain - Year-over-year growth 2025-2030 (%)

13.4.6 The Netherlands - Market size and forecast 2025-2030

Chart on The Netherlands - Market size and forecast 2025-2030 ($ million)
Data Table on The Netherlands - Market size and forecast 2025-2030 ($ million)
Chart on The Netherlands - Year-over-year growth 2025-2030 (%)
Data Table on The Netherlands - Year-over-year growth 2025-2030 (%)

13.5 APAC - Market size and forecast 2025-2030

Chart on APAC - Market size and forecast 2025-2030 ($ million)
Data Table on APAC - Market size and forecast 2025-2030 ($ million)
Chart on APAC - Year-over-year growth 2025-2030 (%)
Data Table on APAC - Year-over-year growth 2025-2030 (%)
Chart on Regional Comparison - APAC
Data Table on Regional Comparison - APAC

13.5.1 China - Market size and forecast 2025-2030

Chart on China - Market size and forecast 2025-2030 ($ million)
Data Table on China - Market size and forecast 2025-2030 ($ million)
Chart on China - Year-over-year growth 2025-2030 (%)
Data Table on China - Year-over-year growth 2025-2030 (%)

13.5.2 Japan - Market size and forecast 2025-2030

Chart on Japan - Market size and forecast 2025-2030 ($ million)
Data Table on Japan - Market size and forecast 2025-2030 ($ million)
Chart on Japan - Year-over-year growth 2025-2030 (%)
Data Table on Japan - Year-over-year growth 2025-2030 (%)

13.5.3 India - Market size and forecast 2025-2030

Chart on India - Market size and forecast 2025-2030 ($ million)
Data Table on India - Market size and forecast 2025-2030 ($ million)
Chart on India - Year-over-year growth 2025-2030 (%)
Data Table on India - Year-over-year growth 2025-2030 (%)

13.5.4 South Korea - Market size and forecast 2025-2030

Chart on South Korea - Market size and forecast 2025-2030 ($ million)
Data Table on South Korea - Market size and forecast 2025-2030 ($ million)
Chart on South Korea - Year-over-year growth 2025-2030 (%)
Data Table on South Korea - Year-over-year growth 2025-2030 (%)

13.5.5 Australia - Market size and forecast 2025-2030

Chart on Australia - Market size and forecast 2025-2030 ($ million)
Data Table on Australia - Market size and forecast 2025-2030 ($ million)
Chart on Australia - Year-over-year growth 2025-2030 (%)
Data Table on Australia - Year-over-year growth 2025-2030 (%)

13.5.6 Indonesia - Market size and forecast 2025-2030

Chart on Indonesia - Market size and forecast 2025-2030 ($ million)
Data Table on Indonesia - Market size and forecast 2025-2030 ($ million)
Chart on Indonesia - Year-over-year growth 2025-2030 (%)
Data Table on Indonesia - Year-over-year growth 2025-2030 (%)

13.6 South America - Market size and forecast 2025-2030

Chart on South America - Market size and forecast 2025-2030 ($ million)
Data Table on South America - Market size and forecast 2025-2030 ($ million)
Chart on South America - Year-over-year growth 2025-2030 (%)
Data Table on South America - Year-over-year growth 2025-2030 (%)
Chart on Regional Comparison - South America
Data Table on Regional Comparison - South America

13.6.1 Brazil - Market size and forecast 2025-2030

Chart on Brazil - Market size and forecast 2025-2030 ($ million)
Data Table on Brazil - Market size and forecast 2025-2030 ($ million)
Chart on Brazil - Year-over-year growth 2025-2030 (%)
Data Table on Brazil - Year-over-year growth 2025-2030 (%)

13.6.2 Argentina - Market size and forecast 2025-2030

Chart on Argentina - Market size and forecast 2025-2030 ($ million)
Data Table on Argentina - Market size and forecast 2025-2030 ($ million)
Chart on Argentina - Year-over-year growth 2025-2030 (%)
Data Table on Argentina - Year-over-year growth 2025-2030 (%)

13.6.3 Chile - Market size and forecast 2025-2030

Chart on Chile - Market size and forecast 2025-2030 ($ million)
Data Table on Chile - Market size and forecast 2025-2030 ($ million)
Chart on Chile - Year-over-year growth 2025-2030 (%)
Data Table on Chile - Year-over-year growth 2025-2030 (%)

13.7 Middle East and Africa - Market size and forecast 2025-2030

Chart on Middle East and Africa - Market size and forecast 2025-2030 ($ million)
Data Table on Middle East and Africa - Market size and forecast 2025-2030 ($ million)
Chart on Middle East and Africa - Year-over-year growth 2025-2030 (%)
Data Table on Middle East and Africa - Year-over-year growth 2025-2030 (%)
Chart on Regional Comparison - Middle East and Africa
Data Table on Regional Comparison - Middle East and Africa

13.7.1 Saudi Arabia - Market size and forecast 2025-2030

Chart on Saudi Arabia - Market size and forecast 2025-2030 ($ million)
Data Table on Saudi Arabia - Market size and forecast 2025-2030 ($ million)
Chart on Saudi Arabia - Year-over-year growth 2025-2030 (%)
Data Table on Saudi Arabia - Year-over-year growth 2025-2030 (%)

13.7.2 UAE - Market size and forecast 2025-2030

Chart on UAE - Market size and forecast 2025-2030 ($ million)
Data Table on UAE - Market size and forecast 2025-2030 ($ million)
Chart on UAE - Year-over-year growth 2025-2030 (%)
Data Table on UAE - Year-over-year growth 2025-2030 (%)

13.7.3 South Africa - Market size and forecast 2025-2030

Chart on South Africa - Market size and forecast 2025-2030 ($ million)
Data Table on South Africa - Market size and forecast 2025-2030 ($ million)
Chart on South Africa - Year-over-year growth 2025-2030 (%)
Data Table on South Africa - Year-over-year growth 2025-2030 (%)

13.7.4 Egypt - Market size and forecast 2025-2030

Chart on Egypt - Market size and forecast 2025-2030 ($ million)
Data Table on Egypt - Market size and forecast 2025-2030 ($ million)
Chart on Egypt - Year-over-year growth 2025-2030 (%)
Data Table on Egypt - Year-over-year growth 2025-2030 (%)

13.7.5 Turkey - Market size and forecast 2025-2030

Chart on Turkey - Market size and forecast 2025-2030 ($ million)
Data Table on Turkey - Market size and forecast 2025-2030 ($ million)
Chart on Turkey - Year-over-year growth 2025-2030 (%)
Data Table on Turkey - Year-over-year growth 2025-2030 (%)

13.8 Market opportunity by geography

Market opportunity by geography ($ million)
Data Tables on Market opportunity by geography ($ million)

14. Drivers, Challenges, and Opportunity

14.1 Market drivers

Rising of sophisticated cyber threats and digital vulnerabilities
Mainstreaming ESG metrics in risk frameworks
Proliferation of big data and advanced AI integration

14.2 Market challenges

Regulatory divergence and burden of compliance
Interoperability hurdles and persistence of data fragmentation
Expanding talent gap in advanced quantitative modelling

14.3 Impact of drivers and challenges

Impact of drivers and challenges in 2025 and 2030

14.4 Market opportunities

Holistic climate and natural hazard risk quantification
Geopolitical volatility and macroeconomic scenario modeling
Behavioral science and human-centric operational risk monitoring

15. Competitive Landscape

15.1 Overview

15.2

Overview on criticality of inputs and factors of differentiation

15.3 Landscape disruption

Overview on factors of disruption

15.4 Industry risks

Impact of key risks on business

16. Competitive Analysis

16.1 Companies profiled

Companies covered

16.2 Company ranking index

16.3 Market positioning of companies

Matrix on companies position and classification

16.4 Deloitte Touche Tohmatsu Ltd.

Deloitte Touche Tohmatsu Ltd. - Overview
Deloitte Touche Tohmatsu Ltd. - Business segments
Deloitte Touche Tohmatsu Ltd. - Key offerings
Deloitte Touche Tohmatsu Ltd. - Segment focus
SWOT

16.5 Equifax Inc.

Equifax Inc. - Overview
Equifax Inc. - Business segments
Equifax Inc. - Key offerings
Equifax Inc. - Segment focus
SWOT

16.6 Ernst and Young Global Ltd.

Ernst and Young Global Ltd. - Overview
Ernst and Young Global Ltd. - Product / Service
Ernst and Young Global Ltd. - Key offerings
SWOT

16.7 Experian Plc

Experian Plc - Overview
Experian Plc - Business segments
Experian Plc - Key offerings
Experian Plc - Segment focus
SWOT

16.8 Fair Isaac Corp.

Fair Isaac Corp. - Overview
Fair Isaac Corp. - Business segments
Fair Isaac Corp. - Key news
Fair Isaac Corp. - Key offerings
Fair Isaac Corp. - Segment focus
SWOT

16.9 Fidelity National Information

Fidelity National Information - Overview
Fidelity National Information - Business segments
Fidelity National Information - Key offerings
Fidelity National Information - Segment focus
SWOT

16.10 KPMG International Ltd.

KPMG International Ltd. - Overview
KPMG International Ltd. - Product / Service
KPMG International Ltd. - Key offerings
SWOT

16.11 MSCI Inc.

MSCI Inc. - Overview
MSCI Inc. - Business segments
MSCI Inc. - Key offerings
MSCI Inc. - Segment focus
SWOT

16.12 Oracle Corp.

Oracle Corp. - Overview
Oracle Corp. - Business segments
Oracle Corp. - Key news
Oracle Corp. - Key offerings
Oracle Corp. - Segment focus
SWOT

16.13 PricewaterhouseCoopers LLP

PricewaterhouseCoopers LLP - Overview
PricewaterhouseCoopers LLP - Product / Service
PricewaterhouseCoopers LLP - Key offerings
SWOT

16.14 Recorded Future Inc.

Recorded Future Inc. - Overview
Recorded Future Inc. - Product / Service
Recorded Future Inc. - Key offerings
SWOT

16.15 SAP SE

SAP SE - Overview
SAP SE - Business segments
SAP SE - Key news
SAP SE - Key offerings
SAP SE - Segment focus
SWOT

16.16 TransUnion

TransUnion - Overview
TransUnion - Business segments
TransUnion - Key news
TransUnion - Key offerings
TransUnion - Segment focus
SWOT

16.17 Verisk Analytics Inc.

Verisk Analytics Inc. - Overview
Verisk Analytics Inc. - Business segments
Verisk Analytics Inc. - Key offerings
Verisk Analytics Inc. - Segment focus
SWOT

16.18 Wolters Kluwer NV

Wolters Kluwer NV - Overview
Wolters Kluwer NV - Business segments
Wolters Kluwer NV - Key news
Wolters Kluwer NV - Key offerings
Wolters Kluwer NV - Segment focus
SWOT

17. Appendix

17.1 Scope of the report

Market definition
Objectives
Notes and caveats

17.2 Inclusions and exclusions checklist

Inclusions checklist
Exclusions checklist

17.3 Currency conversion rates for US$

17.4 Research methodology

17.5 Data procurement

Information sources

17.6 Data validation

17.7 Validation techniques employed for market sizing

17.8 Data synthesis

17.9 360 degree market analysis

17.10 List of abbreviations

Research Methodology

Technavio presents a detailed picture of the market by way of study, synthesis, and summation of data from multiple sources. The analysts have presented the various facets of the market with a particular focus on identifying the key industry influencers. The data thus presented is comprehensive, reliable, and the result of extensive research, both primary and secondary.

INFORMATION SOURCES

Primary sources

  • Manufacturers and suppliers
  • Channel partners
  • Industry experts
  • Strategic decision makers

Secondary sources

  • Industry journals and periodicals
  • Government data
  • Financial reports of key industry players
  • Historical data
  • Press releases

DATA ANALYSIS

Data Synthesis

  • Collation of data
  • Estimation of key figures
  • Analysis of derived insights

Data Validation

  • Triangulation with data models
  • Reference against proprietary databases
  • Corroboration with industry experts

REPORT WRITING

Qualitative

  • Market drivers
  • Market challenges
  • Market trends
  • Five forces analysis

Quantitative

  • Market size and forecast
  • Market segmentation
  • Geographical insights
  • Competitive landscape

Interested in this report?

Get your sample now to see our research methodology and insights!

Download Now

Frequently Asked Questions

Risk Analytics market growth will increase by USD 38634.5 million during 2026-2030.

The Risk Analytics market is expected to grow at a CAGR of 11.1% during 2026-2030.

Risk Analytics market is segmented by Component (Solution, Service) Deployment (On-premises, Cloud) Type (Credit risk, Operational risk, Financial risk, Cyber risk, Climate and ESG risk) End-user (Large enterprises, SMEs)

Adenza Group Inc., Deloitte Touche Tohmatsu Ltd., Equifax Inc., Ernst and Young Global Ltd., Experian Plc, Fair Isaac Corp., Fidelity National Information, KPMG International Ltd., MetricStream Inc., MSCI Inc., Oracle Corp., PricewaterhouseCoopers LLP, ProcessUnity Inc., Provenir Group, Recorded Future Inc., Resolver Inc., Riskonnect Inc., SAP SE, TransUnion, Verisk Analytics Inc., Wolters Kluwer NV are a few of the key vendors in the Risk Analytics market.

Europe will register the highest growth rate of 31.2% among the other regions. Therefore, the Risk Analytics market in Europe is expected to garner significant business opportunities for the vendors during the forecast period.

US, Canada, Mexico, Germany, UK, France, Italy, Spain, The Netherlands, China, Japan, India, South Korea, Australia, Indonesia, Brazil, Argentina, Chile, Saudi Arabia, UAE, South Africa, Egypt, Turkey

  • Rising of sophisticated cyber threats and digital vulnerabilities is the driving factor this market.

The Risk Analytics market vendors should focus on grabbing business opportunities from the Component segment as it accounted for the largest market share in the base year.
RIA - Research AI Assistant
Ask RIA
