Recreational Boats Market Analysis, Size, and Forecast 2026-2030: North America (US, Canada, and Mexico), APAC (China, Japan, and South Korea), Europe (Italy, France, and Germany), South America (Brazil, Argentina, and Colombia), Middle East and Africa (Saudi Arabia, South Africa, and UAE), and Rest of World (ROW)

Recreational Boats Market Analysis, Size, and Forecast 2026-2030:
North America (US, Canada, and Mexico), APAC (China, Japan, and South Korea), Europe (Italy, France, and Germany), South America (Brazil, Argentina, and Colombia), Middle East and Africa (Saudi Arabia, South Africa, and UAE), and Rest of World (ROW)

Published: Apr 2026 288 Pages SKU: IRTNTR75475

Market Overview at a Glance

$7.75 B
Market Opportunity
6.6%
CAGR 2025 - 2030
49.3%
North America Growth
$9.66 B
Sailboats segment 2024

Recreational Boats Market Size 2026-2030

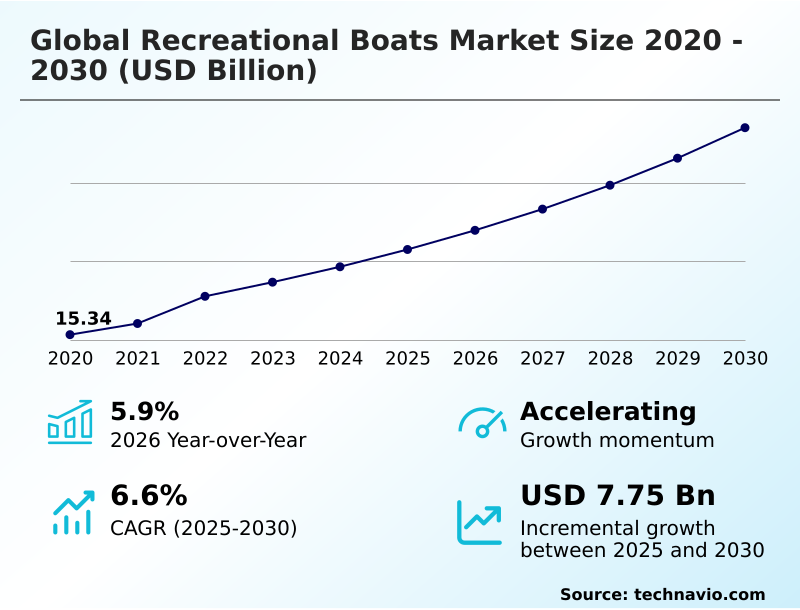
The recreational boats market size is valued to increase by USD 7.75 billion, at a CAGR of 6.6% from 2025 to 2030. Technological democratization and integration of autonomous systems will drive the recreational boats market.

Major Market Trends & Insights

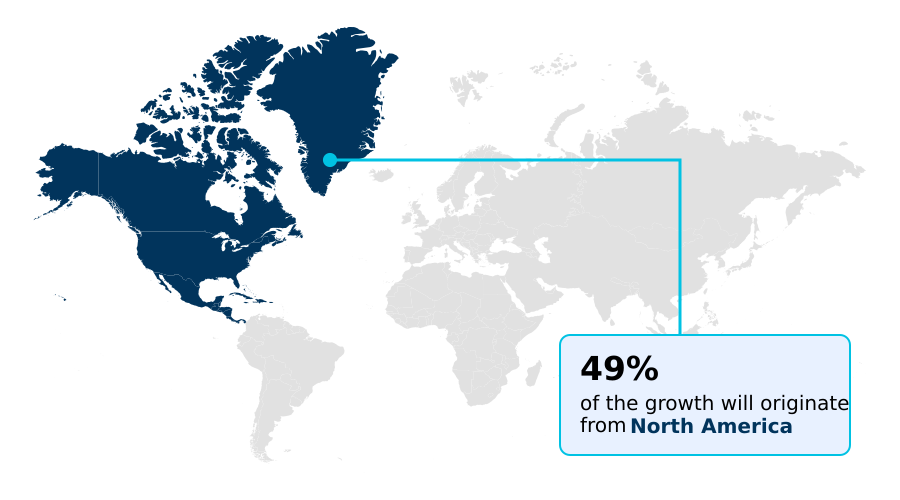
  • North America dominated the market and accounted for a 49.3% growth during the forecast period.
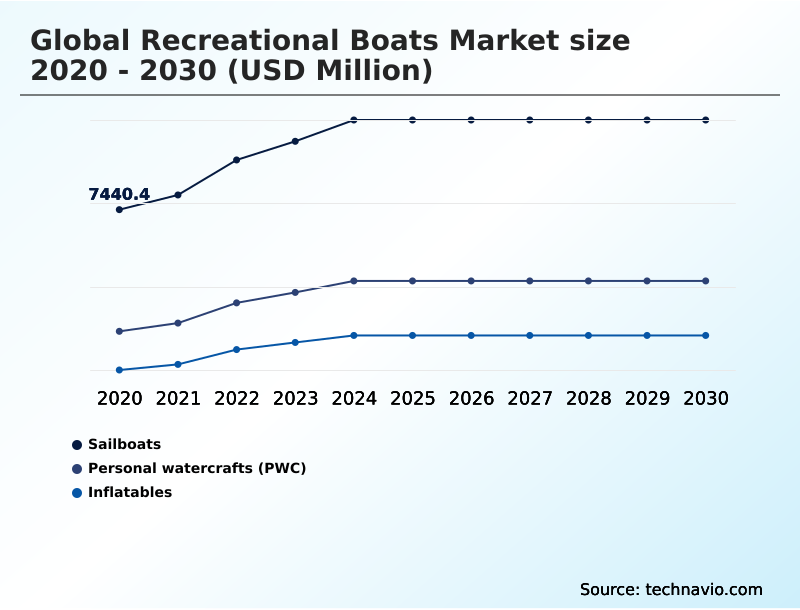
  • By Type - Sailboats segment was valued at USD 9.66 billion in 2024
  • By Product Type - Outboards segment accounted for the largest market revenue share in 2024

Market Size & Forecast

  • Market Opportunities: USD 13.17 billion
  • Market Future Opportunities: USD 7.75 billion
  • CAGR from 2025 to 2030 : 6.6%

Market Summary

  • The recreational boats market is undergoing a significant transformation, propelled by the integration of advanced technologies and evolving consumer preferences. Key drivers include the technological democratization of features like autonomous docking systems and joystick piloting, which lower the barrier to entry for novice operators and enhance safety.
  • A prominent trend is the shift toward marine electrification, with hybrid propulsion systems and high-energy-density lithium-ion batteries becoming more prevalent to meet maritime decarbonization mandates. This move toward sustainable propulsion is reshaping vessel design, favoring lightweight recycled carbon fiber and bio-resins.
  • For instance, fleet operators in the shared economy model are adopting electric vessels to reduce operational costs and comply with noise regulations in sensitive waterways, showcasing a practical business case for green technology.
  • However, the industry faces challenges, including an inventory overhang from post-pandemic production and a persistent shortage of specialized marine technicians capable of servicing complex digital fly-by-wire controls, which can impact the ownership experience.

What will be the Size of the Recreational Boats Market during the forecast period?

Get Key Insights on Market Forecast (PDF) Request Free Sample

How is the Recreational Boats Market Segmented?

The recreational boats industry research report provides comprehensive data (region-wise segment analysis), with forecasts and estimates in "USD million" for the period 2026-2030, as well as historical data from 2020-2024 for the following segments.

  • Type
    • Sailboats
    • Personal watercrafts (PWC)
    • Inflatables
  • Product type
    • Outboards
    • Inboard
  • Application
    • Cruising
    • Fishing
    • Watersports
  • Geography
    • North America
      • US
      • Canada
      • Mexico
    • APAC
      • China
      • Japan
      • South Korea
    • Europe
      • Italy
      • France
      • Germany
    • South America
      • Brazil
      • Argentina
      • Colombia
    • Middle East and Africa
      • Saudi Arabia
      • South Africa
      • UAE
    • Rest of World (ROW)

By Type Insights

The sailboats segment is estimated to witness significant growth during the forecast period.

The sailboats segment is a sophisticated fusion of traditional naval architecture and advanced engineering, appealing to a demographic focused on environmental stewardship.

Innovations in composite materials and carbon fiber components reduce displacement, while automated sail-handling systems can decrease crew requirements by up to 30%. In the luxury sector, performance cruisers adopt foil technology and wing-sail configurations derived from racing, offering exceptional speed.

Modern design incorporates hydro-generation systems for zero-emission auxiliary power. This shift toward high-tech, sustainable sailing ensures the segment's relevance amid evolving maritime decarbonization mandates and a growing interest in a recreational boating lifestyle supported by social connectivity.

Consumers increasingly seek semi-custom options and modular deck layouts, reflecting a trend toward nautical individualism and specialized boating activities.

Request Free Sample

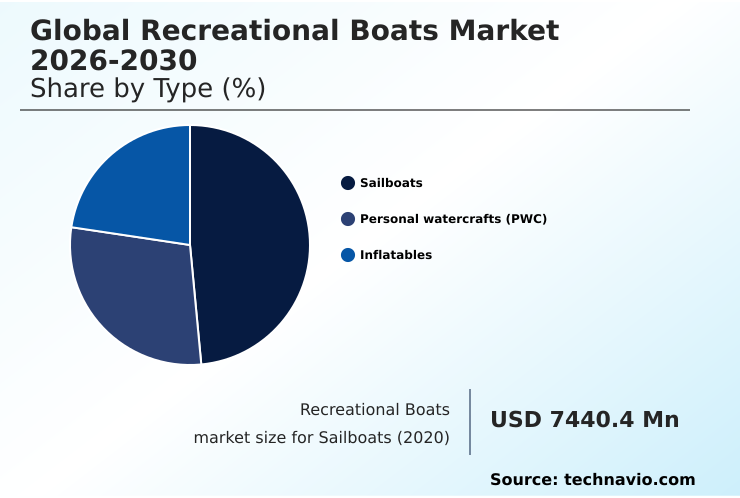
The Sailboats segment was valued at USD 9.66 billion in 2024 and showed a gradual increase during the forecast period.

Request Free Sample

Regional Analysis

North America is estimated to contribute 49.3% to the growth of the global market during the forecast period.Technavio’s analysts have elaborately explained the regional trends and drivers that shape the market during the forecast period.

See How Recreational Boats Market Demand is Rising in North America Request Free Sample

North America dominates the market, projected to account for 49.3% of incremental growth, driven by demand for vessels with advanced digital helm technologies. The region's focus on family-oriented coastal recreation fuels sales of boats with premium amenities.

In APAC, investment in maritime infrastructure is expanding maritime tourism, with new developments expected to increase charter fleet efficiency by 15%. European markets lead in adopting electronic station-keeping and hydro-generation systems due to strict environmental regulations.

The work-from-boat phenomenon is also gaining traction globally, supported by advancements in situational awareness tools and onboard connectivity, further diversifying vessel usage across geographies.

Market Dynamics

Our researchers analyzed the data with 2025 as the base year, along with the key drivers, trends, and challenges. A holistic analysis of drivers will help companies refine their marketing strategies to gain a competitive advantage.

  • A comprehensive long-term boat ownership cost analysis reveals a shifting landscape influenced by technological advancements. The classic outboard vs inboard engine efficiency debate is now complicated by the rise of electric boat propulsion systems comparison, where initial costs are weighed against lower fuel and maintenance expenses.
  • Innovations in marine navigation electronics are standard, but the focus is now on smart boat remote systems security to protect against unauthorized access. For performance-oriented buyers, wakeboarding boat hull design principles and the catamaran stability vs monohull speed trade-off remain critical decision points.
  • Durability concerns are addressed by inflatable boat material puncture resistance and the use of lightweight composites in boat building. As environmental regulations tighten, the environmental impact of marine propulsion is a key consideration, driving demand for advanced hull design for fuel efficiency and marine hybrid engine fuel consumption monitoring.
  • Features like joystick piloting for close quarters and autonomous boat docking system accuracy are becoming deciding factors, reducing operator stress and potential for damage. The best saltwater fishing boat features now include integrated digital switching systems for boats and sustainable materials in yacht construction, reflecting a holistic approach to luxury yacht interior design trends.

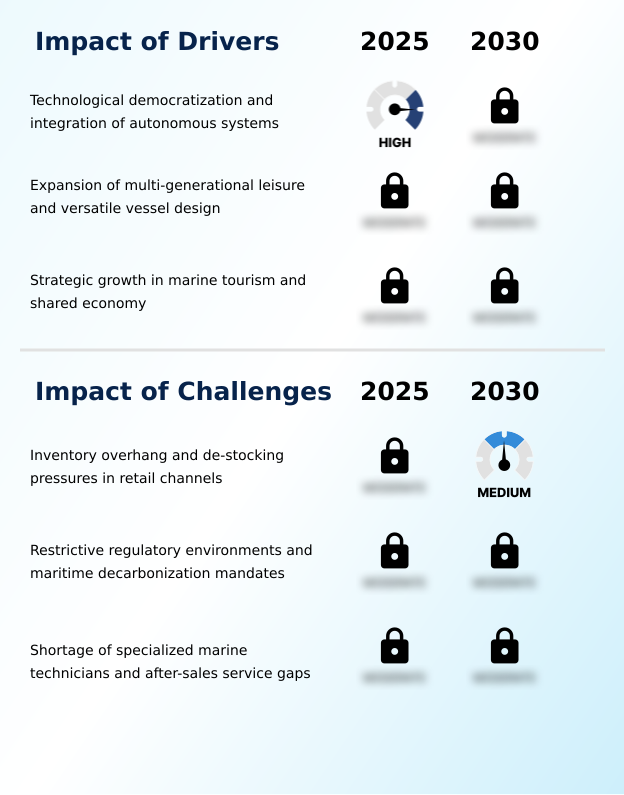
What are the key market drivers leading to the rise in the adoption of Recreational Boats Industry?

  • The democratization of high-end maritime technology and the integration of autonomous systems are key drivers making boating more accessible and lowering technical barriers for new users.

  • Growth is propelled by technological democratization, making advanced features accessible to a wider audience and enhancing automated safety. The integration of autonomous docking systems and intuitive control interfaces has reportedly reduced docking-related insurance claims by over 50% for equipped fleets.
  • Demand for versatile vessel design is also a major driver, with multi-mission vessels and crossover boats that support multi-generational leisure activities gaining popularity.
  • The expansion of the shared economy model through peer-to-peer boat sharing and luxury charter services broadens market access.
  • This model drives demand for durable vessels like aluminum fishing boats and rigid inflatable boats, while also providing valuable data for future product development.

What are the market trends shaping the Recreational Boats Industry?

  • The acceleration of marine electrification and sustainable propulsion systems emerges as a prominent market trend, driven by environmental regulations and consumer demand for quieter, more efficient boating experiences.

  • The market is defined by a rapid acceleration toward marine electrification, a key component of sustainable propulsion. This trend is driven by consumer demand for a refined boating experience and the need for environmental stewardship. Innovations include hybrid propulsion systems and high-energy-density lithium-ion batteries, with some new high-speed charging infrastructure networks enabling an 80% charge in under an hour.
  • The rise of the internet of boats, powered by high-bandwidth connectivity and internet of things technology, allows for remote diagnostics and over-the-air software updates, which can resolve up to 60% of non-mechanical system alerts without a service visit. This digital lifestyle extends to bespoke nautical architecture, where digital design tools are used to create unique, personalized vessels.

What challenges does the Recreational Boats Industry face during its growth?

  • A key challenge affecting industry growth is the inventory overhang and resulting de-stocking pressures across retail channels, which erodes profit margins and slows the introduction of new models.

  • A primary challenge is the significant inventory overhang leading to de-stocking pressures, which can erode retailer margins by up to 20% on prior-year models. This situation hinders the introduction of vessels with the latest joystick piloting and pod-drive technology.
  • Another critical issue is the complex regulatory environment, with fragmented maritime decarbonization mandates forcing costly investments in new four-stroke technologies and bio-resins. Furthermore, a chronic shortage of specialized marine technicians creates significant after-sales service gaps.
  • This labor deficit has increased average repair wait times by 45% in some key markets, negatively impacting the recreational boating lifestyle and the emotional connection owners have with their vessels.

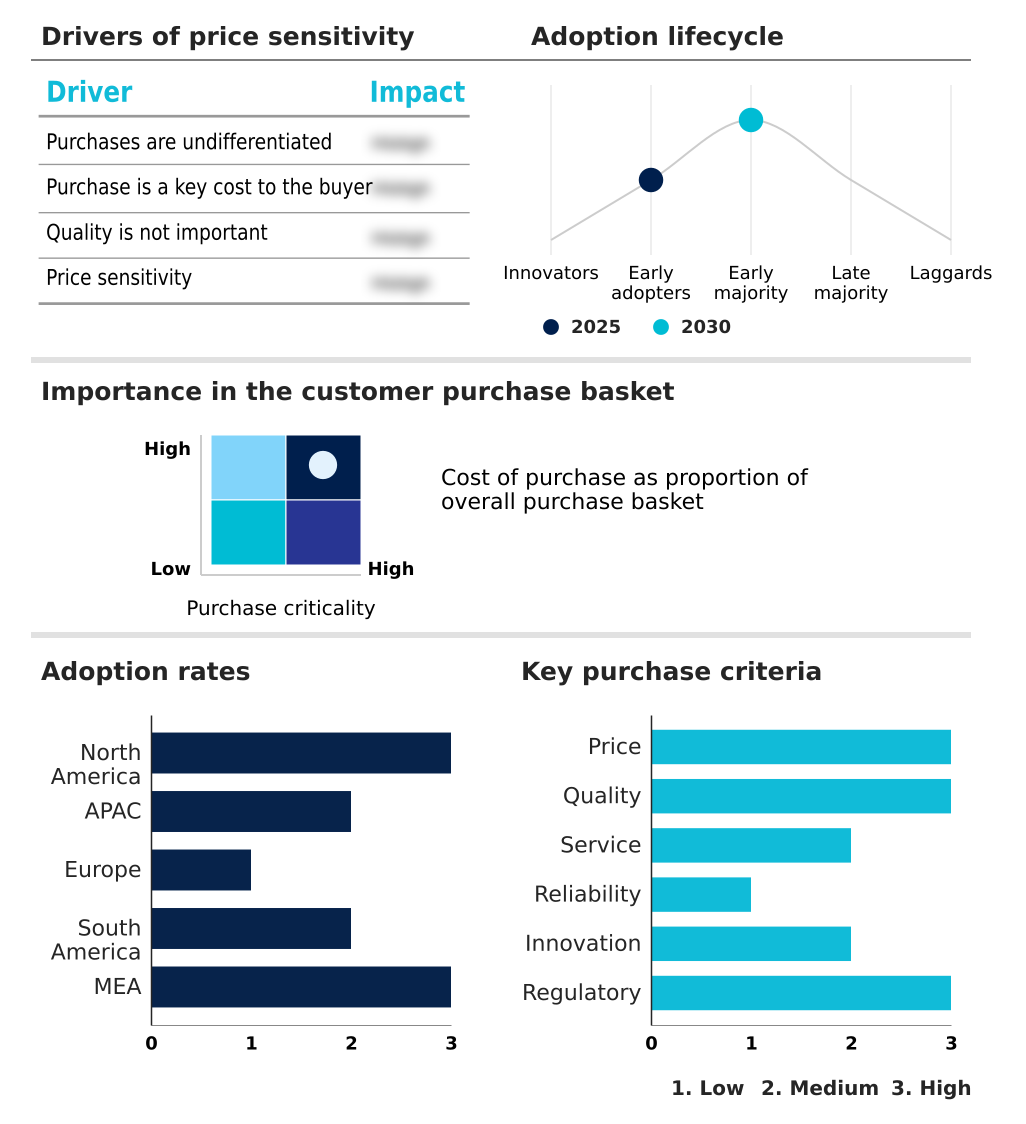
Exclusive Technavio Analysis on Customer Landscape

The recreational boats market forecasting report includes the adoption lifecycle of the market, covering from the innovator’s stage to the laggard’s stage. It focuses on adoption rates in different regions based on penetration. Furthermore, the recreational boats market report also includes key purchase criteria and drivers of price sensitivity to help companies evaluate and develop their market growth analysis strategies.

Customer Landscape of Recreational Boats Industry

Competitive Landscape

Companies are implementing various strategies, such as strategic alliances, recreational boats market forecast, partnerships, mergers and acquisitions, geographical expansion, and product/service launches, to enhance their presence in the industry.

Azimut Benetti SpA - Analysis reveals a focus on premium recreational boating through a portfolio of flybridge yachts and luxury superyachts, emphasizing sophisticated design and advanced naval engineering.

The industry research and growth report includes detailed analyses of the competitive landscape of the market and information about key companies, including:

  • Azimut Benetti SpA
  • Bavaria Yachtbau GmbH
  • Brunswick Corp.
  • Damen Yachting BV
  • Feadship Holland BV
  • FERRETTI SpA
  • Grady White Boats Inc.
  • Groupe Beneteau
  • Hobie Cat Co. II LLC
  • Malibu Boats Inc.
  • Marine Products Corp.
  • MasterCraft Boat Holdings Inc.
  • Princess Yachts Ltd.
  • Sanlorenzo Spa
  • Sunseeker International
  • Tiara Yachts Inc
  • Viking Yacht Co.
  • White River Marine Group
  • Yamaha Motor Co Ltd

Qualitative and quantitative analysis of companies has been conducted to help clients understand the wider business environment as well as the strengths and weaknesses of key industry players. Data is qualitatively analyzed to categorize companies as pure play, category-focused, industry-focused, and diversified; it is quantitatively analyzed to categorize companies as dominant, leading, strong, tentative, and weak.

Recent Development and News in Recreational boats market

  • In March, 2025, Groupe Beneteau announced a collaboration with the Alpine Formula One team to develop joint projects and limited-edition products, leveraging high-performance automotive design to appeal to luxury consumers.
  • In June, 2025, Yamaha Motor Co. Ltd. scheduled the launch of its next-generation HARMO boat control system in Japan, integrating electric propulsion with advanced steering for silent, maneuverable operations in coastal environments.
  • In September, 2025, Malibu Boats, Inc. announced the global launch of the 2026 Wakesetter 21 LX, engineered with high-performance ballast systems to deliver professional-grade wake performance in a compact, towable design.
  • In November, 2025, Benetti Yachts announced the integration of artificial intelligence into its yacht production processes to optimize structural engineering and reduce material waste, marking a pivot toward digital manufacturing in the luxury segment.

Dive into Technavio’s robust research methodology, blending expert interviews, extensive data synthesis, and validated models for unparalleled Recreational Boats Market insights. See full methodology.

Market Scope
Page number 288
Base year 2025
Historic period 2020-2024
Forecast period 2026-2030
Growth momentum & CAGR Accelerate at a CAGR of 6.6%
Market growth 2026-2030 USD 7751.7 million
Market structure Fragmented
YoY growth 2025-2026(%) 5.9%
Key countries US, Canada, Mexico, China, Japan, South Korea, India, Australia, Indonesia, Italy, France, Germany, UK, Spain, The Netherlands, Brazil, Argentina, Colombia, Saudi Arabia, South Africa, UAE, Turkey and Egypt
Competitive landscape Leading Companies, Market Positioning of Companies, Competitive Strategies, and Industry Risks

Request Free Sample

Research Analyst Overview

  • The Recreational Boats Market is characterized by a profound structural shift toward technological sophistication and sustainable practices. The integration of digital fly-by-wire controls, electronic station-keeping, and advanced digital cockpits is becoming standard, moving beyond luxury segments into mainstream crossover boats. This evolution is driven by consumer demand for intuitive operation and enhanced safety.
  • A key boardroom consideration is aligning product development with stringent maritime decarbonization mandates, which compels investment in marine electrification and hybrid propulsion systems. For instance, engineering teams using AI-driven simulations for deep-V hull designs have demonstrated the ability to improve fuel efficiency by over 10% before a physical prototype is built.
  • This transition involves adopting high-energy-density lithium-ion batteries, hydro-generation systems, and lightweight materials like bio-resins and carbon fiber components. The industry is also focused on bespoke nautical architecture, offering custom wave-shaping technology and other personalized features to differentiate in a competitive landscape.

What are the Key Data Covered in this Recreational Boats Market Research and Growth Report?

  • What is the expected growth of the Recreational Boats Market between 2026 and 2030?

    • USD 7.75 billion, at a CAGR of 6.6%

  • What segmentation does the market report cover?

    • The report is segmented by Type (Sailboats, Personal watercrafts (PWC), and Inflatables), Product Type (Outboards, and Inboard), Application (Cruising, Fishing, and Watersports) and Geography (North America, APAC, Europe, South America, Middle East and Africa)

  • Which regions are analyzed in the report?

    • North America, APAC, Europe, South America and Middle East and Africa

  • What are the key growth drivers and market challenges?

    • Technological democratization and integration of autonomous systems, Inventory overhang and de-stocking pressures in retail channels

  • Who are the major players in the Recreational Boats Market?

    • Azimut Benetti SpA, Bavaria Yachtbau GmbH, Brunswick Corp., Damen Yachting BV, Feadship Holland BV, FERRETTI SpA, Grady White Boats Inc., Groupe Beneteau, Hobie Cat Co. II LLC, Malibu Boats Inc., Marine Products Corp., MasterCraft Boat Holdings Inc., Princess Yachts Ltd., Sanlorenzo Spa, Sunseeker International, Tiara Yachts Inc, Viking Yacht Co., White River Marine Group and Yamaha Motor Co Ltd

Market Research Insights

  • The market's dynamics are shaped by a push for versatile vessel design and greater accessibility through the shared economy model. This trend toward multi-mission vessels maximizes asset utility, with some peer-to-peer boat sharing platforms reporting up to a 25% increase in usage compared to privately owned boats.
  • The integration of premium amenities and social connectivity features caters to a younger demographic interested in family-oriented coastal recreation. This focus on user experience is supported by technological advancements; for example, remote diagnostics capabilities can predict maintenance needs with over 80% accuracy, directly addressing after-sales service gaps.
  • The expansion of maritime tourism and infrastructure further fuels demand for luxury charter services, broadening the market beyond traditional ownership.

We can help! Our analysts can customize this recreational boats market research report to meet your requirements.

Get in touch

1. Executive Summary

1.1 Market overview

Executive Summary - Chart on Market Overview
Executive Summary - Data Table on Market Overview
Executive Summary - Chart on Global Market Characteristics
Executive Summary - Chart on Market by Geography
Executive Summary - Chart on Market Segmentation by Type
Executive Summary - Chart on Market Segmentation by Product Type
Executive Summary - Chart on Market Segmentation by Application
Executive Summary - Chart on Incremental Growth
Executive Summary - Data Table on Incremental Growth
Executive Summary - Chart on Company Market Positioning

2. Technavio Analysis

2.1 Analysis of price sensitivity, lifecycle, customer purchase basket, adoption rates, and purchase criteria

2.2 Criticality of inputs and Factors of differentiation

Chart on Overview on criticality of inputs and factors of differentiation

2.3 Factors of disruption

Chart on Overview on factors of disruption

2.4 Impact of drivers and challenges

Chart on Impact of drivers and challenges in 2025 and 2030

3. Market Landscape

3.1 Market ecosystem

Chart on Parent Market
Data Table on - Parent Market

3.2 Market characteristics

Chart on Market characteristics analysis

3.3 Value chain analysis

Chart on Value chain analysis

4. Market Sizing

4.1 Market definition

Data Table on Offerings of companies included in the market definition

4.2 Market segment analysis

Market segments

4.3 Market size 2025

4.4 Market outlook: Forecast for 2025-2030

Chart on Global - Market size and forecast 2025-2030 ($ million)
Data Table on Global - Market size and forecast 2025-2030 ($ million)
Chart on Global Market: Year-over-year growth 2025-2030 (%)
Data Table on Global Market: Year-over-year growth 2025-2030 (%)

5. Historic Market Size

5.1 Global Recreational Boats Market 2020 - 2024

Historic Market Size - Data Table on Global Recreational Boats Market 2020 - 2024 ($ million)

5.2 Type segment analysis 2020 - 2024

Historic Market Size - Type Segment 2020 - 2024 ($ million)

5.3 Product Type segment analysis 2020 - 2024

Historic Market Size - Product Type Segment 2020 - 2024 ($ million)

5.4 Application segment analysis 2020 - 2024

Historic Market Size - Application Segment 2020 - 2024 ($ million)

5.5 Geography segment analysis 2020 - 2024

Historic Market Size - Geography Segment 2020 - 2024 ($ million)

5.6 Country segment analysis 2020 - 2024

Historic Market Size - Country Segment 2020 - 2024 ($ million)

6. Qualitative Analysis

6.1 Impact of AI on global recreational boats market

6.2 Impact of geopolitical conflicts on global recreational boats market

7. Five Forces Analysis

7.1 Five forces summary

Five forces analysis - Comparison between 2025 and 2030

7.2 Bargaining power of buyers

Bargaining power of buyers - Impact of key factors 2025 and 2030

7.3 Bargaining power of suppliers

Bargaining power of suppliers - Impact of key factors in 2025 and 2030

7.4 Threat of new entrants

Threat of new entrants - Impact of key factors in 2025 and 2030

7.5 Threat of substitutes

Threat of substitutes - Impact of key factors in 2025 and 2030

7.6 Threat of rivalry

Threat of rivalry - Impact of key factors in 2025 and 2030

7.7 Market condition

Chart on Market condition - Five forces 2025 and 2030

8. Market Segmentation by Type

8.1 Market segments

Chart on Type - Market share 2025-2030 (%)
Data Table on Type - Market share 2025-2030 (%)

8.2 Comparison by Type

Chart on Comparison by Type
Data Table on Comparison by Type

8.3 Sailboats - Market size and forecast 2025-2030

Chart on Sailboats - Market size and forecast 2025-2030 ($ million)
Data Table on Sailboats - Market size and forecast 2025-2030 ($ million)
Chart on Sailboats - Year-over-year growth 2025-2030 (%)
Data Table on Sailboats - Year-over-year growth 2025-2030 (%)

8.4 Personal watercrafts (PWC) - Market size and forecast 2025-2030

Chart on Personal watercrafts (PWC) - Market size and forecast 2025-2030 ($ million)
Data Table on Personal watercrafts (PWC) - Market size and forecast 2025-2030 ($ million)
Chart on Personal watercrafts (PWC) - Year-over-year growth 2025-2030 (%)
Data Table on Personal watercrafts (PWC) - Year-over-year growth 2025-2030 (%)

8.5 Inflatables - Market size and forecast 2025-2030

Chart on Inflatables - Market size and forecast 2025-2030 ($ million)
Data Table on Inflatables - Market size and forecast 2025-2030 ($ million)
Chart on Inflatables - Year-over-year growth 2025-2030 (%)
Data Table on Inflatables - Year-over-year growth 2025-2030 (%)

8.6 Market opportunity by Type

Market opportunity by Type ($ million)
Data Table on Market opportunity by Type ($ million)

9. Market Segmentation by Product Type

9.1 Market segments

Chart on Product Type - Market share 2025-2030 (%)
Data Table on Product Type - Market share 2025-2030 (%)

9.2 Comparison by Product Type

Chart on Comparison by Product Type
Data Table on Comparison by Product Type

9.3 Outboards - Market size and forecast 2025-2030

Chart on Outboards - Market size and forecast 2025-2030 ($ million)
Data Table on Outboards - Market size and forecast 2025-2030 ($ million)
Chart on Outboards - Year-over-year growth 2025-2030 (%)
Data Table on Outboards - Year-over-year growth 2025-2030 (%)

9.4 Inboard - Market size and forecast 2025-2030

Chart on Inboard - Market size and forecast 2025-2030 ($ million)
Data Table on Inboard - Market size and forecast 2025-2030 ($ million)
Chart on Inboard - Year-over-year growth 2025-2030 (%)
Data Table on Inboard - Year-over-year growth 2025-2030 (%)

9.5 Market opportunity by Product Type

Market opportunity by Product Type ($ million)
Data Table on Market opportunity by Product Type ($ million)

10. Market Segmentation by Application

10.1 Market segments

Chart on Application - Market share 2025-2030 (%)
Data Table on Application - Market share 2025-2030 (%)

10.2 Comparison by Application

Chart on Comparison by Application
Data Table on Comparison by Application

10.3 Cruising - Market size and forecast 2025-2030

Chart on Cruising - Market size and forecast 2025-2030 ($ million)
Data Table on Cruising - Market size and forecast 2025-2030 ($ million)
Chart on Cruising - Year-over-year growth 2025-2030 (%)
Data Table on Cruising - Year-over-year growth 2025-2030 (%)

10.4 Fishing - Market size and forecast 2025-2030

Chart on Fishing - Market size and forecast 2025-2030 ($ million)
Data Table on Fishing - Market size and forecast 2025-2030 ($ million)
Chart on Fishing - Year-over-year growth 2025-2030 (%)
Data Table on Fishing - Year-over-year growth 2025-2030 (%)

10.5 Watersports - Market size and forecast 2025-2030

Chart on Watersports - Market size and forecast 2025-2030 ($ million)
Data Table on Watersports - Market size and forecast 2025-2030 ($ million)
Chart on Watersports - Year-over-year growth 2025-2030 (%)
Data Table on Watersports - Year-over-year growth 2025-2030 (%)

10.6 Market opportunity by Application

Market opportunity by Application ($ million)
Data Table on Market opportunity by Application ($ million)

11. Customer Landscape

11.1 Customer landscape overview

Analysis of price sensitivity, lifecycle, customer purchase basket, adoption rates, and purchase criteria

12. Geographic Landscape

12.1 Geographic segmentation

Chart on Market share by geography 2025-2030 (%)
Data Table on Market share by geography 2025-2030 (%)

12.2 Geographic comparison

Chart on Geographic comparison
Data Table on Geographic comparison

12.3 North America - Market size and forecast 2025-2030

Chart on North America - Market size and forecast 2025-2030 ($ million)
Data Table on North America - Market size and forecast 2025-2030 ($ million)
Chart on North America - Year-over-year growth 2025-2030 (%)
Data Table on North America - Year-over-year growth 2025-2030 (%)
Chart on Regional Comparison - North America
Data Table on Regional Comparison - North America

12.3.1 US - Market size and forecast 2025-2030

Chart on US - Market size and forecast 2025-2030 ($ million)
Data Table on US - Market size and forecast 2025-2030 ($ million)
Chart on US - Year-over-year growth 2025-2030 (%)
Data Table on US - Year-over-year growth 2025-2030 (%)

12.3.2 Canada - Market size and forecast 2025-2030

Chart on Canada - Market size and forecast 2025-2030 ($ million)
Data Table on Canada - Market size and forecast 2025-2030 ($ million)
Chart on Canada - Year-over-year growth 2025-2030 (%)
Data Table on Canada - Year-over-year growth 2025-2030 (%)

12.3.3 Mexico - Market size and forecast 2025-2030

Chart on Mexico - Market size and forecast 2025-2030 ($ million)
Data Table on Mexico - Market size and forecast 2025-2030 ($ million)
Chart on Mexico - Year-over-year growth 2025-2030 (%)
Data Table on Mexico - Year-over-year growth 2025-2030 (%)

12.4 APAC - Market size and forecast 2025-2030

Chart on APAC - Market size and forecast 2025-2030 ($ million)
Data Table on APAC - Market size and forecast 2025-2030 ($ million)
Chart on APAC - Year-over-year growth 2025-2030 (%)
Data Table on APAC - Year-over-year growth 2025-2030 (%)
Chart on Regional Comparison - APAC
Data Table on Regional Comparison - APAC

12.4.1 China - Market size and forecast 2025-2030

Chart on China - Market size and forecast 2025-2030 ($ million)
Data Table on China - Market size and forecast 2025-2030 ($ million)
Chart on China - Year-over-year growth 2025-2030 (%)
Data Table on China - Year-over-year growth 2025-2030 (%)

12.4.2 Japan - Market size and forecast 2025-2030

Chart on Japan - Market size and forecast 2025-2030 ($ million)
Data Table on Japan - Market size and forecast 2025-2030 ($ million)
Chart on Japan - Year-over-year growth 2025-2030 (%)
Data Table on Japan - Year-over-year growth 2025-2030 (%)

12.4.3 South Korea - Market size and forecast 2025-2030

Chart on South Korea - Market size and forecast 2025-2030 ($ million)
Data Table on South Korea - Market size and forecast 2025-2030 ($ million)
Chart on South Korea - Year-over-year growth 2025-2030 (%)
Data Table on South Korea - Year-over-year growth 2025-2030 (%)

12.4.4 India - Market size and forecast 2025-2030

Chart on India - Market size and forecast 2025-2030 ($ million)
Data Table on India - Market size and forecast 2025-2030 ($ million)
Chart on India - Year-over-year growth 2025-2030 (%)
Data Table on India - Year-over-year growth 2025-2030 (%)

12.4.5 Australia - Market size and forecast 2025-2030

Chart on Australia - Market size and forecast 2025-2030 ($ million)
Data Table on Australia - Market size and forecast 2025-2030 ($ million)
Chart on Australia - Year-over-year growth 2025-2030 (%)
Data Table on Australia - Year-over-year growth 2025-2030 (%)

12.4.6 Indonesia - Market size and forecast 2025-2030

Chart on Indonesia - Market size and forecast 2025-2030 ($ million)
Data Table on Indonesia - Market size and forecast 2025-2030 ($ million)
Chart on Indonesia - Year-over-year growth 2025-2030 (%)
Data Table on Indonesia - Year-over-year growth 2025-2030 (%)

12.5 Europe - Market size and forecast 2025-2030

Chart on Europe - Market size and forecast 2025-2030 ($ million)
Data Table on Europe - Market size and forecast 2025-2030 ($ million)
Chart on Europe - Year-over-year growth 2025-2030 (%)
Data Table on Europe - Year-over-year growth 2025-2030 (%)
Chart on Regional Comparison - Europe
Data Table on Regional Comparison - Europe

12.5.1 Italy - Market size and forecast 2025-2030

Chart on Italy - Market size and forecast 2025-2030 ($ million)
Data Table on Italy - Market size and forecast 2025-2030 ($ million)
Chart on Italy - Year-over-year growth 2025-2030 (%)
Data Table on Italy - Year-over-year growth 2025-2030 (%)

12.5.2 France - Market size and forecast 2025-2030

Chart on France - Market size and forecast 2025-2030 ($ million)
Data Table on France - Market size and forecast 2025-2030 ($ million)
Chart on France - Year-over-year growth 2025-2030 (%)
Data Table on France - Year-over-year growth 2025-2030 (%)

12.5.3 Germany - Market size and forecast 2025-2030

Chart on Germany - Market size and forecast 2025-2030 ($ million)
Data Table on Germany - Market size and forecast 2025-2030 ($ million)
Chart on Germany - Year-over-year growth 2025-2030 (%)
Data Table on Germany - Year-over-year growth 2025-2030 (%)

12.5.4 UK - Market size and forecast 2025-2030

Chart on UK - Market size and forecast 2025-2030 ($ million)
Data Table on UK - Market size and forecast 2025-2030 ($ million)
Chart on UK - Year-over-year growth 2025-2030 (%)
Data Table on UK - Year-over-year growth 2025-2030 (%)

12.5.5 Spain - Market size and forecast 2025-2030

Chart on Spain - Market size and forecast 2025-2030 ($ million)
Data Table on Spain - Market size and forecast 2025-2030 ($ million)
Chart on Spain - Year-over-year growth 2025-2030 (%)
Data Table on Spain - Year-over-year growth 2025-2030 (%)

12.5.6 The Netherlands - Market size and forecast 2025-2030

Chart on The Netherlands - Market size and forecast 2025-2030 ($ million)
Data Table on The Netherlands - Market size and forecast 2025-2030 ($ million)
Chart on The Netherlands - Year-over-year growth 2025-2030 (%)
Data Table on The Netherlands - Year-over-year growth 2025-2030 (%)

12.6 South America - Market size and forecast 2025-2030

Chart on South America - Market size and forecast 2025-2030 ($ million)
Data Table on South America - Market size and forecast 2025-2030 ($ million)
Chart on South America - Year-over-year growth 2025-2030 (%)
Data Table on South America - Year-over-year growth 2025-2030 (%)
Chart on Regional Comparison - South America
Data Table on Regional Comparison - South America

12.6.1 Brazil - Market size and forecast 2025-2030

Chart on Brazil - Market size and forecast 2025-2030 ($ million)
Data Table on Brazil - Market size and forecast 2025-2030 ($ million)
Chart on Brazil - Year-over-year growth 2025-2030 (%)
Data Table on Brazil - Year-over-year growth 2025-2030 (%)

12.6.2 Argentina - Market size and forecast 2025-2030

Chart on Argentina - Market size and forecast 2025-2030 ($ million)
Data Table on Argentina - Market size and forecast 2025-2030 ($ million)
Chart on Argentina - Year-over-year growth 2025-2030 (%)
Data Table on Argentina - Year-over-year growth 2025-2030 (%)

12.6.3 Colombia - Market size and forecast 2025-2030

Chart on Colombia - Market size and forecast 2025-2030 ($ million)
Data Table on Colombia - Market size and forecast 2025-2030 ($ million)
Chart on Colombia - Year-over-year growth 2025-2030 (%)
Data Table on Colombia - Year-over-year growth 2025-2030 (%)

12.7 Middle East and Africa - Market size and forecast 2025-2030

Chart on Middle East and Africa - Market size and forecast 2025-2030 ($ million)
Data Table on Middle East and Africa - Market size and forecast 2025-2030 ($ million)
Chart on Middle East and Africa - Year-over-year growth 2025-2030 (%)
Data Table on Middle East and Africa - Year-over-year growth 2025-2030 (%)
Chart on Regional Comparison - Middle East and Africa
Data Table on Regional Comparison - Middle East and Africa

12.7.1 Saudi Arabia - Market size and forecast 2025-2030

Chart on Saudi Arabia - Market size and forecast 2025-2030 ($ million)
Data Table on Saudi Arabia - Market size and forecast 2025-2030 ($ million)
Chart on Saudi Arabia - Year-over-year growth 2025-2030 (%)
Data Table on Saudi Arabia - Year-over-year growth 2025-2030 (%)

12.7.2 South Africa - Market size and forecast 2025-2030

Chart on South Africa - Market size and forecast 2025-2030 ($ million)
Data Table on South Africa - Market size and forecast 2025-2030 ($ million)
Chart on South Africa - Year-over-year growth 2025-2030 (%)
Data Table on South Africa - Year-over-year growth 2025-2030 (%)

12.7.3 UAE - Market size and forecast 2025-2030

Chart on UAE - Market size and forecast 2025-2030 ($ million)
Data Table on UAE - Market size and forecast 2025-2030 ($ million)
Chart on UAE - Year-over-year growth 2025-2030 (%)
Data Table on UAE - Year-over-year growth 2025-2030 (%)

12.7.4 Turkey - Market size and forecast 2025-2030

Chart on Turkey - Market size and forecast 2025-2030 ($ million)
Data Table on Turkey - Market size and forecast 2025-2030 ($ million)
Chart on Turkey - Year-over-year growth 2025-2030 (%)
Data Table on Turkey - Year-over-year growth 2025-2030 (%)

12.7.5 Egypt - Market size and forecast 2025-2030

Chart on Egypt - Market size and forecast 2025-2030 ($ million)
Data Table on Egypt - Market size and forecast 2025-2030 ($ million)
Chart on Egypt - Year-over-year growth 2025-2030 (%)
Data Table on Egypt - Year-over-year growth 2025-2030 (%)

12.8 Market opportunity by geography

Market opportunity by geography ($ million)
Data Tables on Market opportunity by geography ($ million)

13. Drivers, Challenges, and Opportunity

13.1 Market drivers

Technological democratization and integration of autonomous systems
Expansion of multi-generational leisure and versatile vessel design
Strategic growth in marine tourism and shared economy

13.2 Market challenges

Inventory overhang and de-stocking pressures in retail channels
Restrictive regulatory environments and maritime decarbonization mandates
Shortage of specialized marine technicians and after-sales service gaps

13.3 Impact of drivers and challenges

Impact of drivers and challenges in 2025 and 2030

13.4 Market opportunities

Acceleration of marine electrification and sustainable propulsion
Growth of smart connectivity and internet of boats
Rise of personalization and bespoke nautical architecture

14. Competitive Landscape

14.1 Overview

14.2

Overview on criticality of inputs and factors of differentiation

14.3 Landscape disruption

Overview on factors of disruption

14.4 Industry risks

Impact of key risks on business

15. Competitive Analysis

15.1 Companies profiled

Companies covered

15.2 Company ranking index

15.3 Market positioning of companies

Matrix on companies position and classification

15.4 Azimut Benetti SpA

Azimut Benetti SpA - Overview
Azimut Benetti SpA - Product / Service
Azimut Benetti SpA - Key offerings
SWOT

15.5 Brunswick Corp.

Brunswick Corp. - Overview
Brunswick Corp. - Business segments
Brunswick Corp. - Key news
Brunswick Corp. - Key offerings
Brunswick Corp. - Segment focus
SWOT

15.6 Damen Yachting BV

Damen Yachting BV - Overview
Damen Yachting BV - Product / Service
Damen Yachting BV - Key offerings
SWOT

15.7 Groupe Beneteau

Groupe Beneteau - Overview
Groupe Beneteau - Business segments
Groupe Beneteau - Key offerings
Groupe Beneteau - Segment focus
SWOT

15.8 Hobie Cat Co. II LLC

Hobie Cat Co. II LLC - Overview
Hobie Cat Co. II LLC - Product / Service
Hobie Cat Co. II LLC - Key offerings
SWOT

15.9 Malibu Boats Inc.

Malibu Boats Inc. - Overview
Malibu Boats Inc. - Business segments
Malibu Boats Inc. - Key offerings
Malibu Boats Inc. - Segment focus
SWOT

15.10 Marine Products Corp.

Marine Products Corp. - Overview
Marine Products Corp. - Product / Service
Marine Products Corp. - Key offerings
SWOT

15.11 MasterCraft Boat Holdings Inc.

MasterCraft Boat Holdings Inc. - Overview
MasterCraft Boat Holdings Inc. - Business segments
MasterCraft Boat Holdings Inc. - Key offerings
MasterCraft Boat Holdings Inc. - Segment focus
SWOT

15.12 Princess Yachts Ltd.

Princess Yachts Ltd. - Overview
Princess Yachts Ltd. - Product / Service
Princess Yachts Ltd. - Key offerings
SWOT

15.13 Sanlorenzo Spa

Sanlorenzo Spa - Overview
Sanlorenzo Spa - Product / Service
Sanlorenzo Spa - Key offerings
SWOT

15.14 Sunseeker International

Sunseeker International - Overview
Sunseeker International - Product / Service
Sunseeker International - Key offerings
SWOT

15.15 Tiara Yachts Inc

Tiara Yachts Inc - Overview
Tiara Yachts Inc - Product / Service
Tiara Yachts Inc - Key offerings
SWOT

15.16 Viking Yacht Co.

Viking Yacht Co. - Overview
Viking Yacht Co. - Product / Service
Viking Yacht Co. - Key offerings
SWOT

15.17 White River Marine Group

White River Marine Group - Overview
White River Marine Group - Product / Service
White River Marine Group - Key offerings
SWOT

15.18 Yamaha Motor Co Ltd

Yamaha Motor Co Ltd - Overview
Yamaha Motor Co Ltd - Business segments
Yamaha Motor Co Ltd - Key offerings
Yamaha Motor Co Ltd - Segment focus
SWOT

16. Appendix

16.1 Scope of the report

Market definition
Objectives
Notes and caveats

16.2 Inclusions and exclusions checklist

Inclusions checklist
Exclusions checklist

16.3 Currency conversion rates for US$

16.4 Research methodology

16.5 Data procurement

Information sources

16.6 Data validation

16.7 Validation techniques employed for market sizing

16.8 Data synthesis

16.9 360 degree market analysis

16.10 List of abbreviations

Research Methodology

Technavio presents a detailed picture of the market by way of study, synthesis, and summation of data from multiple sources. The analysts have presented the various facets of the market with a particular focus on identifying the key industry influencers. The data thus presented is comprehensive, reliable, and the result of extensive research, both primary and secondary.

INFORMATION SOURCES

Primary sources

  • Manufacturers and suppliers
  • Channel partners
  • Industry experts
  • Strategic decision makers

Secondary sources

  • Industry journals and periodicals
  • Government data
  • Financial reports of key industry players
  • Historical data
  • Press releases

DATA ANALYSIS

Data Synthesis

  • Collation of data
  • Estimation of key figures
  • Analysis of derived insights

Data Validation

  • Triangulation with data models
  • Reference against proprietary databases
  • Corroboration with industry experts

REPORT WRITING

Qualitative

  • Market drivers
  • Market challenges
  • Market trends
  • Five forces analysis

Quantitative

  • Market size and forecast
  • Market segmentation
  • Geographical insights
  • Competitive landscape

Interested in this report?

Get your sample now to see our research methodology and insights!

Download Now

Frequently Asked Questions

Recreational Boats market growth will increase by USD 7751.7 million during 2026-2030.

The Recreational Boats market is expected to grow at a CAGR of 6.6% during 2026-2030.

Recreational Boats market is segmented by Type (Sailboats, Personal watercrafts (PWC), Inflatables) Product type (Outboards, Inboard) Application (Cruising, Fishing, Watersports)

Azimut Benetti SpA, Bavaria Yachtbau GmbH, Brunswick Corp., Damen Yachting BV, Feadship Holland BV, FERRETTI SpA, Grady White Boats Inc., Groupe Beneteau, Hobie Cat Co. II LLC, Malibu Boats Inc., Marine Products Corp., MasterCraft Boat Holdings Inc., Princess Yachts Ltd., Sanlorenzo Spa, Sunseeker International, Tiara Yachts Inc, Viking Yacht Co., White River Marine Group, Yamaha Motor Co Ltd are a few of the key vendors in the Recreational Boats market.

North America will register the highest growth rate of 49.3% among the other regions. Therefore, the Recreational Boats market in North America is expected to garner significant business opportunities for the vendors during the forecast period.

US, Canada, Mexico, China, Japan, South Korea, India, Australia, Indonesia, Italy, France, Germany, UK, Spain, The Netherlands, Brazil, Argentina, Colombia, Saudi Arabia, South Africa, UAE, Turkey, Egypt

  • Technological democratization and integration of autonomous systems is the driving factor this market.

The Recreational Boats market vendors should focus on grabbing business opportunities from the Type segment as it accounted for the largest market share in the base year.
RIA - Research AI Assistant
Ask RIA