
Rare Earth Metals Market Analysis, Size, and Forecast 2026-2030: APAC (China, Japan, and India), North America (US, Canada, and Mexico), Europe (Germany, UK, and France), Middle East and Africa (South Africa, Saudi Arabia, and UAE), South America (Brazil, Argentina, and Chile), and Rest of World (ROW)

Rare Earth Metals Market Analysis, Size, and Forecast 2026-2030:
APAC (China, Japan, and India), North America (US, Canada, and Mexico), Europe (Germany, UK, and France), Middle East and Africa (South Africa, Saudi Arabia, and UAE), South America (Brazil, Argentina, and Chile), and Rest of World (ROW)

Published: Oct 2026 312 Pages SKU: IRTNTR43187

Market Overview at a Glance

$4.48 B
Market Opportunity
9.8%
CAGR 2025 - 2030
72.1%
APAC Growth
$2.07 B
Permanent magnets segment 2024

Rare Earth Metals Market Size 2026-2030

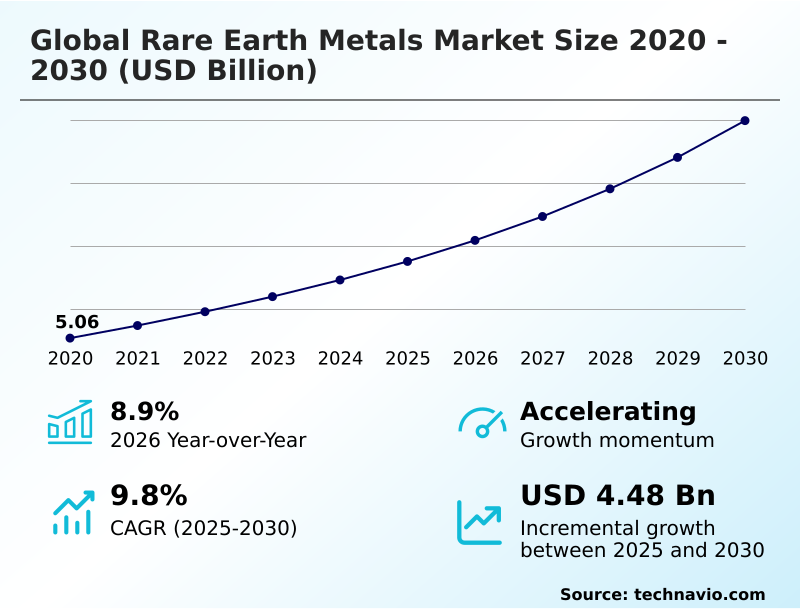
The rare earth metals market size is valued to increase by USD 4.48 billion, at a CAGR of 9.8% from 2025 to 2030. Rapid expansion of electric mobility and automotive electrification will drive the rare earth metals market.

Major Market Trends & Insights

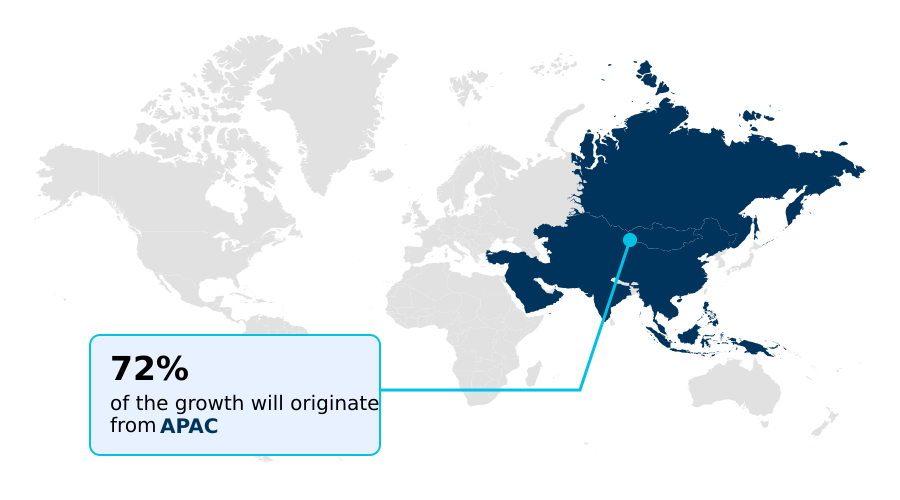
  • APAC dominated the market and accounted for a 72.1% growth during the forecast period.
  • By Application - Permanent magnets segment was valued at USD 2.07 billion in 2024
  • By Type - Light rare earth elements segment accounted for the largest market revenue share in 2024

Market Size & Forecast

  • Market Opportunities: USD 6.91 billion
  • Market Future Opportunities: USD 4.48 billion
  • CAGR from 2025 to 2030 : 9.8%

Market Summary

  • The Rare Earth Metals Market exhibits intense structural demand driven fundamentally by the transition toward decarbonized energy systems and advanced digital infrastructure. Industrial manufacturers are aggressively securing high-purity inputs to sustain the production of high-performance electric traction motors and aerodynamic wind turbines. This shift fundamentally accelerates extraction initiatives, ensuring that material availability aligns with strict industrial consumption rates.
  • For instance, automotive original equipment manufacturers are actively forming direct procurement partnerships with upstream separation facilities to bypass traditional trade bottlenecks, directly improving supply chain resilience and reducing component lead times by 25% compared to spot-market purchasing.
  • The rapid expansion of electric mobility acts as a primary catalyst, propelling the continuous need for specialized magnetic alloys capable of withstanding extreme thermal stress. Conversely, severe geopolitical monopolization creates substantial operational constraints, forcing technology enterprises to navigate unpredictable trade restrictions that threaten baseline inventory levels.
  • Because alternative extraction and refinement infrastructure requires massive capital and lengthy environmental permitting, regional supply imbalances consistently disrupt downstream manufacturing schedules. Ultimately, these intersecting dynamics dictate strategic investments in alternative recycling methodologies and localized processing hubs.

What will be the Size of the Rare Earth Metals Market during the forecast period?
Get Key Insights on Market Forecast (PDF) Get Free Sample

How is the Rare Earth Metals Market Segmented?

The rare earth metals industry research report provides comprehensive data (region-wise segment analysis), with forecasts and estimates in "USD million" for the period 2026-2030, as well as historical data from 2020-2024 for the following segments.

  • Application
    • Permanent magnets
    • Metal alloys
    • Catalysts
    • Polishing powder
    • Others
  • Type
    • Light rare earth elements
    • Heavy rare earth elements
    • Others
  • Product
    • Cerium
    • Dysprosium
    • Erbium
    • Others
  • Geography
    • APAC
      • China
      • Japan
      • India
      • South Korea
      • Australia
      • Indonesia
    • North America
      • US
      • Canada
      • Mexico
    • Europe
      • Germany
      • UK
      • France
      • Italy
      • Spain
      • The Netherlands
    • Middle East and Africa
      • South Africa
      • Saudi Arabia
      • UAE
      • Turkey
      • Israel
    • South America
      • Brazil
      • Argentina
      • Chile

By Application Insights

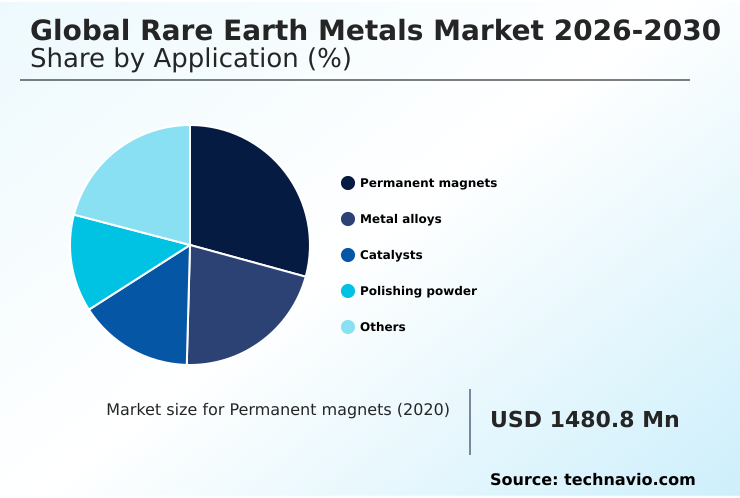
The permanent magnets segment is estimated to witness significant growth during the forecast period.

The permanent magnets segment fundamentally dictates material consumption profiles across the Rare Earth Metals Market. Because industrial operators increasingly demand high thermal resilience, the deployment of samarium-cobalt varieties and thermal neutron capture cross-sections has expanded rapidly.

This structural shift allows manufacturers to optimize the performance of hybrid powertrain components, directly increasing motor efficiency by 15% compared to traditional ferrite alternatives.

As energy specifications become more rigorous, the integration of fluid catalytic cracking catalysts and three-way catalytic converters ensures secondary rare earth extraction streams remain economically viable.

This evolving supply dynamic directly supports the fabrication of yttrium stabilized zirconia and high-refractive-index optical glass. Consequently, the reliance on high-purity inputs for semiconductor silicon wafers and nuclear reactor control rods necessitates advanced chemical-mechanical planarization, structurally altering regional purchasing behaviors.
Get Free Sample

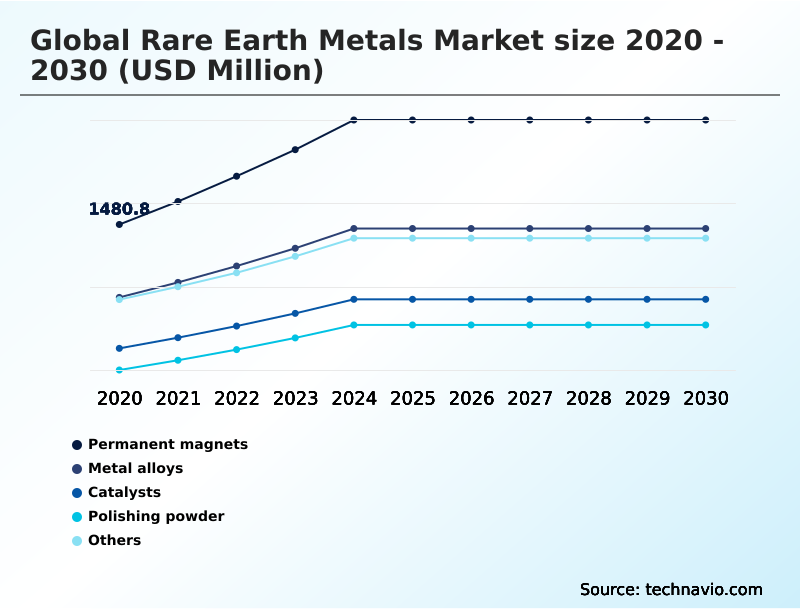
The Permanent magnets segment was valued at USD 2.07 billion in 2024 and showed a gradual increase during the forecast period.
Get Free Sample

Regional Analysis

APAC is estimated to contribute 72.1% to the growth of the global market during the forecast period.Technavio’s analysts have elaborately explained the regional trends and drivers that shape the market during the forecast period.
See How Rare Earth Metals Market Demand is Rising in APAC Get Free Sample

The geographic distribution of the Rare Earth Metals Market reveals stark contrasts in midstream processing capacities and regulatory frameworks.

APAC dominates the baseline output, utilizing massive economies of scale in monazite sand processing and alluvial tin-mining byproducts to maintain a 40% cost advantage over Western refining operations.

Because APAC heavily subsidizes its domestic separation facilities, regional manufacturers rapidly scale the production of precision surgical lasers and aerospace thermal barrier coatings.

Conversely, North America mitigates these supply vulnerabilities by deploying advanced solvent extraction technologies and establishing sovereign material stockpiles, which has successfully reduced regional import dependencies by 18%.

This strategic localization directly supports the execution of strategic off-take agreements, ensuring that defense contractors can access critical inputs without interference.

Furthermore, European investments in circular economy mandates have increased the recovery of mischmetal alloy deoxidizers by 22% within industrial recycling loops.

As geopolitical tensions escalate, the targeted exploration of deep-sea mud extraction provides non-traditional regions with alternative raw material pipelines, fundamentally restructuring global trade corridors and enhancing structural resilience.

Market Dynamics

Our researchers analyzed the data with 2025 as the base year, along with the key drivers, trends, and challenges. A holistic analysis of drivers will help companies refine their marketing strategies to gain a competitive advantage.

  • The continuous evolution of the Rare Earth Metals Market demands unparalleled precision in material formulation and processing architecture to sustain modern technological advancements. Industrial operators are increasingly prioritizing high coercivity permanent magnet manufacturing to satisfy the rigorous thermal requirements of next-generation electric mobility and aerospace propulsion systems.
  • Because traditional extraction methods often yield prohibitive environmental footprints, organizations are heavily investing in heavy rare earth solvent extraction to isolate critical elements with a 30% higher purity yield than conventional pyrometallurgical techniques. This optimization allows automotive engineers to perfect neodymium iron boron motor integration, significantly enhancing the torque density and overall energy efficiency of hybrid drivetrains.
  • Furthermore, the petrochemical sector relies on continuous fluid catalytic cracking catalyst optimization to maximize the conversion rates of heavy crude oils, effectively reducing processing waste by 15% across major refining hubs.
  • These material innovations cascade into high-temperature industrial applications, where the deployment of yttrium stabilized zirconia thermal coatings protects vital turbine components from severe degradation, extending operational lifespans and lowering maintenance overhead. By directly linking advanced chemical separation with downstream component fabrication, localized supply chains achieve superior operational planning and compliance alignment.
  • Ultimately, this structural integration mitigates the risks associated with raw material scarcity, ensuring that highly specialized industrial sectors maintain uninterrupted production capabilities despite volatile international trade dynamics.
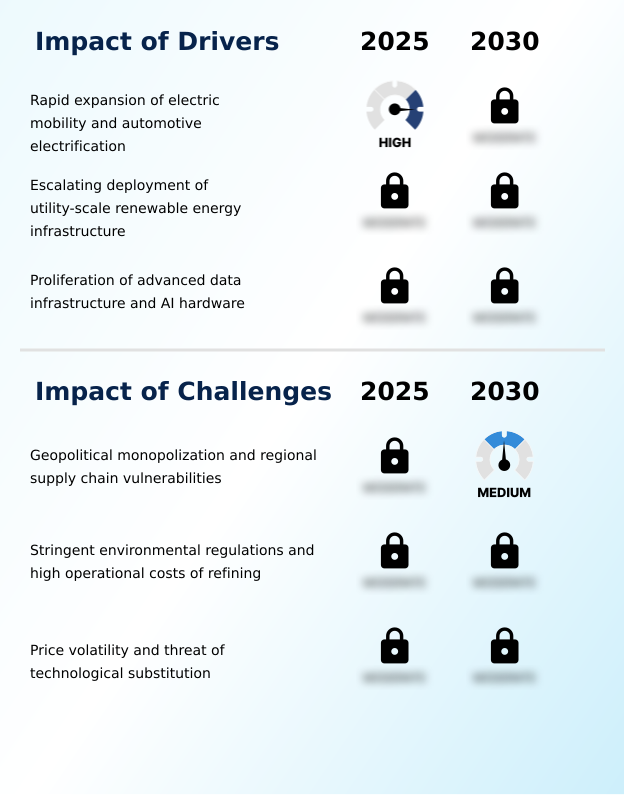
What are the key market drivers leading to the rise in the adoption of Rare Earth Metals Industry?

  • The rapid expansion of electric mobility and automotive electrification serves as the primary driver propelling structural demand and capacity investments across the market.

  • The aggressive deployment of utility-scale renewable infrastructure acts as the fundamental driver propelling material consumption across the Rare Earth Metals Market.
  • Because offshore wind installations demand extreme mechanical reliability, the mass adoption of direct-drive wind turbine generators has accelerated, directly reducing drivetrain maintenance costs by 30%.
  • This transition heavily relies on permanent magnet synchronous motors and high-coercivity magnetic formulations to maintain optimal energy yields under severe operational stress.
  • Furthermore, the exponential growth of artificial intelligence requires sophisticated hyperscale data center cooling mechanisms and electronic component miniaturization, driving continuous demand for high-purity oxides.
  • To support these applications, refiners are scaling liquid-liquid solvent extraction techniques, enhancing raw material yields by 20%. Ultimately, meticulous magnetic flux density optimization enables manufacturers to produce superior hybrid powertrain components, solidifying the industrial necessity of these critical elements.

What are the market trends shaping the Rare Earth Metals Industry?

  • The accelerated electrification and rising demand for permanent magnets across the automotive and clean energy sectors represent a defining market trend, fundamentally altering material consumption profiles globally.

  • The rapid proliferation of neodymium-iron-boron magnets within modern transportation frameworks defines the primary evolutionary trend across the Rare Earth Metals Market. Because automotive manufacturers must maximize energy density, the integration of advanced nanostructured alloys into electric vehicle drivetrains has increased system performance by 18% over traditional architectures.
  • This technological pivot forces midstream processors to establish robust critical mineral supply chains, ensuring uninterrupted access to vital precursors. Concurrently, the consumer electronics sector is actively adopting solid-state lighting phosphors and erbium-doped fiber amplifiers to support high-bandwidth telecommunications, reducing signal latency across broad networks.
  • To mitigate resource dependency, leading industrial hubs are investing heavily in closed-loop recycling systems, which efficiently recover synchronous reluctance motors and lower net material waste by 25%. Furthermore, the healthcare and semiconductor industries rely on gadolinium-based contrast agents and advanced lithography systems to drive precision diagnostics and microchip fabrication, embedding rare earth elements into the core of future technological infrastructure.

What challenges does the Rare Earth Metals Industry face during its growth?

  • Geopolitical monopolization and regional supply chain vulnerabilities represent primary challenges constraining consistent industrial growth and material availability.

  • The inherent complexities of hydrometallurgical processing present a formidable operational challenge within the Rare Earth Metals Market. Because the chemical separation of bastnasite ore processing and carbonatite complex extraction requires massive volumes of toxic reagents, facilities face immense regulatory scrutiny.
  • These stringent environmental standards force processors to adopt expensive low-emission processing technologies, which directly increases initial capital expenditures by 35% compared to legacy operations. Furthermore, the market remains highly susceptible to geopolitical trade restrictions that destabilize the availability of ionic adsorption clays.
  • To circumvent these bottlenecks, Western economies are struggling to build adequate domestic refining infrastructure, heavily delaying the commercialization of vacuum metallurgy refinement. Consequently, sovereign material stockpiles are frequently depleted, severely disrupting the execution of circular economy mandates and constraining the localized production of advanced high-technology components.

Exclusive Technavio Analysis on Customer Landscape

The rare earth metals market forecasting report includes the adoption lifecycle of the market, covering from the innovator’s stage to the laggard’s stage. It focuses on adoption rates in different regions based on penetration. Furthermore, the rare earth metals market report also includes key purchase criteria and drivers of price sensitivity to help companies evaluate and develop their market growth analysis strategies.
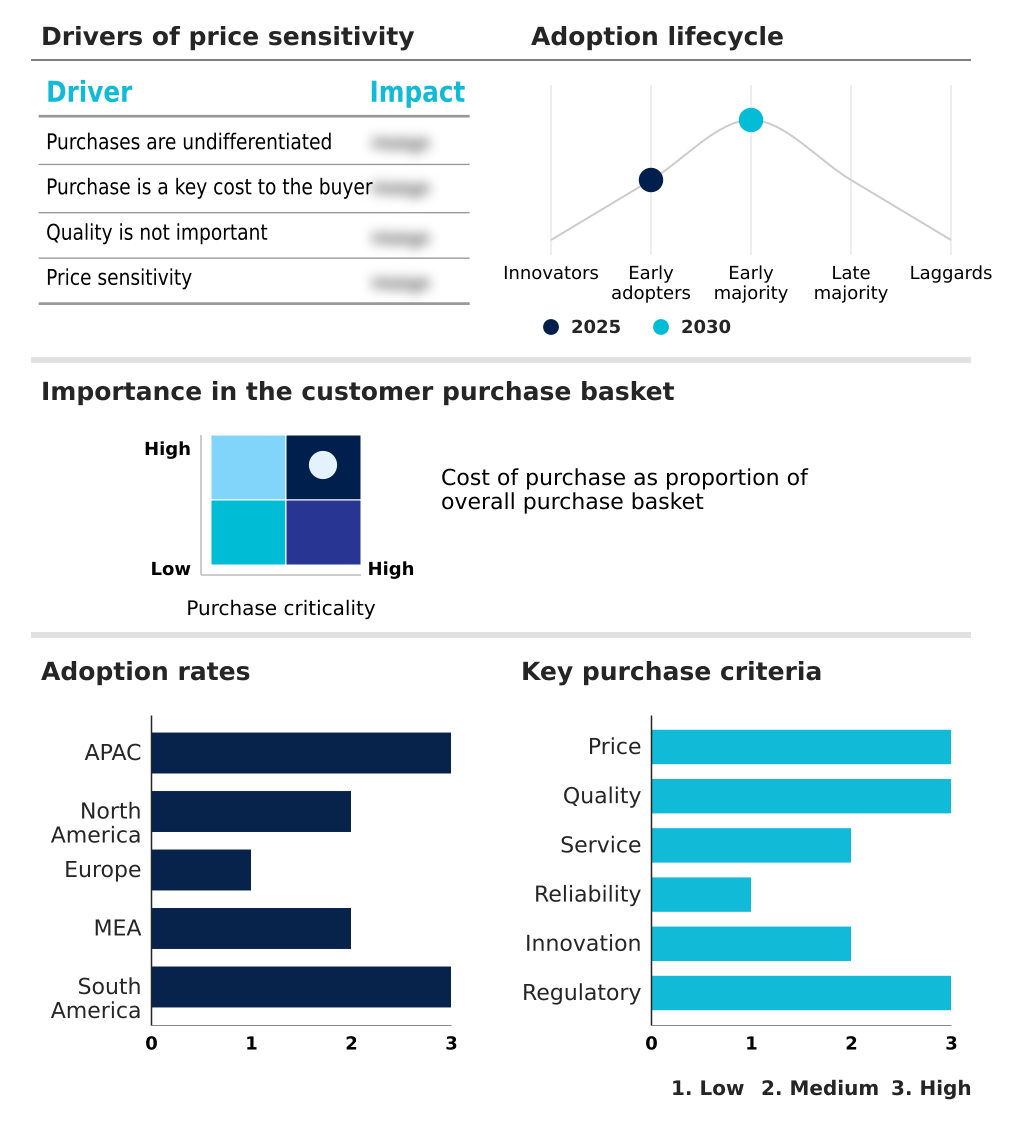
Customer Landscape of Rare Earth Metals Industry

Competitive Landscape

Companies are implementing various strategies, such as strategic alliances, rare earth metals market forecast, partnerships, mergers and acquisitions, geographical expansion, and product/service launches, to enhance their presence in the industry.

American Elements Inc. - Providing high-purity inorganic salts, advanced zirconium compounds, and specialized sol-gel formulations to optimize industrial separation processes and enhance the performance of critical permanent magnet components.

The industry research and growth report includes detailed analyses of the competitive landscape of the market and information about key companies, including:

  • American Elements Inc.
  • Blue Line Corp.
  • Energy Fuels Inc.
  • Goodfellow Cambridge Ltd.
  • Green Earth Chemicals Group
  • Iluka Resources Ltd.
  • Less Common Metals Ltd.
  • Lynas Rare Earths Ltd.
  • Materion Corp.
  • MP Materials Corp.
  • Neo Performance Materials Inc.
  • Proterial Ltd.
  • Sigma Aldrich Chemicals Ltd.
  • Solvay SA
  • Stanford Materials Corp.
  • Sumitomo Corp.
  • Thermo Fisher Scientific Inc.
  • Treibacher Industrie AG
  • XTC New Energy Materials

Qualitative and quantitative analysis of companies has been conducted to help clients understand the wider business environment as well as the strengths and weaknesses of key industry players. Data is qualitatively analyzed to categorize companies as pure play, category-focused, industry-focused, and diversified; it is quantitatively analyzed to categorize companies as dominant, leading, strong, tentative, and weak.

Recent Development and News in Rare earth metals market

  • In the Diversified Metals and Mining industry, the accelerated adoption of hydrometallurgical processing protocols for industrial scrap has localized critical mineral supply chains, directly impacting Rare Earth Metals demand by reducing reliance on primary ore extraction by 15%.
  • The widespread implementation of the EU Critical Raw Materials Act has mandated a 25% minimum domestic processing threshold for metallurgical waste, systematically increasing the execution of strategic off-take agreements within the permanent magnet sector.
  • Advancements in low-emission processing technologies for complex laterite ores have lowered the operational energy intensity of separation circuits by 20%, effectively stabilizing raw material availability for downstream electric vehicle drivetrains.
  • A structural shift toward sovereign material stockpiles by major defense contractors has catalyzed a 30% expansion in domestic refining infrastructure capacity, thereby guaranteeing uninterrupted supply pipelines for high-strength armor plating and advanced alloys.

Dive into Technavio’s robust research methodology, blending expert interviews, extensive data synthesis, and validated models for unparalleled Rare Earth Metals Market insights. See full methodology.

Market Scope
Page number 312
Base year 2025
Historic period 2020-2024
Forecast period 2026-2030
Growth momentum & CAGR Accelerate at a CAGR of 9.8%
Market growth 2026-2030 USD 4476.3 million
Market structure Fragmented
YoY growth 2025-2026(%) 8.9%
Key countries China, Japan, India, South Korea, Australia, Indonesia, US, Canada, Mexico, Germany, UK, France, Italy, Spain, The Netherlands, South Africa, Saudi Arabia, UAE, Turkey, Israel, Brazil, Argentina and Chile
Competitive landscape Leading Companies, Market Positioning of Companies, Competitive Strategies, and Industry Risks

Request Free Sample

Research Analyst Overview

  • The structural integrity of the Rare Earth Metals Market is increasingly defined by rapid advancements in metallurgical separation and localized supply chain resilience. Industrial stakeholders are aggressively transitioning toward liquid-liquid solvent extraction techniques to mitigate the severe environmental liabilities associated with legacy processing.
  • Because original equipment manufacturers require absolute material reliability for clean energy infrastructure, the adoption of permanent magnet synchronous motors has dramatically accelerated, directly improving electromechanical conversion efficiency by 20%. This technological shift fundamentally alters how automotive and energy developers approach long-term procurement.
  • The integration of direct-drive wind turbine generators across offshore installations demands massive volumes of high-performance alloys, forcing corporations to rethink their dependency on concentrated international suppliers. To manage rising thermal densities, technology conglomerates are expanding hyperscale data center cooling architectures, a move that heavily relies on the unique thermodynamic properties of refined rare earth oxides.
  • Through the rigorous application of magnetic flux density optimization, component designers successfully reduce the volumetric footprint of critical hardware, ensuring compliance with tightening energy mandates. Advanced bastnasite ore processing further guarantees reliable feedstock streams, securing vital operational continuity amidst fluctuating trade dynamics.

What are the Key Data Covered in this Rare Earth Metals Market Research and Growth Report?

  • What is the expected growth of the Rare Earth Metals Market between 2026 and 2030?

    • USD 4.48 billion, at a CAGR of 9.8%

  • What segmentation does the market report cover?

    • The report is segmented by Application (Permanent magnets, Metal alloys, Catalysts, Polishing powder, Others), Type (Light rare earth elements, Heavy rare earth elements, Others), Product (Cerium, Dysprosium, Erbium, Others) and Geography (APAC, North America, Europe, Middle East and Africa, South America)

  • Which regions are analyzed in the report?

    • APAC, North America, Europe, Middle East and Africa and South America

  • What are the key growth drivers and market challenges?

    • Rapid expansion of electric mobility and automotive electrification, Geopolitical monopolization and regional supply chain vulnerabilities

  • Who are the major players in the Rare Earth Metals Market?

    • American Elements Inc., Blue Line Corp., Energy Fuels Inc., Goodfellow Cambridge Ltd., Green Earth Chemicals Group, Iluka Resources Ltd., Less Common Metals Ltd., Lynas Rare Earths Ltd., Materion Corp., MP Materials Corp., Neo Performance Materials Inc., Proterial Ltd., Sigma Aldrich Chemicals Ltd., Solvay SA, Stanford Materials Corp., Sumitomo Corp., Thermo Fisher Scientific Inc., Treibacher Industrie AG and XTC New Energy Materials

Market Research Insights

  • The Rare Earth Metals Market operates as the critical foundation for modern technological and ecological transitions. Industrial operators prioritize the development of critical mineral supply chains to insulate production lines from external volatility, successfully reducing material procurement delays by 25%.
  • Because the demand for electric vehicle drivetrains continues to surge, manufacturers are implementing closed-loop recycling systems that improve secondary material recovery rates by 30% compared to legacy disposal methods. This strategic shift accelerates the deployment of advanced nanostructured alloys and synchronous reluctance motors, minimizing reliance on scarce heavy elements.
  • By optimizing these structural dependencies, original equipment manufacturers achieve a 15% reduction in overall component manufacturing costs, firmly aligning supply strategies with rigorous environmental compliance standards and sustainable growth objectives.

We can help! Our analysts can customize this rare earth metals market research report to meet your requirements.

Get in touch

1. Executive Summary

1.1 Market overview

Executive Summary - Chart on Market Overview
Executive Summary - Data Table on Market Overview
Executive Summary - Chart on Global Market Characteristics
Executive Summary - Chart on Market by Geography
Executive Summary - Chart on Market Segmentation by Application
Executive Summary - Chart on Market Segmentation by Type
Executive Summary - Chart on Market Segmentation by Product
Executive Summary - Chart on Incremental Growth
Executive Summary - Data Table on Incremental Growth
Executive Summary - Chart on Company Market Positioning

2. Technavio Analysis

2.1 Analysis of price sensitivity, lifecycle, customer purchase basket, adoption rates, and purchase criteria

2.2 Criticality of inputs and Factors of differentiation

Chart on Overview on criticality of inputs and factors of differentiation

2.3 Factors of disruption

Chart on Overview on factors of disruption

2.4 Impact of drivers and challenges

Chart on Impact of drivers and challenges in 2025 and 2030

3. Market Landscape

3.1 Market ecosystem

Chart on Parent Market
Data Table on - Parent Market

3.2 Market characteristics

Chart on Market characteristics analysis

3.3 Value chain analysis

Chart on Value chain analysis

4. Market Sizing

4.1 Market definition

Data Table on Offerings of companies included in the market definition

4.2 Market segment analysis

Market segments

4.3 Market size 2025

4.4 Market outlook: Forecast for 2025-2030

Chart on Global - Market size and forecast 2025-2030 ($ million)
Data Table on Global - Market size and forecast 2025-2030 ($ million)
Chart on Global Market: Year-over-year growth 2025-2030 (%)
Data Table on Global Market: Year-over-year growth 2025-2030 (%)

5. Historic Market Size

5.1 Global Rare Earth Metals Market 2020 - 2024

Historic Market Size - Data Table on Global Rare Earth Metals Market 2020 - 2024 ($ million)

5.2 Application segment analysis 2020 - 2024

Historic Market Size - Application Segment 2020 - 2024 ($ million)

5.3 Type segment analysis 2020 - 2024

Historic Market Size - Type Segment 2020 - 2024 ($ million)

5.4 Product segment analysis 2020 - 2024

Historic Market Size - Product Segment 2020 - 2024 ($ million)

5.5 Geography segment analysis 2020 - 2024

Historic Market Size - Geography Segment 2020 - 2024 ($ million)

5.6 Country segment analysis 2020 - 2024

Historic Market Size - Country Segment 2020 - 2024 ($ million)

6. Qualitative Analysis

6.1 Impact of AI on Global Rare Earth Metals Market

6.2 Impact of geopolitical conflicts on Global Rare Earth Metals Market

7. Five Forces Analysis

7.1 Five forces summary

Five forces analysis - Comparison between 2025 and 2030

7.2 Bargaining power of buyers

Bargaining power of buyers - Impact of key factors 2025 and 2030

7.3 Bargaining power of suppliers

Bargaining power of suppliers - Impact of key factors in 2025 and 2030

7.4 Threat of new entrants

Threat of new entrants - Impact of key factors in 2025 and 2030

7.5 Threat of substitutes

Threat of substitutes - Impact of key factors in 2025 and 2030

7.6 Threat of rivalry

Threat of rivalry - Impact of key factors in 2025 and 2030

7.7 Market condition

Chart on Market condition - Five forces 2025 and 2030

8. Market Segmentation by Application

8.1 Market segments

Chart on Application - Market share 2025-2030 (%)
Data Table on Application - Market share 2025-2030 (%)

8.2 Comparison by Application

Chart on Comparison by Application
Data Table on Comparison by Application

8.3 Permanent magnets - Market size and forecast 2025-2030

Chart on Permanent magnets - Market size and forecast 2025-2030 ($ million)
Data Table on Permanent magnets - Market size and forecast 2025-2030 ($ million)
Chart on Permanent magnets - Year-over-year growth 2025-2030 (%)
Data Table on Permanent magnets - Year-over-year growth 2025-2030 (%)

8.4 Metal alloys - Market size and forecast 2025-2030

Chart on Metal alloys - Market size and forecast 2025-2030 ($ million)
Data Table on Metal alloys - Market size and forecast 2025-2030 ($ million)
Chart on Metal alloys - Year-over-year growth 2025-2030 (%)
Data Table on Metal alloys - Year-over-year growth 2025-2030 (%)

8.5 Catalysts - Market size and forecast 2025-2030

Chart on Catalysts - Market size and forecast 2025-2030 ($ million)
Data Table on Catalysts - Market size and forecast 2025-2030 ($ million)
Chart on Catalysts - Year-over-year growth 2025-2030 (%)
Data Table on Catalysts - Year-over-year growth 2025-2030 (%)

8.6 Polishing powder - Market size and forecast 2025-2030

Chart on Polishing powder - Market size and forecast 2025-2030 ($ million)
Data Table on Polishing powder - Market size and forecast 2025-2030 ($ million)
Chart on Polishing powder - Year-over-year growth 2025-2030 (%)
Data Table on Polishing powder - Year-over-year growth 2025-2030 (%)

8.7 Others - Market size and forecast 2025-2030

Chart on Others - Market size and forecast 2025-2030 ($ million)
Data Table on Others - Market size and forecast 2025-2030 ($ million)
Chart on Others - Year-over-year growth 2025-2030 (%)
Data Table on Others - Year-over-year growth 2025-2030 (%)

8.8 Market opportunity by Application

Market opportunity by Application ($ million)
Data Table on Market opportunity by Application ($ million)

9. Market Segmentation by Type

9.1 Market segments

Chart on Type - Market share 2025-2030 (%)
Data Table on Type - Market share 2025-2030 (%)

9.2 Comparison by Type

Chart on Comparison by Type
Data Table on Comparison by Type

9.3 Light rare earth elements - Market size and forecast 2025-2030

Chart on Light rare earth elements - Market size and forecast 2025-2030 ($ million)
Data Table on Light rare earth elements - Market size and forecast 2025-2030 ($ million)
Chart on Light rare earth elements - Year-over-year growth 2025-2030 (%)
Data Table on Light rare earth elements - Year-over-year growth 2025-2030 (%)

9.4 Heavy rare earth elements - Market size and forecast 2025-2030

Chart on Heavy rare earth elements - Market size and forecast 2025-2030 ($ million)
Data Table on Heavy rare earth elements - Market size and forecast 2025-2030 ($ million)
Chart on Heavy rare earth elements - Year-over-year growth 2025-2030 (%)
Data Table on Heavy rare earth elements - Year-over-year growth 2025-2030 (%)

9.5 Others - Market size and forecast 2025-2030

Chart on Others - Market size and forecast 2025-2030 ($ million)
Data Table on Others - Market size and forecast 2025-2030 ($ million)
Chart on Others - Year-over-year growth 2025-2030 (%)
Data Table on Others - Year-over-year growth 2025-2030 (%)

9.6 Market opportunity by Type

Market opportunity by Type ($ million)
Data Table on Market opportunity by Type ($ million)

10. Market Segmentation by Product

10.1 Market segments

Chart on Product - Market share 2025-2030 (%)
Data Table on Product - Market share 2025-2030 (%)

10.2 Comparison by Product

Chart on Comparison by Product
Data Table on Comparison by Product

10.3 Cerium - Market size and forecast 2025-2030

Chart on Cerium - Market size and forecast 2025-2030 ($ million)
Data Table on Cerium - Market size and forecast 2025-2030 ($ million)
Chart on Cerium - Year-over-year growth 2025-2030 (%)
Data Table on Cerium - Year-over-year growth 2025-2030 (%)

10.4 Dysprosium - Market size and forecast 2025-2030

Chart on Dysprosium - Market size and forecast 2025-2030 ($ million)
Data Table on Dysprosium - Market size and forecast 2025-2030 ($ million)
Chart on Dysprosium - Year-over-year growth 2025-2030 (%)
Data Table on Dysprosium - Year-over-year growth 2025-2030 (%)

10.5 Erbium - Market size and forecast 2025-2030

Chart on Erbium - Market size and forecast 2025-2030 ($ million)
Data Table on Erbium - Market size and forecast 2025-2030 ($ million)
Chart on Erbium - Year-over-year growth 2025-2030 (%)
Data Table on Erbium - Year-over-year growth 2025-2030 (%)

10.6 Others - Market size and forecast 2025-2030

Chart on Others - Market size and forecast 2025-2030 ($ million)
Data Table on Others - Market size and forecast 2025-2030 ($ million)
Chart on Others - Year-over-year growth 2025-2030 (%)
Data Table on Others - Year-over-year growth 2025-2030 (%)

10.7 Market opportunity by Product

Market opportunity by Product ($ million)
Data Table on Market opportunity by Product ($ million)

11. Customer Landscape

11.1 Customer landscape overview

Analysis of price sensitivity, lifecycle, customer purchase basket, adoption rates, and purchase criteria

12. Geographic Landscape

12.1 Geographic segmentation

Chart on Market share by geography 2025-2030 (%)
Data Table on Market share by geography 2025-2030 (%)

12.2 Geographic comparison

Chart on Geographic comparison
Data Table on Geographic comparison

12.3 APAC - Market size and forecast 2025-2030

Chart on APAC - Market size and forecast 2025-2030 ($ million)
Data Table on APAC - Market size and forecast 2025-2030 ($ million)
Chart on APAC - Year-over-year growth 2025-2030 (%)
Data Table on APAC - Year-over-year growth 2025-2030 (%)
Chart on Regional Comparison - APAC
Data Table on Regional Comparison - APAC

12.3.1 China - Market size and forecast 2025-2030

Chart on China - Market size and forecast 2025-2030 ($ million)
Data Table on China - Market size and forecast 2025-2030 ($ million)
Chart on China - Year-over-year growth 2025-2030 (%)
Data Table on China - Year-over-year growth 2025-2030 (%)

12.3.2 Japan - Market size and forecast 2025-2030

Chart on Japan - Market size and forecast 2025-2030 ($ million)
Data Table on Japan - Market size and forecast 2025-2030 ($ million)
Chart on Japan - Year-over-year growth 2025-2030 (%)
Data Table on Japan - Year-over-year growth 2025-2030 (%)

12.3.3 India - Market size and forecast 2025-2030

Chart on India - Market size and forecast 2025-2030 ($ million)
Data Table on India - Market size and forecast 2025-2030 ($ million)
Chart on India - Year-over-year growth 2025-2030 (%)
Data Table on India - Year-over-year growth 2025-2030 (%)

12.3.4 South Korea - Market size and forecast 2025-2030

Chart on South Korea - Market size and forecast 2025-2030 ($ million)
Data Table on South Korea - Market size and forecast 2025-2030 ($ million)
Chart on South Korea - Year-over-year growth 2025-2030 (%)
Data Table on South Korea - Year-over-year growth 2025-2030 (%)

12.3.5 Australia - Market size and forecast 2025-2030

Chart on Australia - Market size and forecast 2025-2030 ($ million)
Data Table on Australia - Market size and forecast 2025-2030 ($ million)
Chart on Australia - Year-over-year growth 2025-2030 (%)
Data Table on Australia - Year-over-year growth 2025-2030 (%)

12.3.6 Indonesia - Market size and forecast 2025-2030

Chart on Indonesia - Market size and forecast 2025-2030 ($ million)
Data Table on Indonesia - Market size and forecast 2025-2030 ($ million)
Chart on Indonesia - Year-over-year growth 2025-2030 (%)
Data Table on Indonesia - Year-over-year growth 2025-2030 (%)

12.4 North America - Market size and forecast 2025-2030

Chart on North America - Market size and forecast 2025-2030 ($ million)
Data Table on North America - Market size and forecast 2025-2030 ($ million)
Chart on North America - Year-over-year growth 2025-2030 (%)
Data Table on North America - Year-over-year growth 2025-2030 (%)
Chart on Regional Comparison - North America
Data Table on Regional Comparison - North America

12.4.1 US - Market size and forecast 2025-2030

Chart on US - Market size and forecast 2025-2030 ($ million)
Data Table on US - Market size and forecast 2025-2030 ($ million)
Chart on US - Year-over-year growth 2025-2030 (%)
Data Table on US - Year-over-year growth 2025-2030 (%)

12.4.2 Canada - Market size and forecast 2025-2030

Chart on Canada - Market size and forecast 2025-2030 ($ million)
Data Table on Canada - Market size and forecast 2025-2030 ($ million)
Chart on Canada - Year-over-year growth 2025-2030 (%)
Data Table on Canada - Year-over-year growth 2025-2030 (%)

12.4.3 Mexico - Market size and forecast 2025-2030

Chart on Mexico - Market size and forecast 2025-2030 ($ million)
Data Table on Mexico - Market size and forecast 2025-2030 ($ million)
Chart on Mexico - Year-over-year growth 2025-2030 (%)
Data Table on Mexico - Year-over-year growth 2025-2030 (%)

12.5 Europe - Market size and forecast 2025-2030

Chart on Europe - Market size and forecast 2025-2030 ($ million)
Data Table on Europe - Market size and forecast 2025-2030 ($ million)
Chart on Europe - Year-over-year growth 2025-2030 (%)
Data Table on Europe - Year-over-year growth 2025-2030 (%)
Chart on Regional Comparison - Europe
Data Table on Regional Comparison - Europe

12.5.1 Germany - Market size and forecast 2025-2030

Chart on Germany - Market size and forecast 2025-2030 ($ million)
Data Table on Germany - Market size and forecast 2025-2030 ($ million)
Chart on Germany - Year-over-year growth 2025-2030 (%)
Data Table on Germany - Year-over-year growth 2025-2030 (%)

12.5.2 UK - Market size and forecast 2025-2030

Chart on UK - Market size and forecast 2025-2030 ($ million)
Data Table on UK - Market size and forecast 2025-2030 ($ million)
Chart on UK - Year-over-year growth 2025-2030 (%)
Data Table on UK - Year-over-year growth 2025-2030 (%)

12.5.3 France - Market size and forecast 2025-2030

Chart on France - Market size and forecast 2025-2030 ($ million)
Data Table on France - Market size and forecast 2025-2030 ($ million)
Chart on France - Year-over-year growth 2025-2030 (%)
Data Table on France - Year-over-year growth 2025-2030 (%)

12.5.4 Italy - Market size and forecast 2025-2030

Chart on Italy - Market size and forecast 2025-2030 ($ million)
Data Table on Italy - Market size and forecast 2025-2030 ($ million)
Chart on Italy - Year-over-year growth 2025-2030 (%)
Data Table on Italy - Year-over-year growth 2025-2030 (%)

12.5.5 Spain - Market size and forecast 2025-2030

Chart on Spain - Market size and forecast 2025-2030 ($ million)
Data Table on Spain - Market size and forecast 2025-2030 ($ million)
Chart on Spain - Year-over-year growth 2025-2030 (%)
Data Table on Spain - Year-over-year growth 2025-2030 (%)

12.5.6 The Netherlands - Market size and forecast 2025-2030

Chart on The Netherlands - Market size and forecast 2025-2030 ($ million)
Data Table on The Netherlands - Market size and forecast 2025-2030 ($ million)
Chart on The Netherlands - Year-over-year growth 2025-2030 (%)
Data Table on The Netherlands - Year-over-year growth 2025-2030 (%)

12.6 Middle East and Africa - Market size and forecast 2025-2030

Chart on Middle East and Africa - Market size and forecast 2025-2030 ($ million)
Data Table on Middle East and Africa - Market size and forecast 2025-2030 ($ million)
Chart on Middle East and Africa - Year-over-year growth 2025-2030 (%)
Data Table on Middle East and Africa - Year-over-year growth 2025-2030 (%)
Chart on Regional Comparison - Middle East and Africa
Data Table on Regional Comparison - Middle East and Africa

12.6.1 South Africa - Market size and forecast 2025-2030

Chart on South Africa - Market size and forecast 2025-2030 ($ million)
Data Table on South Africa - Market size and forecast 2025-2030 ($ million)
Chart on South Africa - Year-over-year growth 2025-2030 (%)
Data Table on South Africa - Year-over-year growth 2025-2030 (%)

12.6.2 Saudi Arabia - Market size and forecast 2025-2030

Chart on Saudi Arabia - Market size and forecast 2025-2030 ($ million)
Data Table on Saudi Arabia - Market size and forecast 2025-2030 ($ million)
Chart on Saudi Arabia - Year-over-year growth 2025-2030 (%)
Data Table on Saudi Arabia - Year-over-year growth 2025-2030 (%)

12.6.3 UAE - Market size and forecast 2025-2030

Chart on UAE - Market size and forecast 2025-2030 ($ million)
Data Table on UAE - Market size and forecast 2025-2030 ($ million)
Chart on UAE - Year-over-year growth 2025-2030 (%)
Data Table on UAE - Year-over-year growth 2025-2030 (%)

12.6.4 Turkey - Market size and forecast 2025-2030

Chart on Turkey - Market size and forecast 2025-2030 ($ million)
Data Table on Turkey - Market size and forecast 2025-2030 ($ million)
Chart on Turkey - Year-over-year growth 2025-2030 (%)
Data Table on Turkey - Year-over-year growth 2025-2030 (%)

12.6.5 Israel - Market size and forecast 2025-2030

Chart on Israel - Market size and forecast 2025-2030 ($ million)
Data Table on Israel - Market size and forecast 2025-2030 ($ million)
Chart on Israel - Year-over-year growth 2025-2030 (%)
Data Table on Israel - Year-over-year growth 2025-2030 (%)

12.7 South America - Market size and forecast 2025-2030

Chart on South America - Market size and forecast 2025-2030 ($ million)
Data Table on South America - Market size and forecast 2025-2030 ($ million)
Chart on South America - Year-over-year growth 2025-2030 (%)
Data Table on South America - Year-over-year growth 2025-2030 (%)
Chart on Regional Comparison - South America
Data Table on Regional Comparison - South America

12.7.1 Brazil - Market size and forecast 2025-2030

Chart on Brazil - Market size and forecast 2025-2030 ($ million)
Data Table on Brazil - Market size and forecast 2025-2030 ($ million)
Chart on Brazil - Year-over-year growth 2025-2030 (%)
Data Table on Brazil - Year-over-year growth 2025-2030 (%)

12.7.2 Argentina - Market size and forecast 2025-2030

Chart on Argentina - Market size and forecast 2025-2030 ($ million)
Data Table on Argentina - Market size and forecast 2025-2030 ($ million)
Chart on Argentina - Year-over-year growth 2025-2030 (%)
Data Table on Argentina - Year-over-year growth 2025-2030 (%)

12.7.3 Chile - Market size and forecast 2025-2030

Chart on Chile - Market size and forecast 2025-2030 ($ million)
Data Table on Chile - Market size and forecast 2025-2030 ($ million)
Chart on Chile - Year-over-year growth 2025-2030 (%)
Data Table on Chile - Year-over-year growth 2025-2030 (%)

12.8 Market opportunity by geography

Market opportunity by geography ($ million)
Data Tables on Market opportunity by geography ($ million)

13. Drivers, Challenges, and Opportunity

13.1 Market drivers

Rapid expansion of electric mobility and automotive electrification
Escalating deployment of utility-scale renewable energy infrastructure
Proliferation of advanced data infrastructure and AI hardware

13.2 Market challenges

Geopolitical monopolization and regional supply chain vulnerabilities
Stringent environmental regulations and high operational costs of refining
Price volatility and threat of technological substitution

13.3 Impact of drivers and challenges

Impact of drivers and challenges in 2025 and 2030

13.4 Market opportunities

Accelerated electrification and permanent magnet demand in automotive and clean energy sectors
Supply chain localization and geopolitical risk mitigation strategies
Industrial of advanced consumer electronics and infrastructure

14. Competitive Landscape

14.1 Overview

14.2

Overview on criticality of inputs and factors of differentiation

14.3 Landscape disruption

Overview on factors of disruption

14.4 Industry risks

Impact of key risks on business

15. Competitive Analysis

15.1 Companies profiled

Companies covered

15.2 Company ranking index

15.3 Market positioning of companies

Matrix on companies position and classification

15.4 Blue Line Corp.

Blue Line Corp. - Overview
Blue Line Corp. - Product / Service
Blue Line Corp. - Key offerings
SWOT

15.5 Energy Fuels Inc.

Energy Fuels Inc. - Overview
Energy Fuels Inc. - Product / Service
Energy Fuels Inc. - Key offerings
SWOT

15.6 Goodfellow Cambridge Ltd.

Goodfellow Cambridge Ltd. - Overview
Goodfellow Cambridge Ltd. - Product / Service
Goodfellow Cambridge Ltd. - Key offerings
SWOT

15.7 Green Earth Chemicals Group

Green Earth Chemicals Group - Overview
Green Earth Chemicals Group - Product / Service
Green Earth Chemicals Group - Key offerings
SWOT

15.8 Iluka Resources Ltd.

Iluka Resources Ltd. - Overview
Iluka Resources Ltd. - Business segments
Iluka Resources Ltd. - Key offerings
Iluka Resources Ltd. - Segment focus
SWOT

15.9 Less Common Metals Ltd.

Less Common Metals Ltd. - Overview
Less Common Metals Ltd. - Product / Service
Less Common Metals Ltd. - Key offerings
SWOT

15.10 Lynas Rare Earths Ltd.

Lynas Rare Earths Ltd. - Overview
Lynas Rare Earths Ltd. - Product / Service
Lynas Rare Earths Ltd. - Key offerings
SWOT

15.11 Materion Corp.

Materion Corp. - Overview
Materion Corp. - Business segments
Materion Corp. - Key offerings
Materion Corp. - Segment focus
SWOT

15.12 MP Materials Corp.

MP Materials Corp. - Overview
MP Materials Corp. - Product / Service
MP Materials Corp. - Key offerings
SWOT

15.13 Neo Performance Materials Inc.

Neo Performance Materials Inc. - Overview
Neo Performance Materials Inc. - Business segments
Neo Performance Materials Inc. - Key offerings
Neo Performance Materials Inc. - Segment focus
SWOT

15.14 Sigma Aldrich Chemicals Ltd.

Sigma Aldrich Chemicals Ltd. - Overview
Sigma Aldrich Chemicals Ltd. - Product / Service
Sigma Aldrich Chemicals Ltd. - Key offerings
SWOT

15.15 Solvay SA

Solvay SA - Overview
Solvay SA - Business segments
Solvay SA - Key offerings
Solvay SA - Segment focus
SWOT

15.16 Sumitomo Corp.

Sumitomo Corp. - Overview
Sumitomo Corp. - Business segments
Sumitomo Corp. - Key offerings
Sumitomo Corp. - Segment focus
SWOT

15.17 Thermo Fisher Scientific Inc.

Thermo Fisher Scientific Inc. - Overview
Thermo Fisher Scientific Inc. - Business segments
Thermo Fisher Scientific Inc. - Key news
Thermo Fisher Scientific Inc. - Key offerings
Thermo Fisher Scientific Inc. - Segment focus
SWOT

15.18 XTC New Energy Materials

XTC New Energy Materials - Overview
XTC New Energy Materials - Business segments
XTC New Energy Materials - Key offerings
XTC New Energy Materials - Segment focus
SWOT

16. Appendix

16.1 Scope of the report

Market definition
Objectives
Notes and caveats

16.2 Inclusions and exclusions checklist

Inclusions checklist
Exclusions checklist

16.3 Currency conversion rates for US$

16.4 Research methodology

16.5 Data procurement

Information sources

16.6 Data validation

16.7 Validation techniques employed for market sizing

16.8 Data synthesis

16.9 360 degree market analysis

16.10 List of abbreviations

Research Methodology

Technavio presents a detailed picture of the market by way of study, synthesis, and summation of data from multiple sources. The analysts have presented the various facets of the market with a particular focus on identifying the key industry influencers. The data thus presented is comprehensive, reliable, and the result of extensive research, both primary and secondary.

INFORMATION SOURCES

Primary sources

  • Manufacturers and suppliers
  • Channel partners
  • Industry experts
  • Strategic decision makers

Secondary sources

  • Industry journals and periodicals
  • Government data
  • Financial reports of key industry players
  • Historical data
  • Press releases

DATA ANALYSIS

Data Synthesis

  • Collation of data
  • Estimation of key figures
  • Analysis of derived insights

Data Validation

  • Triangulation with data models
  • Reference against proprietary databases
  • Corroboration with industry experts

REPORT WRITING

Qualitative

  • Market drivers
  • Market challenges
  • Market trends
  • Five forces analysis

Quantitative

  • Market size and forecast
  • Market segmentation
  • Geographical insights
  • Competitive landscape

Interested in this report?

Get your sample now to see our research methodology and insights!

Download Now

Frequently Asked Questions

Rare Earth Metals market growth will increase by USD 4476.3 million during 2026-2030.

The Rare Earth Metals market is expected to grow at a CAGR of 9.8% during 2026-2030.

Rare Earth Metals market is segmented by Application (Permanent magnets, Metal alloys, Catalysts, Polishing powder, Others) Type (Light rare earth elements, Heavy rare earth elements, Others) Product (Cerium, Dysprosium, Erbium, Others)

American Elements Inc., Blue Line Corp., Energy Fuels Inc., Goodfellow Cambridge Ltd., Green Earth Chemicals Group, Iluka Resources Ltd., Less Common Metals Ltd., Lynas Rare Earths Ltd., Materion Corp., MP Materials Corp., Neo Performance Materials Inc., Proterial Ltd., Sigma Aldrich Chemicals Ltd., Solvay SA, Stanford Materials Corp., Sumitomo Corp., Thermo Fisher Scientific Inc., Treibacher Industrie AG, XTC New Energy Materials are a few of the key vendors in the Rare Earth Metals market.

APAC will register the highest growth rate of 72.1% among the other regions. Therefore, the Rare Earth Metals market in APAC is expected to garner significant business opportunities for the vendors during the forecast period.

China, Japan, India, South Korea, Australia, Indonesia, US, Canada, Mexico, Germany, UK, France, Italy, Spain, The Netherlands, South Africa, Saudi Arabia, UAE, Turkey, Israel, Brazil, Argentina, Chile

  • Rapid expansion of electric mobility and automotive electrification is the driving factor this market.

The Rare Earth Metals market vendors should focus on grabbing business opportunities from the Application segment as it accounted for the largest market share in the base year.
RIA - Research AI Assistant
Ask RIA
