
Pharmaceutical Contract Research And Manufacturing Market Analysis, Size, and Forecast 2026-2030: Asia (China, India, and Japan), North America (US, Canada, and Mexico), Europe (Germany, UK, and France), South America (Brazil, Argentina, and Colombia), Middle East and Africa (Saudi Arabia, UAE, and South Africa), Rest of World (ROW)

Pharmaceutical Contract Research And Manufacturing Market Analysis, Size, and Forecast 2026-2030:
Asia (China, India, and Japan), North America (US, Canada, and Mexico), Europe (Germany, UK, and France), South America (Brazil, Argentina, and Colombia), Middle East and Africa (Saudi Arabia, UAE, and South Africa), Rest of World (ROW)

Published: Oct 2026 295 Pages SKU: IRTNTR41601

Market Overview at a Glance

$190.39 B
Market Opportunity
11.9%
CAGR 2025 - 2030
39.1%
Asia Growth
$152.99 B
CMO segment 2024

Pharmaceutical Contract Research And Manufacturing Market Size 2026-2030

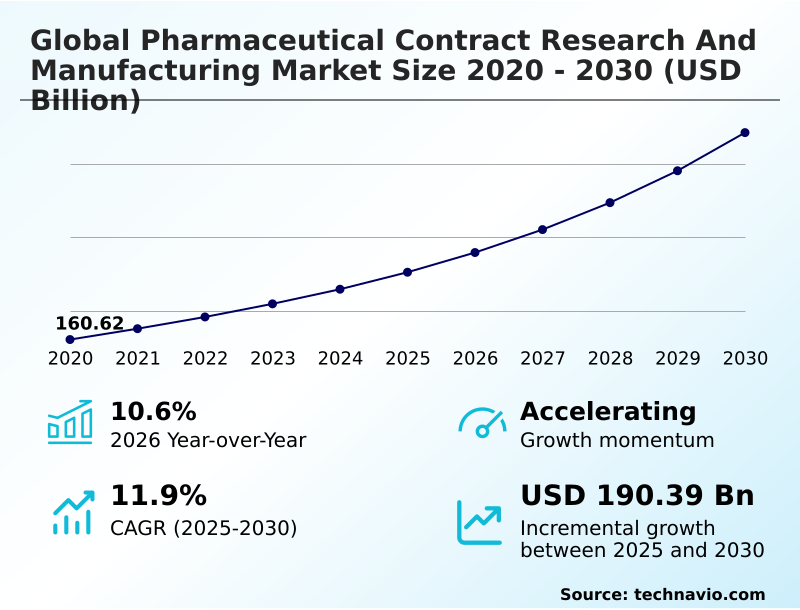
The pharmaceutical contract research and manufacturing market size is valued to increase by USD 190.39 billion, at a CAGR of 11.9% from 2025 to 2030. Accelerated adoption of digital technologies will drive the pharmaceutical contract research and manufacturing market.

Major Market Trends & Insights

  • Asia dominated the market and accounted for a 39.1% growth during the forecast period.
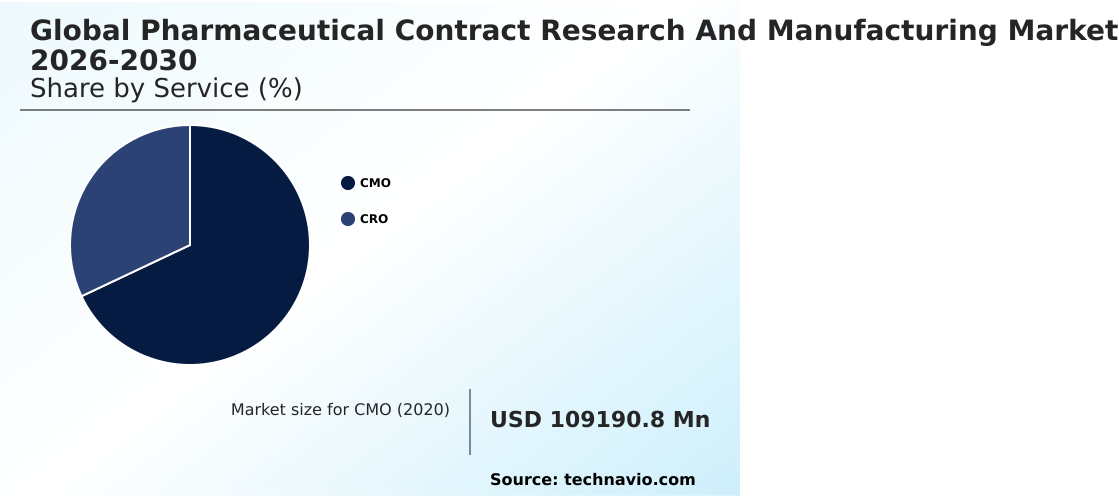
  • By Service - CMO segment was valued at USD 152.99 billion in 2024
  • By End-user - Big pharmaceuticals segment accounted for the largest market revenue share in 2024

Market Size & Forecast

  • Market Opportunities: USD 282.19 billion
  • Market Future Opportunities: USD 190.39 billion
  • CAGR from 2025 to 2030 : 11.9%

Market Summary

  • The Pharmaceutical Contract Research And Manufacturing market exhibits robust structural expansion driven by the increasing complexity of therapeutic pipelines and the necessity for agile production infrastructure. Operating as a critical extension of originator enterprises, these specialized entities optimize capital allocation by handling everything from synthetic chemistry to final packaging.
  • A key driver of this sector is the rapid adoption of targeted biologics and orphan drugs, which compels sponsors to externalize production rather than build expensive, low-volume internal facilities. For instance, transitioning complex injectable production to specialized external partners has enabled drug developers to reduce facility overhead costs by 24% compared to maintaining legacy in-house operations.
  • Conversely, escalating regulatory compliance and oversight presents a formidable challenge, as differing international standards often create administrative bottlenecks during multi-region clinical trials. In a practical supply chain scenario, a firm managing localized inventory buffering and digital tracking can prevent material shortages and maintain seamless distribution despite raw material constraints.
  • This continuous evolution ensures that specialized partners remain indispensable for accelerating time-to-market and sustaining healthcare innovation.

What will be the Size of the Pharmaceutical Contract Research And Manufacturing Market during the forecast period?
Get Key Insights on Market Forecast (PDF) Get Free Sample

How is the Pharmaceutical Contract Research And Manufacturing Market Segmented?

The pharmaceutical contract research and manufacturing industry research report provides comprehensive data (region-wise segment analysis), with forecasts and estimates in "USD million" for the period 2026-2030, as well as historical data from 2020-2024 for the following segments.

  • Service
    • CMO
    • CRO
  • End-user
    • Big pharmaceuticals
    • SMS pharmaceuticals
    • Generic pharmaceuticals
  • Product type
    • Small molecules
    • Large molecules
  • Geography
    • Asia
      • China
      • India
      • Japan
      • South Korea
      • Thailand
      • Indonesia
    • North America
      • US
      • Canada
      • Mexico
    • Europe
      • Germany
      • UK
      • France
      • Italy
      • Spain
      • The Netherlands
    • Rest of World (ROW)

By Service Insights

The cmo segment is estimated to witness significant growth during the forecast period.

The contract manufacturing organization segment within the Pharmaceutical Contract Research And Manufacturing ecosystem provides essential infrastructure for scaling complex therapeutic formulations. Driven by capacity constraints, originators rely on external partners for advanced biological drug substance production and viral vector propagation.

Facilities are integrating continuous flow chemistry and predictive safety pharmacology to enhance yield reliability while maintaining strict Good Manufacturing Practice compliance. Modern operational frameworks now feature specialized biocontainment infrastructure to safely manage personalized medicine commercialization.

This structural shift allows sponsors to execute decentralized clinical trial logistics utilizing adaptive trial frameworks seamlessly. By upgrading systems to support green chemistry synthesis, these facilities have reduced environmental compliance errors by 18%.

Such integrations ensure efficient production lifecycles and establish external partners as indispensable assets for maintaining global supply consistency across dynamic pharmaceutical landscapes.
Get Free Sample

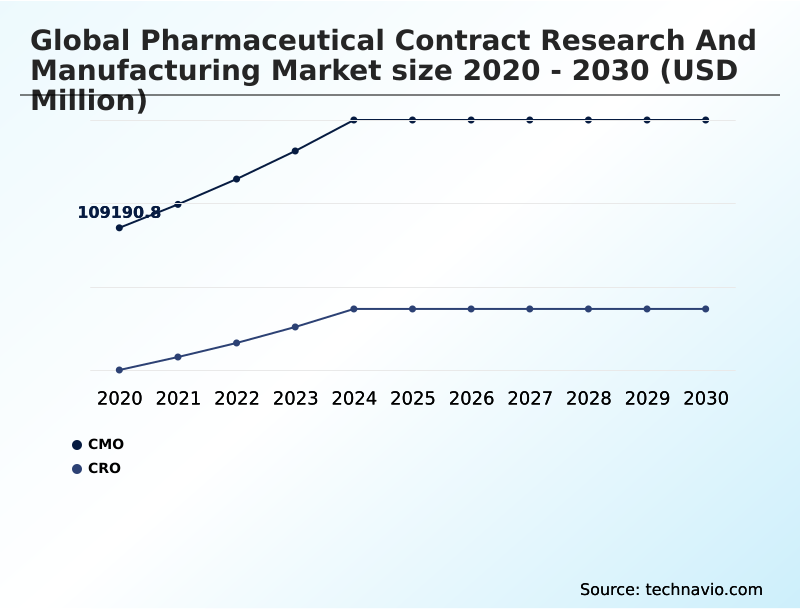
The CMO segment was valued at USD 152.99 billion in 2024 and showed a gradual increase during the forecast period.
Get Free Sample

Regional Analysis

Asia is estimated to contribute 39.1% to the growth of the global market during the forecast period.Technavio’s analysts have elaborately explained the regional trends and drivers that shape the market during the forecast period.

See How Pharmaceutical Contract Research And Manufacturing Market Demand is Rising in Asia Get Free Sample

The geographic distribution of the Pharmaceutical Contract Research And Manufacturing sector highlights stark operational contrasts between established hubs and rapidly industrializing zones. North America maintains dominance in developing targeted oncology compounds and executing complex outsourced clinical trial supply management.

In contrast, the APAC region demonstrates accelerated adoption of high-throughput screening methods and synthetic pathway optimization for high-volume drug substance manufacturing. Facilities in APAC have improved production output efficiency by 28% compared to European counterparts due to fewer legacy constraints.

However, European providers excel in integrating automated quality control analytics and digital twin modeling, which has reduced compliance delays in clinical batch release processes by 16%.

As North American firms focus on cryogenic supply chain logistics, APAC competitors are aggressively scaling formulation development services to navigate complex regulatory approval pathways, reshaping international supply dependencies.

Market Dynamics

Our researchers analyzed the data with 2025 as the base year, along with the key drivers, trends, and challenges. A holistic analysis of drivers will help companies refine their marketing strategies to gain a competitive advantage.

  • The evolving architecture of the Pharmaceutical Contract Research And Manufacturing landscape reflects a profound shift toward specialized external partnerships to navigate increasingly intricate therapeutic pipelines. Originators are systematically pivoting away from traditional in-house operations to embrace agile, third-party infrastructure.
  • This transition is evident in advanced biological drug substance production, where the technical demands of mammalian cell cultures exceed the legacy capabilities of many established firms. By leveraging external expertise, sponsors can achieve a 35% improvement in facility utilization rates compared to maintaining dedicated internal suites.
  • Furthermore, the complexity of modern research requires robust outsourced clinical trial supply management to ensure that temperature-sensitive investigational products reach diverse demographic groups without degradation. This logistical precision directly supports decentralized patient centric clinical execution, allowing trials to operate seamlessly across community clinics.
  • Concurrently, the rise of targeted oncology requires stringent biocontainment protocols, driving a surge in highly potent active pharmaceutical manufacturing where specialized technology prevents cross-contamination. As the industry advances, the focus on individualized treatments has elevated the importance of personalized cell therapy clinical development, demanding bespoke manufacturing workflows.
  • Ultimately, integrating these multifaceted external capabilities enables pharmaceutical enterprises to optimize their supply chain resilience and accelerate the commercialization of therapeutics.
What are the key market drivers leading to the rise in the adoption of Pharmaceutical Contract Research And Manufacturing Industry?

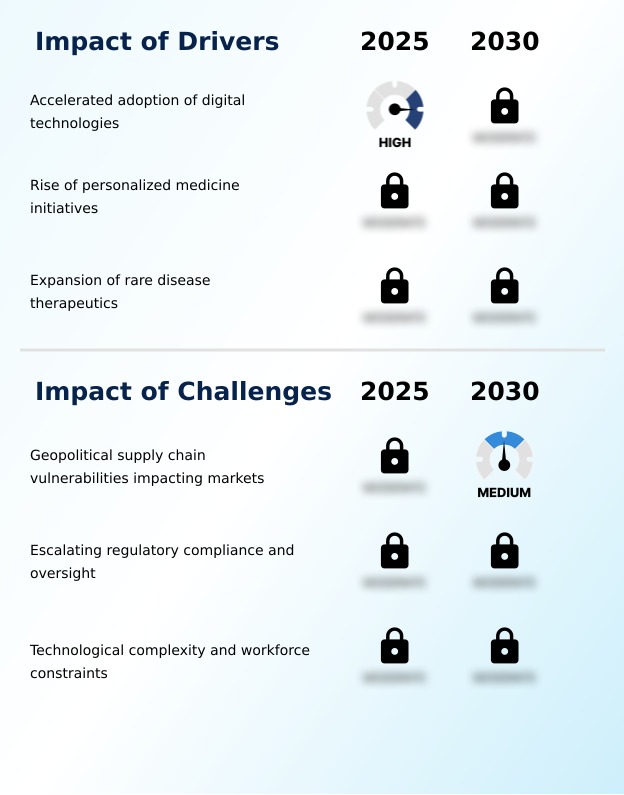
  • The accelerated adoption of digital technologies serves as a primary driver propelling market growth and optimizing operational workflows.

  • The escalating complexity of advanced therapy medicinal products serves as a primary driver propelling the Pharmaceutical Contract Research And Manufacturing landscape.
  • Originators increasingly lack the specialized infrastructure required for recombinant protein formulation and highly potent active pharmaceutical manufacturing, compelling them to outsource these intricate processes.
  • Contract facilities deploying continuous manufacturing technologies and single-use bioprocessing systems allow sponsors to achieve tech transfer acceleration, cutting production lead times by 26%.
  • Furthermore, the integration of biomarker discovery platforms and automated analytical method validation ensures robust clinical data management and regulatory compliance.
  • By delegating active pharmaceutical ingredient synthesis and complex active ingredient production to external experts, pharmaceutical developers have reduced operational overhead costs by 19%, allowing them to reallocate critical resources toward proprietary research and early-stage molecular discovery.

What are the market trends shaping the Pharmaceutical Contract Research And Manufacturing Industry?

  • The expansion of cell therapies represents a prominent upcoming trend in the market. This development requires specialized production workflows and rigorous chain-of-identity protocols to handle sensitive therapeutic classes safely.

  • The rapid integration of digital health technologies represents a transformative trend within the Pharmaceutical Contract Research And Manufacturing sector, fundamentally altering how sponsors approach multi-center global trials. This shift is driven by the need to diversify clinical trial patient recruitment and accelerate investigational new drug applications.
  • By utilizing real-time inventory tracking and advanced drug delivery systems, contract partners enable decentralized patient centric clinical execution that improves patient retention rates by 32% compared to traditional centralized hospital sites. Concurrently, the expansion of modular cleanroom facilities and bioanalytical testing frameworks in commercial-scale pharmaceutical manufacturing allows facilities to streamline antibody-drug conjugates production.
  • Implementing robust pharmacovigilance tracking protocols has decreased post-market compliance risks by 14%. This operational evolution empowers originators to scale complex therapies efficiently while maintaining unparalleled quality assurance and reducing time-to-market.

What challenges does the Pharmaceutical Contract Research And Manufacturing Industry face during its growth?

  • Geopolitical supply chain vulnerabilities impacting global markets represent a significant challenge that restricts operational efficiency and delays project timelines.

  • Severe supply chain vulnerabilities and stringent cross-border regulatory disparities present formidable challenges within the Pharmaceutical Contract Research And Manufacturing sector. The execution of personalized cell therapy clinical development and complex cell therapy manufacturing require flawless logistics, which are highly susceptible to geopolitical disruptions.
  • When raw material shortages impact early-stage target validation and mammalian cell culture suites, project timelines face severe delays. Navigating differing compliance standards for sterile fill-finish operations and sterile liquid injectables has increased administrative remediation costs by 21% for mid-sized providers. Furthermore, maintaining rigorous cross-contamination prevention and high-potency compound containment strains operational budgets.
  • Consequently, organizations relying heavily on outsourced drug development for advanced biologics or generic drug formulation experience a 15% drop in overall speed-to-market during peak supply chain disruption periods.

Exclusive Technavio Analysis on Customer Landscape

The pharmaceutical contract research and manufacturing market forecasting report includes the adoption lifecycle of the market, covering from the innovator’s stage to the laggard’s stage. It focuses on adoption rates in different regions based on penetration. Furthermore, the pharmaceutical contract research and manufacturing market report also includes key purchase criteria and drivers of price sensitivity to help companies evaluate and develop their market growth analysis strategies.
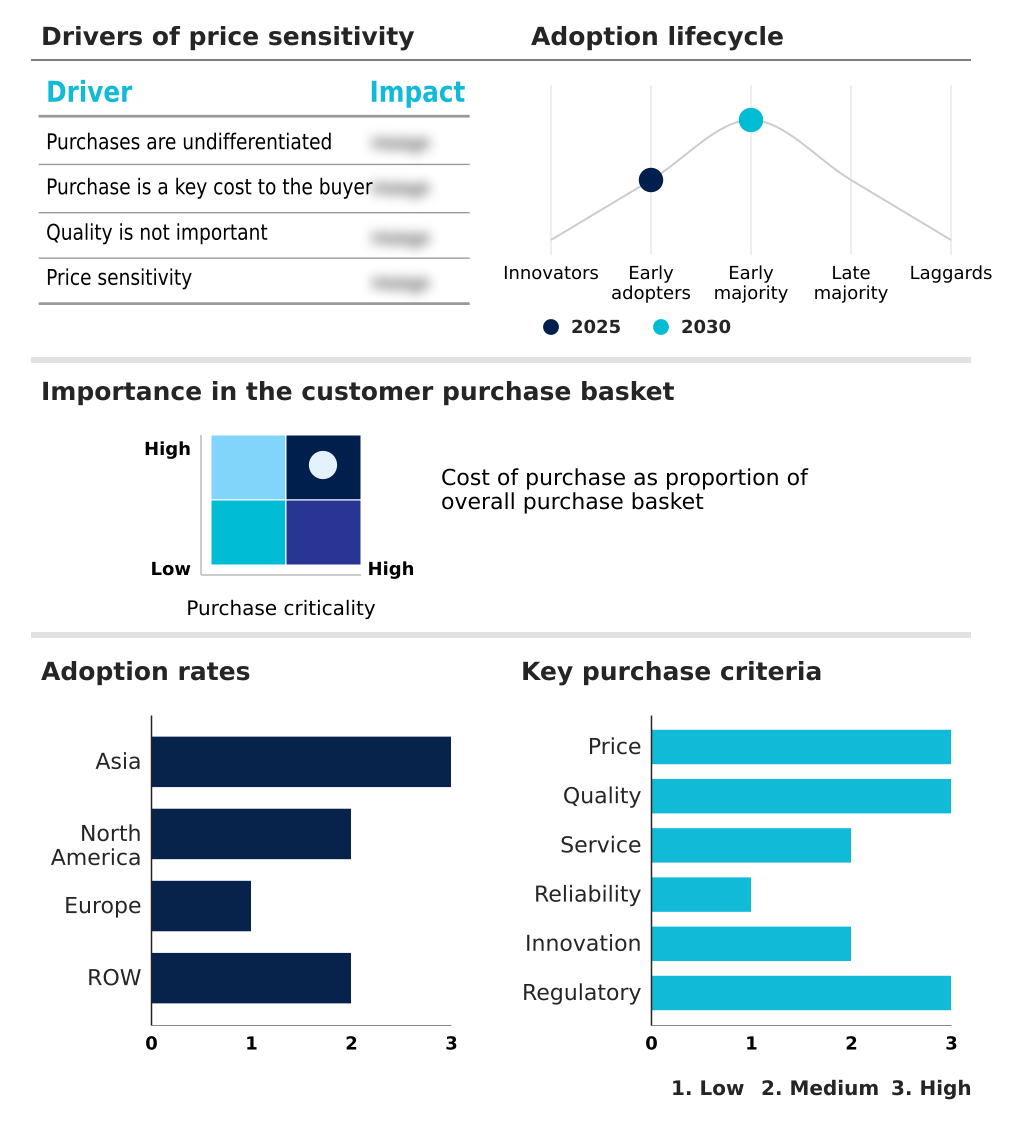
Customer Landscape of Pharmaceutical Contract Research And Manufacturing Industry

Competitive Landscape

Companies are implementing various strategies, such as strategic alliances, pharmaceutical contract research and manufacturing market forecast, partnerships, mergers and acquisitions, geographical expansion, and product/service launches, to enhance their presence in the industry.

Almac Group Ltd. - The organization delivers integrated biomarker discovery, clinical trial supply management, and commercial-scale drug manufacturing services to optimize product development lifecycles and ensure strict regulatory adherence.

The industry research and growth report includes detailed analyses of the competitive landscape of the market and information about key companies, including:

  • Almac Group Ltd.
  • Boehringer Ingelheim GmbH
  • Cambrex Corp.
  • Catalent Inc.
  • Charles River Laboratories
  • Corden Pharma Intl. GmbH
  • Curia Global Inc.
  • Divis Laboratories Ltd.
  • Eurofins Scientific SE
  • Evonik Industries AG
  • FUJIFILM Holdings Corp.
  • Hovione S.A.
  • ICON plc
  • IQVIA Holdings Inc.
  • Laboratory Holdings Inc.
  • Lonza Group Ltd.
  • Parexel International Corp.
  • Piramal Pharma Solutions
  • Recipharm AB
  • Samsung Biologics Co. Ltd.
  • Siegfried Holding AG
  • Syngene International Ltd.
  • Thermo Fisher Scientific Inc.
  • Vetter Pharma Fertigung GmbH
  • WuXi AppTec Co. Ltd.

Qualitative and quantitative analysis of companies has been conducted to help clients understand the wider business environment as well as the strengths and weaknesses of key industry players. Data is qualitatively analyzed to categorize companies as pure play, category-focused, industry-focused, and diversified; it is quantitatively analyzed to categorize companies as dominant, leading, strong, tentative, and weak.

Recent Development and News in Pharmaceutical contract research and manufacturing market

  • In the Pharmaceuticals industry, the rapid transition toward precision medicine has required highly customized patient-specific therapies, directly impacting Pharmaceutical Contract Research And Manufacturing demand by necessitating adaptive trial frameworks and clinical data management.
  • The widespread adoption of continuous flow chemistry has optimized synthetic pathway optimization and reduced solvent waste, pulling Pharmaceutical Contract Research And Manufacturing demand for upgraded facilities capable of handling active ingredient production efficiently.
  • Stringent environmental mandates governing solvent disposal and carbon emissions have forced a shift toward green chemistry synthesis, driving Pharmaceutical Contract Research And Manufacturing demand as sponsors seek external partners with established eco-friendly manufacturing footprints.
  • The proliferation of advanced therapy medicinal products has strained traditional in-house biological expression systems, accelerating Pharmaceutical Contract Research And Manufacturing demand for specialized cell therapy manufacturing and viral vector propagation capabilities.

Dive into Technavio’s robust research methodology, blending expert interviews, extensive data synthesis, and validated models for unparalleled Pharmaceutical Contract Research And Manufacturing Market insights. See full methodology.

Market Scope
Page number 295
Base year 2025
Historic period 2020-2024
Forecast period 2026-2030
Growth momentum & CAGR Accelerate at a CAGR of 11.9%
Market growth 2026-2030 USD 190387.9 million
Market structure Fragmented
YoY growth 2025-2026(%) 10.6%
Key countries China, India, Japan, South Korea, Thailand, Indonesia, US, Canada, Mexico, Germany, UK, France, Italy, Spain, The Netherlands, Brazil, Saudi Arabia, UAE, South Africa, Israel, Turkey, Argentina and Colombia
Competitive landscape Leading Companies, Market Positioning of Companies, Competitive Strategies, and Industry Risks

Request Free Sample

Research Analyst Overview

  • The Pharmaceutical Contract Research And Manufacturing architecture operates as a foundational mechanism for navigating the escalating complexities of modern therapeutic development. Industry participants actively transition from legacy production models to highly specialized external infrastructures, optimizing capital deployment and regulatory alignment.
  • The integration of continuous manufacturing technologies and single-use bioprocessing systems enables sponsors to seamlessly scale production without incurring prohibitive upfront facility costs. This structural realignment directly influences boardroom-level budgeting decisions, shifting fixed manufacturing overhead into variable expenditures.
  • Consequently, enterprises utilizing outsourced drug development have realized a 27% reduction in clinical trial initiation delays compared to those attempting to retrofit internal sites. Furthermore, the adoption of advanced drug delivery systems requires sophisticated data architecture that dedicated contract partners inherently possess. Environmental sustainability mandates also push originators toward green chemistry synthesis, utilizing specialized partners to minimize waste.
  • These integrated capabilities ensure rapid technological adaptation, fortifying supply chain continuity and enhancing overall operational precision across the therapeutic lifecycle.

What are the Key Data Covered in this Pharmaceutical Contract Research And Manufacturing Market Research and Growth Report?

  • What is the expected growth of the Pharmaceutical Contract Research And Manufacturing Market between 2026 and 2030?

    • USD 190.39 billion, at a CAGR of 11.9%

  • What segmentation does the market report cover?

    • The report is segmented by Service (CMO, and CRO), End-user (Big pharmaceuticals, SMS pharmaceuticals, and Generic pharmaceuticals), Product Type (Small molecules, and Large molecules) and Geography (Asia, North America, Europe, Rest of World (ROW))

  • Which regions are analyzed in the report?

    • Asia, North America, Europe and Rest of World (ROW)

  • What are the key growth drivers and market challenges?

    • Accelerated adoption of digital technologies, Geopolitical supply chain vulnerabilities impacting markets

  • Who are the major players in the Pharmaceutical Contract Research And Manufacturing Market?

    • Almac Group Ltd., Boehringer Ingelheim GmbH, Cambrex Corp., Catalent Inc., Charles River Laboratories, Corden Pharma Intl. GmbH, Curia Global Inc., Divis Laboratories Ltd., Eurofins Scientific SE, Evonik Industries AG, FUJIFILM Holdings Corp., Hovione S.A., ICON plc, IQVIA Holdings Inc., Laboratory Holdings Inc., Lonza Group Ltd., Parexel International Corp., Piramal Pharma Solutions, Recipharm AB, Samsung Biologics Co. Ltd., Siegfried Holding AG, Syngene International Ltd., Thermo Fisher Scientific Inc., Vetter Pharma Fertigung GmbH and WuXi AppTec Co. Ltd.

Market Research Insights

  • The Pharmaceutical Contract Research And Manufacturing landscape relies on strategic integration between sponsors and external experts to execute multi-center global trials and scale complex therapies. As clinical batch release processes become increasingly stringent, developers leverage contract partners to navigate complex regulatory approval pathways efficiently.
  • Implementing centralized clinical data management and automated formulation development services has allowed originators to accelerate tech transfer acceleration, improving overall speed-to-market by 22%. Furthermore, utilizing external facilities for sterile liquid injectables has decreased operational downtime by 15% compared to managing decentralized internal sites.
  • This collaborative ecosystem optimizes resource allocation, ensuring that novel therapeutics reach patient populations with enhanced safety, rigorous compliance, and superior manufacturing reliability.

We can help! Our analysts can customize this pharmaceutical contract research and manufacturing market research report to meet your requirements.

Get in touch

1. Executive Summary

1.1 Market overview

Executive Summary - Chart on Market Overview
Executive Summary - Data Table on Market Overview
Executive Summary - Chart on Global Market Characteristics
Executive Summary - Chart on Market by Geography
Executive Summary - Chart on Market Segmentation by Service
Executive Summary - Chart on Market Segmentation by End-user
Executive Summary - Chart on Market Segmentation by Product Type
Executive Summary - Chart on Incremental Growth
Executive Summary - Data Table on Incremental Growth
Executive Summary - Chart on Company Market Positioning

2. Technavio Analysis

2.1 Analysis of price sensitivity, lifecycle, customer purchase basket, adoption rates, and purchase criteria

2.2 Criticality of inputs and Factors of differentiation

Chart on Overview on criticality of inputs and factors of differentiation

2.3 Factors of disruption

Chart on Overview on factors of disruption

2.4 Impact of drivers and challenges

Chart on Impact of drivers and challenges in 2025 and 2030

3. Market Landscape

3.1 Market ecosystem

Chart on Parent Market
Data Table on - Parent Market

3.2 Market characteristics

Chart on Market characteristics analysis

3.3 Value chain analysis

Chart on Value chain analysis

4. Market Sizing

4.1 Market definition

Data Table on Offerings of companies included in the market definition

4.2 Market segment analysis

Market segments

4.3 Market size 2025

4.4 Market outlook: Forecast for 2025-2030

Chart on Global - Market size and forecast 2025-2030 ($ million)
Data Table on Global - Market size and forecast 2025-2030 ($ million)
Chart on Global Market: Year-over-year growth 2025-2030 (%)
Data Table on Global Market: Year-over-year growth 2025-2030 (%)

5. Historic Market Size

5.1 Global Pharmaceutical Contract Research And Manufacturing Market 2020 - 2024

Historic Market Size - Data Table on Global Pharmaceutical Contract Research And Manufacturing Market 2020 - 2024 ($ million)

5.2 Service segment analysis 2020 - 2024

Historic Market Size - Service Segment 2020 - 2024 ($ million)

5.3 End-user segment analysis 2020 - 2024

Historic Market Size - End-user Segment 2020 - 2024 ($ million)

5.4 Product Type segment analysis 2020 - 2024

Historic Market Size - Product Type Segment 2020 - 2024 ($ million)

5.5 Geography segment analysis 2020 - 2024

Historic Market Size - Geography Segment 2020 - 2024 ($ million)

5.6 Country segment analysis 2020 - 2024

Historic Market Size - Country Segment 2020 - 2024 ($ million)

6. Qualitative Analysis

6.1 Impact of AI on Global Pharmaceutical Contract Research and Manufacturing Market

6.2 Impact of geopolitical conflicts on Global Pharmaceutical Contract Research and Manufacturing Market

7. Five Forces Analysis

7.1 Five forces summary

Five forces analysis - Comparison between 2025 and 2030

7.2 Bargaining power of buyers

Bargaining power of buyers - Impact of key factors 2025 and 2030

7.3 Bargaining power of suppliers

Bargaining power of suppliers - Impact of key factors in 2025 and 2030

7.4 Threat of new entrants

Threat of new entrants - Impact of key factors in 2025 and 2030

7.5 Threat of substitutes

Threat of substitutes - Impact of key factors in 2025 and 2030

7.6 Threat of rivalry

Threat of rivalry - Impact of key factors in 2025 and 2030

7.7 Market condition

Chart on Market condition - Five forces 2025 and 2030

8. Market Segmentation by Service

8.1 Market segments

Chart on Service - Market share 2025-2030 (%)
Data Table on Service - Market share 2025-2030 (%)

8.2 Comparison by Service

Chart on Comparison by Service
Data Table on Comparison by Service

8.3 CMO - Market size and forecast 2025-2030

Chart on CMO - Market size and forecast 2025-2030 ($ million)
Data Table on CMO - Market size and forecast 2025-2030 ($ million)
Chart on CMO - Year-over-year growth 2025-2030 (%)
Data Table on CMO - Year-over-year growth 2025-2030 (%)

8.4 CRO - Market size and forecast 2025-2030

Chart on CRO - Market size and forecast 2025-2030 ($ million)
Data Table on CRO - Market size and forecast 2025-2030 ($ million)
Chart on CRO - Year-over-year growth 2025-2030 (%)
Data Table on CRO - Year-over-year growth 2025-2030 (%)

8.5 Market opportunity by Service

Market opportunity by Service ($ million)
Data Table on Market opportunity by Service ($ million)

9. Market Segmentation by End-user

9.1 Market segments

Chart on End-user - Market share 2025-2030 (%)
Data Table on End-user - Market share 2025-2030 (%)

9.2 Comparison by End-user

Chart on Comparison by End-user
Data Table on Comparison by End-user

9.3 Big pharmaceuticals - Market size and forecast 2025-2030

Chart on Big pharmaceuticals - Market size and forecast 2025-2030 ($ million)
Data Table on Big pharmaceuticals - Market size and forecast 2025-2030 ($ million)
Chart on Big pharmaceuticals - Year-over-year growth 2025-2030 (%)
Data Table on Big pharmaceuticals - Year-over-year growth 2025-2030 (%)

9.4 SMS pharmaceuticals - Market size and forecast 2025-2030

Chart on SMS pharmaceuticals - Market size and forecast 2025-2030 ($ million)
Data Table on SMS pharmaceuticals - Market size and forecast 2025-2030 ($ million)
Chart on SMS pharmaceuticals - Year-over-year growth 2025-2030 (%)
Data Table on SMS pharmaceuticals - Year-over-year growth 2025-2030 (%)

9.5 Generic pharmaceuticals - Market size and forecast 2025-2030

Chart on Generic pharmaceuticals - Market size and forecast 2025-2030 ($ million)
Data Table on Generic pharmaceuticals - Market size and forecast 2025-2030 ($ million)
Chart on Generic pharmaceuticals - Year-over-year growth 2025-2030 (%)
Data Table on Generic pharmaceuticals - Year-over-year growth 2025-2030 (%)

9.6 Market opportunity by End-user

Market opportunity by End-user ($ million)
Data Table on Market opportunity by End-user ($ million)

10. Market Segmentation by Product Type

10.1 Market segments

Chart on Product Type - Market share 2025-2030 (%)
Data Table on Product Type - Market share 2025-2030 (%)

10.2 Comparison by Product Type

Chart on Comparison by Product Type
Data Table on Comparison by Product Type

10.3 Small molecules - Market size and forecast 2025-2030

Chart on Small molecules - Market size and forecast 2025-2030 ($ million)
Data Table on Small molecules - Market size and forecast 2025-2030 ($ million)
Chart on Small molecules - Year-over-year growth 2025-2030 (%)
Data Table on Small molecules - Year-over-year growth 2025-2030 (%)

10.4 Large molecules - Market size and forecast 2025-2030

Chart on Large molecules - Market size and forecast 2025-2030 ($ million)
Data Table on Large molecules - Market size and forecast 2025-2030 ($ million)
Chart on Large molecules - Year-over-year growth 2025-2030 (%)
Data Table on Large molecules - Year-over-year growth 2025-2030 (%)

10.5 Market opportunity by Product Type

Market opportunity by Product Type ($ million)
Data Table on Market opportunity by Product Type ($ million)

11. Customer Landscape

11.1 Customer landscape overview

Analysis of price sensitivity, lifecycle, customer purchase basket, adoption rates, and purchase criteria

12. Geographic Landscape

12.1 Geographic segmentation

Chart on Market share by geography 2025-2030 (%)
Data Table on Market share by geography 2025-2030 (%)

12.2 Geographic comparison

Chart on Geographic comparison
Data Table on Geographic comparison

12.3 Asia - Market size and forecast 2025-2030

Chart on Asia - Market size and forecast 2025-2030 ($ million)
Data Table on Asia - Market size and forecast 2025-2030 ($ million)
Chart on Asia - Year-over-year growth 2025-2030 (%)
Data Table on Asia - Year-over-year growth 2025-2030 (%)
Chart on Regional Comparison - Asia
Data Table on Regional Comparison - Asia

12.3.1 China - Market size and forecast 2025-2030

Chart on China - Market size and forecast 2025-2030 ($ million)
Data Table on China - Market size and forecast 2025-2030 ($ million)
Chart on China - Year-over-year growth 2025-2030 (%)
Data Table on China - Year-over-year growth 2025-2030 (%)

12.3.2 India - Market size and forecast 2025-2030

Chart on India - Market size and forecast 2025-2030 ($ million)
Data Table on India - Market size and forecast 2025-2030 ($ million)
Chart on India - Year-over-year growth 2025-2030 (%)
Data Table on India - Year-over-year growth 2025-2030 (%)

12.3.3 Japan - Market size and forecast 2025-2030

Chart on Japan - Market size and forecast 2025-2030 ($ million)
Data Table on Japan - Market size and forecast 2025-2030 ($ million)
Chart on Japan - Year-over-year growth 2025-2030 (%)
Data Table on Japan - Year-over-year growth 2025-2030 (%)

12.3.4 South Korea - Market size and forecast 2025-2030

Chart on South Korea - Market size and forecast 2025-2030 ($ million)
Data Table on South Korea - Market size and forecast 2025-2030 ($ million)
Chart on South Korea - Year-over-year growth 2025-2030 (%)
Data Table on South Korea - Year-over-year growth 2025-2030 (%)

12.3.5 Thailand - Market size and forecast 2025-2030

Chart on Thailand - Market size and forecast 2025-2030 ($ million)
Data Table on Thailand - Market size and forecast 2025-2030 ($ million)
Chart on Thailand - Year-over-year growth 2025-2030 (%)
Data Table on Thailand - Year-over-year growth 2025-2030 (%)

12.3.6 Indonesia - Market size and forecast 2025-2030

Chart on Indonesia - Market size and forecast 2025-2030 ($ million)
Data Table on Indonesia - Market size and forecast 2025-2030 ($ million)
Chart on Indonesia - Year-over-year growth 2025-2030 (%)
Data Table on Indonesia - Year-over-year growth 2025-2030 (%)

12.4 North America - Market size and forecast 2025-2030

Chart on North America - Market size and forecast 2025-2030 ($ million)
Data Table on North America - Market size and forecast 2025-2030 ($ million)
Chart on North America - Year-over-year growth 2025-2030 (%)
Data Table on North America - Year-over-year growth 2025-2030 (%)
Chart on Regional Comparison - North America
Data Table on Regional Comparison - North America

12.4.1 US - Market size and forecast 2025-2030

Chart on US - Market size and forecast 2025-2030 ($ million)
Data Table on US - Market size and forecast 2025-2030 ($ million)
Chart on US - Year-over-year growth 2025-2030 (%)
Data Table on US - Year-over-year growth 2025-2030 (%)

12.4.2 Canada - Market size and forecast 2025-2030

Chart on Canada - Market size and forecast 2025-2030 ($ million)
Data Table on Canada - Market size and forecast 2025-2030 ($ million)
Chart on Canada - Year-over-year growth 2025-2030 (%)
Data Table on Canada - Year-over-year growth 2025-2030 (%)

12.4.3 Mexico - Market size and forecast 2025-2030

Chart on Mexico - Market size and forecast 2025-2030 ($ million)
Data Table on Mexico - Market size and forecast 2025-2030 ($ million)
Chart on Mexico - Year-over-year growth 2025-2030 (%)
Data Table on Mexico - Year-over-year growth 2025-2030 (%)

12.5 Europe - Market size and forecast 2025-2030

Chart on Europe - Market size and forecast 2025-2030 ($ million)
Data Table on Europe - Market size and forecast 2025-2030 ($ million)
Chart on Europe - Year-over-year growth 2025-2030 (%)
Data Table on Europe - Year-over-year growth 2025-2030 (%)
Chart on Regional Comparison - Europe
Data Table on Regional Comparison - Europe

12.5.1 Germany - Market size and forecast 2025-2030

Chart on Germany - Market size and forecast 2025-2030 ($ million)
Data Table on Germany - Market size and forecast 2025-2030 ($ million)
Chart on Germany - Year-over-year growth 2025-2030 (%)
Data Table on Germany - Year-over-year growth 2025-2030 (%)

12.5.2 UK - Market size and forecast 2025-2030

Chart on UK - Market size and forecast 2025-2030 ($ million)
Data Table on UK - Market size and forecast 2025-2030 ($ million)
Chart on UK - Year-over-year growth 2025-2030 (%)
Data Table on UK - Year-over-year growth 2025-2030 (%)

12.5.3 France - Market size and forecast 2025-2030

Chart on France - Market size and forecast 2025-2030 ($ million)
Data Table on France - Market size and forecast 2025-2030 ($ million)
Chart on France - Year-over-year growth 2025-2030 (%)
Data Table on France - Year-over-year growth 2025-2030 (%)

12.5.4 Italy - Market size and forecast 2025-2030

Chart on Italy - Market size and forecast 2025-2030 ($ million)
Data Table on Italy - Market size and forecast 2025-2030 ($ million)
Chart on Italy - Year-over-year growth 2025-2030 (%)
Data Table on Italy - Year-over-year growth 2025-2030 (%)

12.5.5 Spain - Market size and forecast 2025-2030

Chart on Spain - Market size and forecast 2025-2030 ($ million)
Data Table on Spain - Market size and forecast 2025-2030 ($ million)
Chart on Spain - Year-over-year growth 2025-2030 (%)
Data Table on Spain - Year-over-year growth 2025-2030 (%)

12.5.6 The Netherlands - Market size and forecast 2025-2030

Chart on The Netherlands - Market size and forecast 2025-2030 ($ million)
Data Table on The Netherlands - Market size and forecast 2025-2030 ($ million)
Chart on The Netherlands - Year-over-year growth 2025-2030 (%)
Data Table on The Netherlands - Year-over-year growth 2025-2030 (%)

12.6 Rest of World (ROW) - Market size and forecast 2025-2030

Chart on Rest of World (ROW) - Market size and forecast 2025-2030 ($ million)
Data Table on Rest of World (ROW) - Market size and forecast 2025-2030 ($ million)
Chart on Rest of World (ROW) - Year-over-year growth 2025-2030 (%)
Data Table on Rest of World (ROW) - Year-over-year growth 2025-2030 (%)
Chart on Regional Comparison - Rest of World (ROW)
Data Table on Regional Comparison - Rest of World (ROW)

12.6.1 Brazil - Market size and forecast 2025-2030

Chart on Brazil - Market size and forecast 2025-2030 ($ million)
Data Table on Brazil - Market size and forecast 2025-2030 ($ million)
Chart on Brazil - Year-over-year growth 2025-2030 (%)
Data Table on Brazil - Year-over-year growth 2025-2030 (%)

12.6.2 Saudi Arabia - Market size and forecast 2025-2030

Chart on Saudi Arabia - Market size and forecast 2025-2030 ($ million)
Data Table on Saudi Arabia - Market size and forecast 2025-2030 ($ million)
Chart on Saudi Arabia - Year-over-year growth 2025-2030 (%)
Data Table on Saudi Arabia - Year-over-year growth 2025-2030 (%)

12.6.3 UAE - Market size and forecast 2025-2030

Chart on UAE - Market size and forecast 2025-2030 ($ million)
Data Table on UAE - Market size and forecast 2025-2030 ($ million)
Chart on UAE - Year-over-year growth 2025-2030 (%)
Data Table on UAE - Year-over-year growth 2025-2030 (%)

12.6.4 South Africa - Market size and forecast 2025-2030

Chart on South Africa - Market size and forecast 2025-2030 ($ million)
Data Table on South Africa - Market size and forecast 2025-2030 ($ million)
Chart on South Africa - Year-over-year growth 2025-2030 (%)
Data Table on South Africa - Year-over-year growth 2025-2030 (%)

12.6.5 Israel - Market size and forecast 2025-2030

Chart on Israel - Market size and forecast 2025-2030 ($ million)
Data Table on Israel - Market size and forecast 2025-2030 ($ million)
Chart on Israel - Year-over-year growth 2025-2030 (%)
Data Table on Israel - Year-over-year growth 2025-2030 (%)

12.6.6 Turkey - Market size and forecast 2025-2030

Chart on Turkey - Market size and forecast 2025-2030 ($ million)
Data Table on Turkey - Market size and forecast 2025-2030 ($ million)
Chart on Turkey - Year-over-year growth 2025-2030 (%)
Data Table on Turkey - Year-over-year growth 2025-2030 (%)

12.6.7 Argentina - Market size and forecast 2025-2030

Chart on Argentina - Market size and forecast 2025-2030 ($ million)
Data Table on Argentina - Market size and forecast 2025-2030 ($ million)
Chart on Argentina - Year-over-year growth 2025-2030 (%)
Data Table on Argentina - Year-over-year growth 2025-2030 (%)

12.6.8 Colombia - Market size and forecast 2025-2030

Chart on Colombia - Market size and forecast 2025-2030 ($ million)
Data Table on Colombia - Market size and forecast 2025-2030 ($ million)
Chart on Colombia - Year-over-year growth 2025-2030 (%)
Data Table on Colombia - Year-over-year growth 2025-2030 (%)

12.7 Market opportunity by geography

Market opportunity by geography ($ million)
Data Tables on Market opportunity by geography ($ million)

13. Drivers, Challenges, and Opportunity

13.1 Market drivers

Accelerated adoption of digital technologies
Rise of personalized medicine initiatives
Expansion of rare disease therapeutics

13.2 Market challenges

Geopolitical supply chain vulnerabilities impacting markets
Escalating regulatory compliance and oversight
Technological complexity and workforce constraints

13.3 Impact of drivers and challenges

Impact of drivers and challenges in 2025 and 2030

13.4 Market opportunities

Expansion of cell therapies
Adoption of green chemistry and sustainability
Proliferation of decentralized clinical trial frameworks

14. Competitive Landscape

14.1 Overview

14.2

Overview on criticality of inputs and factors of differentiation

14.3 Landscape disruption

Overview on factors of disruption

14.4 Industry risks

Impact of key risks on business

15. Competitive Analysis

15.1 Companies profiled

Companies covered

15.2 Company ranking index

15.3 Market positioning of companies

Matrix on companies position and classification

15.4 Charles River Laboratories

Charles River Laboratories - Overview
Charles River Laboratories - Business segments
Charles River Laboratories - Key offerings
Charles River Laboratories - Segment focus
SWOT

15.5 Divis Laboratories Ltd.

Divis Laboratories Ltd. - Overview
Divis Laboratories Ltd. - Product / Service
Divis Laboratories Ltd. - Key offerings
SWOT

15.6 Eurofins Scientific SE

Eurofins Scientific SE - Overview
Eurofins Scientific SE - Business segments
Eurofins Scientific SE - Key offerings
Eurofins Scientific SE - Segment focus
SWOT

15.7 Evonik Industries AG

Evonik Industries AG - Overview
Evonik Industries AG - Business segments
Evonik Industries AG - Key news
Evonik Industries AG - Key offerings
Evonik Industries AG - Segment focus
SWOT

15.8 FUJIFILM Holdings Corp.

FUJIFILM Holdings Corp. - Overview
FUJIFILM Holdings Corp. - Business segments
FUJIFILM Holdings Corp. - Key news
FUJIFILM Holdings Corp. - Key offerings
FUJIFILM Holdings Corp. - Segment focus
SWOT

15.9 ICON plc

ICON plc - Overview
ICON plc - Product / Service
ICON plc - Key offerings
SWOT

15.10 IQVIA Holdings Inc.

IQVIA Holdings Inc. - Overview
IQVIA Holdings Inc. - Business segments
IQVIA Holdings Inc. - Key offerings
IQVIA Holdings Inc. - Segment focus
SWOT

15.11 Laboratory Holdings Inc.

Laboratory Holdings Inc. - Overview
Laboratory Holdings Inc. - Business segments
Laboratory Holdings Inc. - Key offerings
Laboratory Holdings Inc. - Segment focus
SWOT

15.12 Lonza Group Ltd.

Lonza Group Ltd. - Overview
Lonza Group Ltd. - Business segments
Lonza Group Ltd. - Key news
Lonza Group Ltd. - Key offerings
Lonza Group Ltd. - Segment focus
SWOT

15.13 Piramal Pharma Solutions

Piramal Pharma Solutions - Overview
Piramal Pharma Solutions - Business segments
Piramal Pharma Solutions - Key offerings
Piramal Pharma Solutions - Segment focus
SWOT

15.14 Samsung Biologics Co. Ltd.

Samsung Biologics Co. Ltd. - Overview
Samsung Biologics Co. Ltd. - Product / Service
Samsung Biologics Co. Ltd. - Key offerings
SWOT

15.15 Siegfried Holding AG

Siegfried Holding AG - Overview
Siegfried Holding AG - Business segments
Siegfried Holding AG - Key offerings
Siegfried Holding AG - Segment focus
SWOT

15.16 Syngene International Ltd.

Syngene International Ltd. - Overview
Syngene International Ltd. - Product / Service
Syngene International Ltd. - Key offerings
SWOT

15.17 Thermo Fisher Scientific Inc.

Thermo Fisher Scientific Inc. - Overview
Thermo Fisher Scientific Inc. - Business segments
Thermo Fisher Scientific Inc. - Key news
Thermo Fisher Scientific Inc. - Key offerings
Thermo Fisher Scientific Inc. - Segment focus
SWOT

15.18 WuXi AppTec Co. Ltd.

WuXi AppTec Co. Ltd. - Overview
WuXi AppTec Co. Ltd. - Business segments
WuXi AppTec Co. Ltd. - Key offerings
WuXi AppTec Co. Ltd. - Segment focus
SWOT

16. Appendix

16.1 Scope of the report

Market definition
Objectives
Notes and caveats

16.2 Inclusions and exclusions checklist

Inclusions checklist
Exclusions checklist

16.3 Currency conversion rates for US$

16.4 Research methodology

16.5 Data procurement

Information sources

16.6 Data validation

16.7 Validation techniques employed for market sizing

16.8 Data synthesis

16.9 360 degree market analysis

16.10 List of abbreviations

Research Methodology

Technavio presents a detailed picture of the market by way of study, synthesis, and summation of data from multiple sources. The analysts have presented the various facets of the market with a particular focus on identifying the key industry influencers. The data thus presented is comprehensive, reliable, and the result of extensive research, both primary and secondary.

INFORMATION SOURCES

Primary sources

  • Manufacturers and suppliers
  • Channel partners
  • Industry experts
  • Strategic decision makers

Secondary sources

  • Industry journals and periodicals
  • Government data
  • Financial reports of key industry players
  • Historical data
  • Press releases

DATA ANALYSIS

Data Synthesis

  • Collation of data
  • Estimation of key figures
  • Analysis of derived insights

Data Validation

  • Triangulation with data models
  • Reference against proprietary databases
  • Corroboration with industry experts

REPORT WRITING

Qualitative

  • Market drivers
  • Market challenges
  • Market trends
  • Five forces analysis

Quantitative

  • Market size and forecast
  • Market segmentation
  • Geographical insights
  • Competitive landscape

Interested in this report?

Get your sample now to see our research methodology and insights!

Download Now

Frequently Asked Questions

Pharmaceutical Contract Research And Manufacturing market growth will increase by USD 190387.9 million during 2026-2030.

The Pharmaceutical Contract Research And Manufacturing market is expected to grow at a CAGR of 11.9% during 2026-2030.

Pharmaceutical Contract Research And Manufacturing market is segmented by Service (CMO, CRO) End-user (Big pharmaceuticals, SMS pharmaceuticals, Generic pharmaceuticals) Product type (Small molecules, Large molecules)

Almac Group Ltd., Boehringer Ingelheim GmbH, Cambrex Corp., Catalent Inc., Charles River Laboratories, Corden Pharma Intl. GmbH, Curia Global Inc., Divis Laboratories Ltd., Eurofins Scientific SE, Evonik Industries AG, FUJIFILM Holdings Corp., Hovione S.A., ICON plc, IQVIA Holdings Inc., Laboratory Holdings Inc., Lonza Group Ltd., Parexel International Corp., Piramal Pharma Solutions, Recipharm AB, Samsung Biologics Co. Ltd., Siegfried Holding AG, Syngene International Ltd., Thermo Fisher Scientific Inc., Vetter Pharma Fertigung GmbH, WuXi AppTec Co. Ltd. are a few of the key vendors in the Pharmaceutical Contract Research And Manufacturing market.

Asia will register the highest growth rate of 39.1% among the other regions. Therefore, the Pharmaceutical Contract Research And Manufacturing market in Asia is expected to garner significant business opportunities for the vendors during the forecast period.

China, India, Japan, South Korea, Thailand, Indonesia, US, Canada, Mexico, Germany, UK, France, Italy, Spain, The Netherlands, Brazil, Saudi Arabia, UAE, South Africa, Israel, Turkey, Argentina, Colombia

  • Accelerated adoption of digital technologies is the driving factor this market.

The Pharmaceutical Contract Research And Manufacturing market vendors should focus on grabbing business opportunities from the Service segment as it accounted for the largest market share in the base year.
RIA - Research AI Assistant
Ask RIA
