Personalized Gifts Market Analysis, Size, and Forecast 2026-2030: North America (US, Canada, and Mexico), Europe (Germany, France, and UK), APAC (China, India, and Japan), South America (Brazil and Argentina), Middle East and Africa (UAE, Saudi Arabia, and South Africa), and Rest of World (ROW)

Personalized Gifts Market Analysis, Size, and Forecast 2026-2030:
North America (US, Canada, and Mexico), Europe (Germany, France, and UK), APAC (China, India, and Japan), South America (Brazil and Argentina), Middle East and Africa (UAE, Saudi Arabia, and South Africa), and Rest of World (ROW)

Published: Apr 2026 289 Pages SKU: IRTNTR45161

Market Overview at a Glance

$13.61 B
Market Opportunity
6.8%
CAGR 2025 - 2030
30.2%
North America Growth
$19.65 B
Non-photo personalized gifts segment 2024

Personalized Gifts Market Size 2026-2030

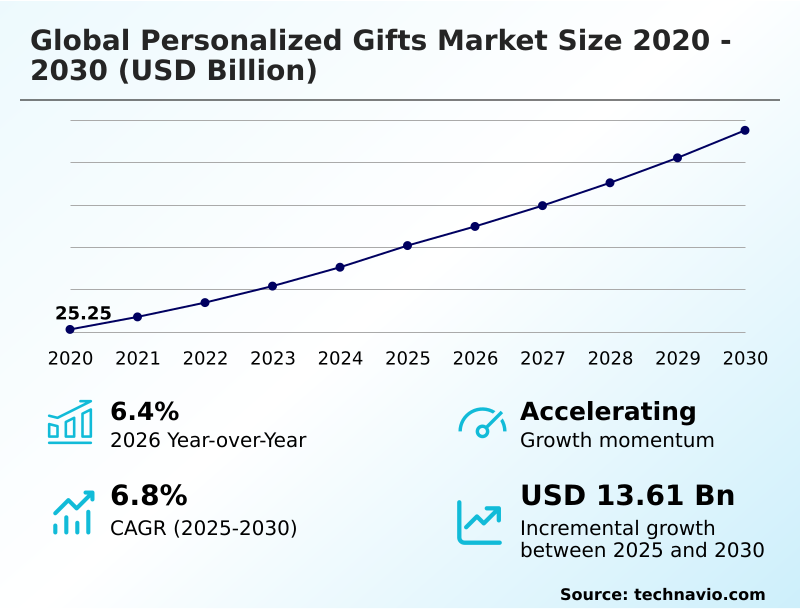
The personalized gifts market size is valued to increase by USD 13.61 billion, at a CAGR of 6.8% from 2025 to 2030. Technological advancements in production and digital fabrication will drive the personalized gifts market.

Major Market Trends & Insights

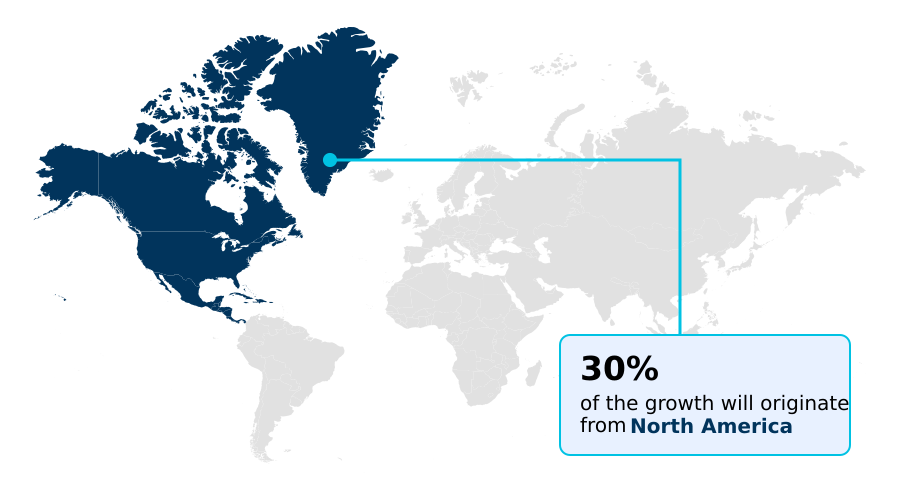
  • North America dominated the market and accounted for a 30.2% growth during the forecast period.
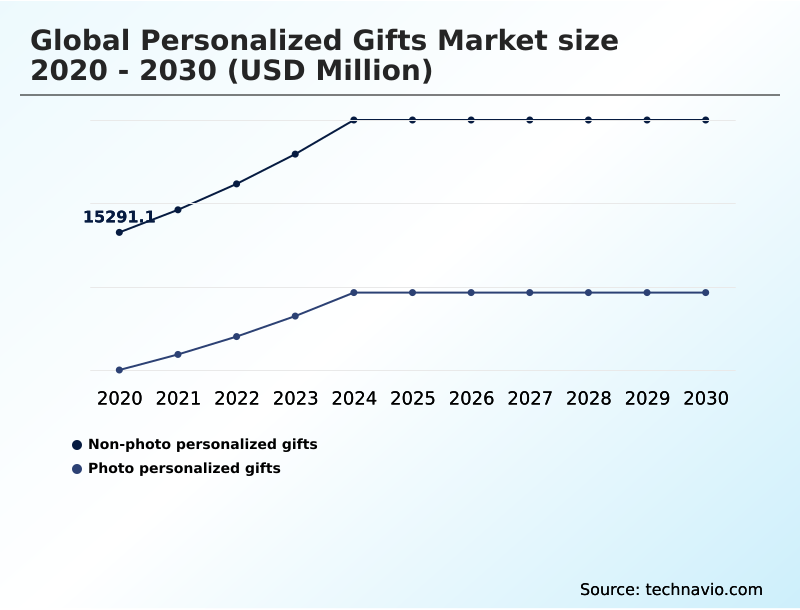
  • By Product - Non-photo personalized gifts segment was valued at USD 19.65 billion in 2024
  • By Distribution Channel - Online segment accounted for the largest market revenue share in 2024

Market Size & Forecast

  • Market Opportunities: USD 23.53 billion
  • Market Future Opportunities: USD 13.61 billion
  • CAGR from 2025 to 2030 : 6.8%

Market Summary

  • The personalized gifts market is undergoing a significant transformation, moving from simple monograms to complex, on-demand creations. This evolution is propelled by digital fabrication technologies that allow for the high-speed production of unique items, effectively meeting consumer demand for meaningful, sentiment-driven products.
  • The integration of generative AI design interfaces has further democratized creativity, enabling individuals to produce bespoke artwork for gifts without needing professional design skills. This shift towards hyper-personalization is creating a robust ecosystem where e-commerce platforms with intuitive design tools and direct-to-consumer models thrive.
  • For instance, a company can leverage real-time sales data to pivot production, maintaining minimal inventory of blank substrates and customizing them only upon order, thus optimizing the supply chain against raw material price volatility. However, this reliance on personal data presents significant cybersecurity and privacy compliance challenges.
  • Navigating these complexities while delivering high-quality, emotionally resonant products at scale defines the current competitive landscape, where technological agility and consumer trust are paramount.

What will be the Size of the Personalized Gifts Market during the forecast period?

Get Key Insights on Market Forecast (PDF) Request Free Sample

How is the Personalized Gifts Market Segmented?

The personalized gifts industry research report provides comprehensive data (region-wise segment analysis), with forecasts and estimates in "USD million" for the period 2026-2030, as well as historical data from 2020-2024 for the following segments.

  • Product
    • Non-photo personalized gifts
    • Photo personalized gifts
  • Distribution channel
    • Online
    • Offline
  • End-user
    • Women
    • Men
    • Kids
  • Geography
    • North America
      • US
      • Canada
      • Mexico
    • Europe
      • Germany
      • France
      • UK
    • APAC
      • China
      • India
      • Japan
    • South America
      • Brazil
      • Argentina
    • Middle East and Africa
      • UAE
      • Saudi Arabia
      • South Africa
    • Rest of World (ROW)

By Product Insights

The non-photo personalized gifts segment is estimated to witness significant growth during the forecast period.

The non-photo personalized gifts segment focuses on items emphasizing craftsmanship and professional aesthetics, such as monogrammed leather goods and bespoke home decor.

This category relies on physical transformation techniques like digital embroidery and direct to garment printing, which alter material surfaces for a premium finish. The manufacturing workflow requires specialized machinery and technical skill, often supported by 3d modeling for design previews.

The appeal lies in the understated elegance and exclusivity these items convey. Firms are leveraging data driven marketing strategies and advanced customer relationship management systems to refine offerings.

This focus on quality and durability is particularly valued in corporate gifting, where investments in advanced digital commerce interfaces for experiential retail have improved design transfer accuracy by over 15%.

Request Free Sample

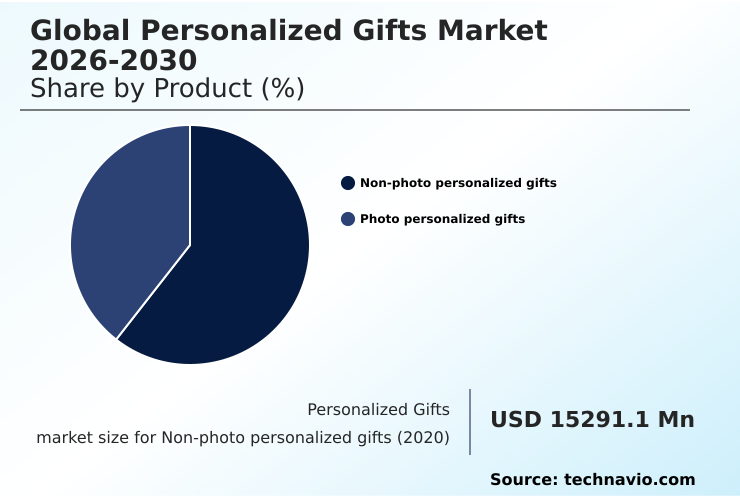
The Non-photo personalized gifts segment was valued at USD 19.65 billion in 2024 and showed a gradual increase during the forecast period.

Request Free Sample

Regional Analysis

North America is estimated to contribute 30.2% to the growth of the global market during the forecast period.Technavio’s analysts have elaborately explained the regional trends and drivers that shape the market during the forecast period.

See How Personalized Gifts Market Demand is Rising in North America Request Free Sample

North America currently represents the largest geographic segment, accounting for over 30% of the market opportunity, driven by high consumer spending on items like custom engraved jewelry. Europe follows closely, with a strong emphasis on quality and craftsmanship.

However, the most rapid expansion is occurring in APAC, which exhibits the highest regional growth rate of 7.6%, fueled by rising disposable incomes and widespread mobile commerce adoption.

In this region, autonomous ai agents are being deployed to manage supply chains, while high resolution sublimation techniques are used to apply user uploaded photographs to a variety of goods.

The increasing use of generative design apis and dynamic pricing algorithms is enabling local manufacturers to compete effectively.

Furthermore, businesses across all regions are increasingly adopting sustainable procurement strategies to align with corporate social responsibility goals, a trend that is reshaping sourcing and production.

Market Dynamics

Our researchers analyzed the data with 2025 as the base year, along with the key drivers, trends, and challenges. A holistic analysis of drivers will help companies refine their marketing strategies to gain a competitive advantage.

  • The strategic direction of the personalized gifts market is increasingly shaped by the need to master several interconnected operational domains. Firms are exploring ai driven hyper personalization for gifts not just for product recommendations but to dynamically generate content, a shift that requires robust frameworks for managing data privacy in gift customization.
  • Simultaneously, the push for sustainable and ethical sourcing in gifting is compelling a re-evaluation of supply chains, where the benefits of on-demand production must be weighed against sourcing costs. Effective corporate gifting procurement strategies now demand transparency and alignment with ESG mandates.
  • The rise of omnichannel strategies for gift retailers is creating complex logistical puzzles, particularly concerning the challenges of last mile delivery for personalized items. To address this, many are adopting regionalized micro fulfillment for fast delivery, a model proven to reduce transit times by more than 25% compared to centralized warehousing.
  • This is complemented by the impact of social commerce on gift sales and the integration of ar for gift product visualization, which are reshaping customer engagement. Success now hinges on balancing cost and quality in on-demand production while leveraging predictive intent for gift recommendations, implementing circular economy models for gifts, and optimizing supply chains for seasonal demand.

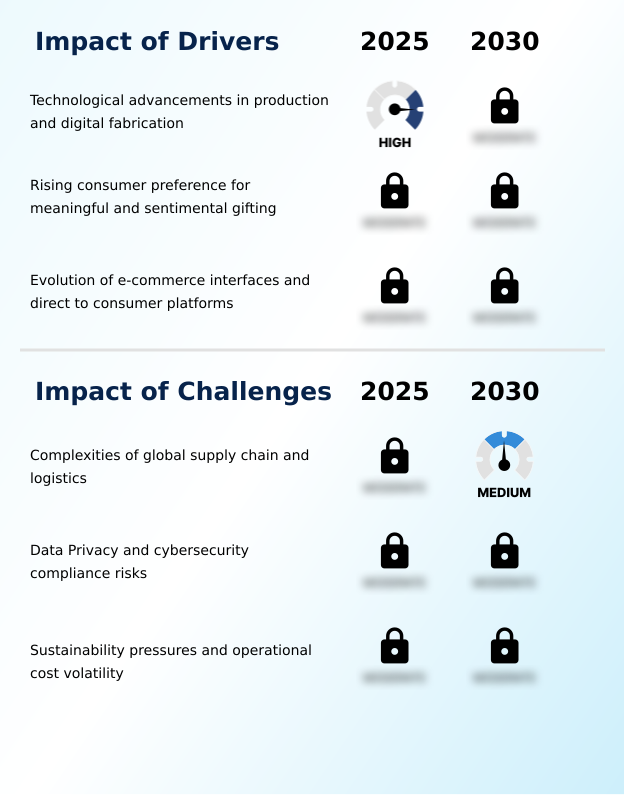
What are the key market drivers leading to the rise in the adoption of Personalized Gifts Industry?

  • Technological advancements in production and digital fabrication technologies are the primary drivers propelling market expansion and enabling mass customization.

  • Key market drivers are centered on the evolution of digital commerce interfaces and digital fabrication technologies.
  • The widespread adoption of on demand production, facilitated by laser engraving technology and cloud based automated workflows, has allowed companies to reduce inventory holding costs by up to 35%. This efficiency enables competitive pricing within direct to consumer models.
  • The consumer shift toward meaningful gifting is supported by an omnichannel ecosystem that blends digital convenience with physical touchpoints. The emergence of circular gifting models and the convenience of digital wallets for quick commerce transactions are also propelling growth.
  • The ability for platforms to provide intuitive and interactive design experiences has been a critical factor, with user-friendly interfaces leading to a 15% uplift in average order value.

What are the market trends shaping the Personalized Gifts Industry?

  • The market is witnessing a significant shift toward AI-driven hyper-personalization. This includes the use of predictive intent modeling to anticipate consumer gifting needs before a search is initiated.

  • The personalized gifts market is being reshaped by a move toward AI-driven hyper-personalization and predictive intent modeling. The use of generative AI design interfaces and text to image generation tools allows consumers to create bespoke product suggestions and hyper personalized product variations, lowering the barrier to entry for custom design.
  • This trend has led to a 25% increase in user engagement on platforms that offer these tools. AI powered personalization engines are enabling real time design modification, while the integration of augmented reality previews improves conversion rates by allowing customers to visualize products before purchase.
  • The rise of social commerce integration has also been pivotal, with some brands seeing a 40% share of their referral traffic originate from these channels, demonstrating a clear shift in consumer discovery and purchasing behavior.

What challenges does the Personalized Gifts Industry face during its growth?

  • The inherent complexities of global supply chains and international logistics present a key challenge affecting timely delivery and operational costs.

  • Navigating operational complexities remains a primary challenge. The reliance on fragmented global supply chains for print on demand services exposes firms to significant logistical volatility, impacting the effectiveness of predictive inventory replenishment.
  • To mitigate this, companies are adopting regionalized micro fulfillment strategies, which can reduce last mile delivery service costs by 20% but require substantial investment in omnichannel inventory management and automated quality control systems. An AI driven supply chain helps manage these hyper local logistics networks.
  • Furthermore, data privacy regulations necessitate robust security for automated image processing and the handling of personal information. Failure to comply can result in significant financial penalties, with a single data breach capable of eroding consumer trust and reducing customer retention by over 50%.

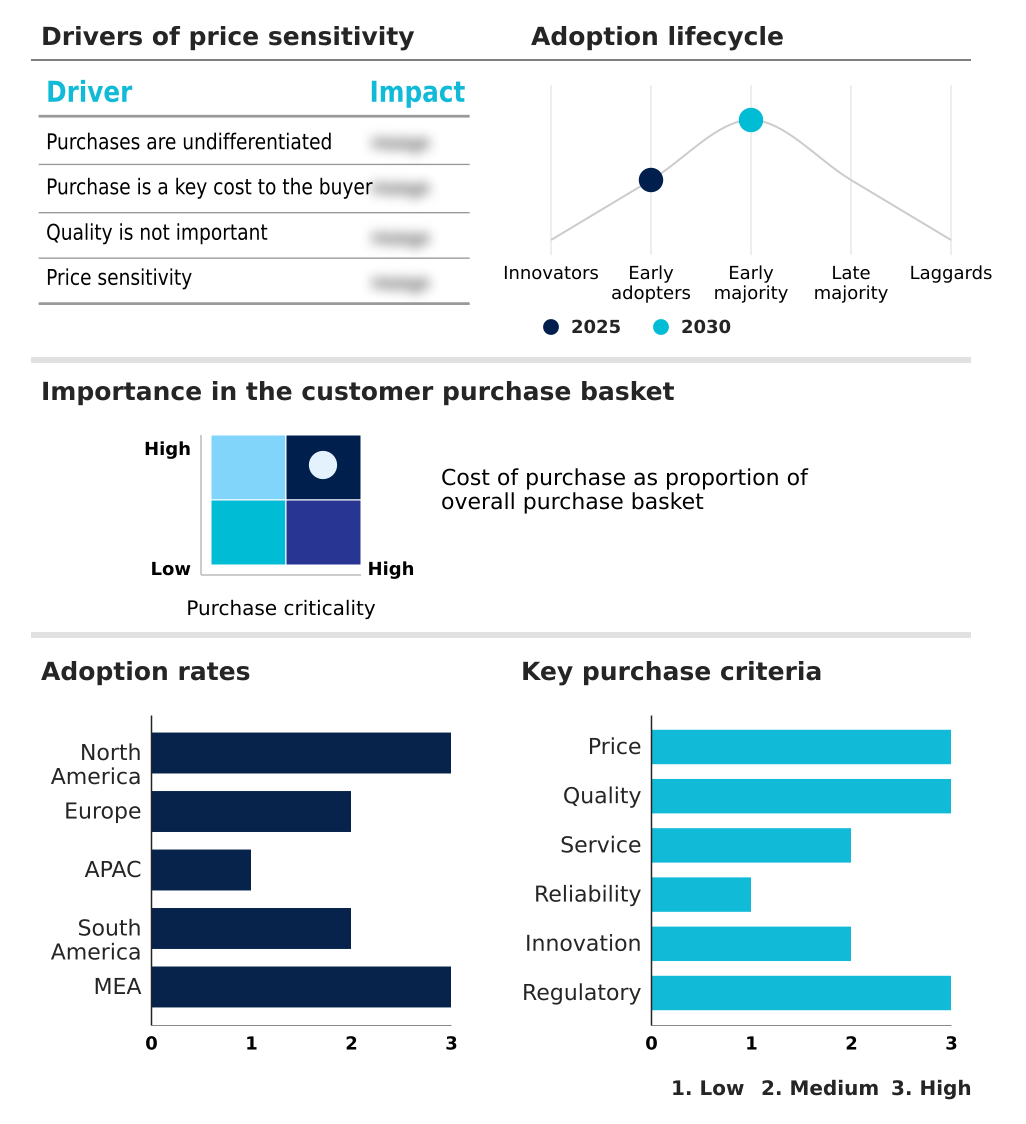
Exclusive Technavio Analysis on Customer Landscape

The personalized gifts market forecasting report includes the adoption lifecycle of the market, covering from the innovator’s stage to the laggard’s stage. It focuses on adoption rates in different regions based on penetration. Furthermore, the personalized gifts market report also includes key purchase criteria and drivers of price sensitivity to help companies evaluate and develop their market growth analysis strategies.

Customer Landscape of Personalized Gifts Industry

Competitive Landscape

Companies are implementing various strategies, such as strategic alliances, personalized gifts market forecast, partnerships, mergers and acquisitions, geographical expansion, and product/service launches, to enhance their presence in the industry.

American Greetings Corp. - Offers a range of personalized gifts, including customized physical and digital greeting cards, meeting consumer demand for unique celebratory items.

The industry research and growth report includes detailed analyses of the competitive landscape of the market and information about key companies, including:

  • American Greetings Corp.
  • American Stationery Co. Inc.
  • CafePress Inc.
  • Card Factory plc
  • Chococraft India Pvt. Ltd.
  • Cimpress Plc
  • Erffmeyer & Son Co Inc
  • Fat Brain Toys LLC
  • Ferns N Petals Pvt. Ltd.
  • Funkypigeon
  • Giftiliya India Pvt. Ltd.
  • Giftographics LLC
  • Godiva Chocolatier Inc.
  • Hallmark Cards Inc.
  • Personal Creations
  • Pinnacle Promotions Inc.
  • Redbubble Ltd.
  • Shutterfly Inc.
  • Spencer and Co.
  • The Walt Disney Co.

Qualitative and quantitative analysis of companies has been conducted to help clients understand the wider business environment as well as the strengths and weaknesses of key industry players. Data is qualitatively analyzed to categorize companies as pure play, category-focused, industry-focused, and diversified; it is quantitatively analyzed to categorize companies as dominant, leading, strong, tentative, and weak.

Recent Development and News in Personalized gifts market

  • In September 2024, Shutterfly Inc. announced the integration of generative AI design tools across its platform, enabling users to create unique artwork from text prompts for various personalized products.
  • In November 2024, Cimpress Plc launched a network of regionalized micro-fulfillment centers across North America, aiming to reduce delivery times for its Vistaprint brand by up to 40%.
  • In February 2025, Redbubble Ltd. partnered with a leading retail technology provider to deploy an AI-driven predictive intent model, offering hyper-personalized product suggestions to its global user base.
  • In April 2025, Card Factory plc introduced a new line of sustainable personalized gifts, utilizing ethically sourced materials and featuring a transparent carbon tracking system for each order.

Dive into Technavio’s robust research methodology, blending expert interviews, extensive data synthesis, and validated models for unparalleled Personalized Gifts Market insights. See full methodology.

Market Scope
Page number 289
Base year 2025
Historic period 2020-2024
Forecast period 2026-2030
Growth momentum & CAGR Accelerate at a CAGR of 6.8%
Market growth 2026-2030 USD 13613.1 million
Market structure Fragmented
YoY growth 2025-2026(%) 6.4%
Key countries US, Canada, Mexico, Germany, France, UK, Italy, Spain, The Netherlands, China, India, Japan, South Korea, Australia, Indonesia, Brazil, Argentina, Chile, UAE, Saudi Arabia, South Africa, Turkey and Egypt
Competitive landscape Leading Companies, Market Positioning of Companies, Competitive Strategies, and Industry Risks

Request Free Sample

Research Analyst Overview

  • The personalized gifts market is defined by its rapid technological evolution, where on demand production is now the standard. The integration of advanced digital fabrication technologies, including direct to garment printing and laser engraving technology, has enabled a high degree of customization at scale. This shift is compelling businesses to adopt direct to consumer models to maintain margins.
  • Boardroom decisions are increasingly focused on balancing the capital expenditure for technologies like 3d modeling and high resolution sublimation against the operational gains from cloud based automated workflows. For example, firms that have implemented real time design modification capabilities have reported a 20% reduction in production errors.
  • The landscape is further shaped by generative ai design interfaces, bespoke home decor trends, and the popularity of custom engraved jewelry and monogrammed leather goods. Success hinges on mastering an ai driven supply chain, from predictive inventory replenishment to omnichannel inventory management and the use of autonomous ai agents.

What are the Key Data Covered in this Personalized Gifts Market Research and Growth Report?

  • What is the expected growth of the Personalized Gifts Market between 2026 and 2030?

    • USD 13.61 billion, at a CAGR of 6.8%

  • What segmentation does the market report cover?

    • The report is segmented by Product (Non-photo personalized gifts, and Photo personalized gifts), Distribution Channel (Online, and Offline), End-user (Women, Men, and Kids) and Geography (North America, Europe, APAC, South America, Middle East and Africa)

  • Which regions are analyzed in the report?

    • North America, Europe, APAC, South America and Middle East and Africa

  • What are the key growth drivers and market challenges?

    • Technological advancements in production and digital fabrication, Complexities of global supply chain and logistics

  • Who are the major players in the Personalized Gifts Market?

    • American Greetings Corp., American Stationery Co. Inc., CafePress Inc., Card Factory plc, Chococraft India Pvt. Ltd., Cimpress Plc, Erffmeyer & Son Co Inc, Fat Brain Toys LLC, Ferns N Petals Pvt. Ltd., Funkypigeon, Giftiliya India Pvt. Ltd., Giftographics LLC, Godiva Chocolatier Inc., Hallmark Cards Inc., Personal Creations, Pinnacle Promotions Inc., Redbubble Ltd., Shutterfly Inc., Spencer and Co. and The Walt Disney Co.

Market Research Insights

  • The market's dynamism is driven by the convergence of technology and consumer expectations for unique experiences. The adoption of regionalized micro fulfillment has enabled businesses to reduce delivery times by over 30% compared to centralized models, a critical factor for time-sensitive gifts.
  • This logistical agility is supported by an omnichannel ecosystem where quick commerce and seamless digital wallets enhance the customer journey. Social commerce integration has become a primary discovery channel, with conversion rates from these platforms improving by nearly 20% year-over-year.
  • As firms adopt ai powered personalization engines and data driven marketing strategies, they are better able to leverage predictive intent modeling. Furthermore, the implementation of automated quality control systems ensures consistency across decentralized production networks, building brand trust and supporting sustainable procurement strategies aligned with corporate social responsibility goals.

We can help! Our analysts can customize this personalized gifts market research report to meet your requirements.

Get in touch

1. Executive Summary

1.1 Market overview

Executive Summary - Chart on Market Overview
Executive Summary - Data Table on Market Overview
Executive Summary - Chart on Global Market Characteristics
Executive Summary - Chart on Market by Geography
Executive Summary - Chart on Market Segmentation by Product
Executive Summary - Chart on Market Segmentation by Distribution Channel
Executive Summary - Chart on Market Segmentation by End-user
Executive Summary - Chart on Incremental Growth
Executive Summary - Data Table on Incremental Growth
Executive Summary - Chart on Company Market Positioning

2. Technavio Analysis

2.1 Analysis of price sensitivity, lifecycle, customer purchase basket, adoption rates, and purchase criteria

2.2 Criticality of inputs and Factors of differentiation

Chart on Overview on criticality of inputs and factors of differentiation

2.3 Factors of disruption

Chart on Overview on factors of disruption

2.4 Impact of drivers and challenges

Chart on Impact of drivers and challenges in 2025 and 2030

3. Market Landscape

3.1 Market ecosystem

Chart on Parent Market
Data Table on - Parent Market

3.2 Market characteristics

Chart on Market characteristics analysis

3.3 Value chain analysis

Chart on Value chain analysis

4. Market Sizing

4.1 Market definition

Data Table on Offerings of companies included in the market definition

4.2 Market segment analysis

Market segments

4.3 Market size 2025

4.4 Market outlook: Forecast for 2025-2030

Chart on Global - Market size and forecast 2025-2030 ($ million)
Data Table on Global - Market size and forecast 2025-2030 ($ million)
Chart on Global Market: Year-over-year growth 2025-2030 (%)
Data Table on Global Market: Year-over-year growth 2025-2030 (%)

5. Historic Market Size

5.1 Global Personalized Gifts Market 2020 - 2024

Historic Market Size - Data Table on Global Personalized Gifts Market 2020 - 2024 ($ million)

5.2 Product segment analysis 2020 - 2024

Historic Market Size - Product Segment 2020 - 2024 ($ million)

5.3 Distribution Channel segment analysis 2020 - 2024

Historic Market Size - Distribution Channel Segment 2020 - 2024 ($ million)

5.4 End-user segment analysis 2020 - 2024

Historic Market Size - End-user Segment 2020 - 2024 ($ million)

5.5 Geography segment analysis 2020 - 2024

Historic Market Size - Geography Segment 2020 - 2024 ($ million)

5.6 Country segment analysis 2020 - 2024

Historic Market Size - Country Segment 2020 - 2024 ($ million)

6. Qualitative Analysis

6.1 Impact of AI on global personalized gifts market

6.2 Impact of geopolitical conflicts on global personalized gifts market

7. Five Forces Analysis

7.1 Five forces summary

Five forces analysis - Comparison between 2025 and 2030

7.2 Bargaining power of buyers

Bargaining power of buyers - Impact of key factors 2025 and 2030

7.3 Bargaining power of suppliers

Bargaining power of suppliers - Impact of key factors in 2025 and 2030

7.4 Threat of new entrants

Threat of new entrants - Impact of key factors in 2025 and 2030

7.5 Threat of substitutes

Threat of substitutes - Impact of key factors in 2025 and 2030

7.6 Threat of rivalry

Threat of rivalry - Impact of key factors in 2025 and 2030

7.7 Market condition

Chart on Market condition - Five forces 2025 and 2030

8. Market Segmentation by Product

8.1 Market segments

Chart on Product - Market share 2025-2030 (%)
Data Table on Product - Market share 2025-2030 (%)

8.2 Comparison by Product

Chart on Comparison by Product
Data Table on Comparison by Product

8.3 Non-photo personalized gifts - Market size and forecast 2025-2030

Chart on Non-photo personalized gifts - Market size and forecast 2025-2030 ($ million)
Data Table on Non-photo personalized gifts - Market size and forecast 2025-2030 ($ million)
Chart on Non-photo personalized gifts - Year-over-year growth 2025-2030 (%)
Data Table on Non-photo personalized gifts - Year-over-year growth 2025-2030 (%)

8.4 Photo personalized gifts - Market size and forecast 2025-2030

Chart on Photo personalized gifts - Market size and forecast 2025-2030 ($ million)
Data Table on Photo personalized gifts - Market size and forecast 2025-2030 ($ million)
Chart on Photo personalized gifts - Year-over-year growth 2025-2030 (%)
Data Table on Photo personalized gifts - Year-over-year growth 2025-2030 (%)

8.5 Market opportunity by Product

Market opportunity by Product ($ million)
Data Table on Market opportunity by Product ($ million)

9. Market Segmentation by Distribution Channel

9.1 Market segments

Chart on Distribution Channel - Market share 2025-2030 (%)
Data Table on Distribution Channel - Market share 2025-2030 (%)

9.2 Comparison by Distribution Channel

Chart on Comparison by Distribution Channel
Data Table on Comparison by Distribution Channel

9.3 Online - Market size and forecast 2025-2030

Chart on Online - Market size and forecast 2025-2030 ($ million)
Data Table on Online - Market size and forecast 2025-2030 ($ million)
Chart on Online - Year-over-year growth 2025-2030 (%)
Data Table on Online - Year-over-year growth 2025-2030 (%)

9.4 Offline - Market size and forecast 2025-2030

Chart on Offline - Market size and forecast 2025-2030 ($ million)
Data Table on Offline - Market size and forecast 2025-2030 ($ million)
Chart on Offline - Year-over-year growth 2025-2030 (%)
Data Table on Offline - Year-over-year growth 2025-2030 (%)

9.5 Market opportunity by Distribution Channel

Market opportunity by Distribution Channel ($ million)
Data Table on Market opportunity by Distribution Channel ($ million)

10. Market Segmentation by End-user

10.1 Market segments

Chart on End-user - Market share 2025-2030 (%)
Data Table on End-user - Market share 2025-2030 (%)

10.2 Comparison by End-user

Chart on Comparison by End-user
Data Table on Comparison by End-user

10.3 Women - Market size and forecast 2025-2030

Chart on Women - Market size and forecast 2025-2030 ($ million)
Data Table on Women - Market size and forecast 2025-2030 ($ million)
Chart on Women - Year-over-year growth 2025-2030 (%)
Data Table on Women - Year-over-year growth 2025-2030 (%)

10.4 Men - Market size and forecast 2025-2030

Chart on Men - Market size and forecast 2025-2030 ($ million)
Data Table on Men - Market size and forecast 2025-2030 ($ million)
Chart on Men - Year-over-year growth 2025-2030 (%)
Data Table on Men - Year-over-year growth 2025-2030 (%)

10.5 Kids - Market size and forecast 2025-2030

Chart on Kids - Market size and forecast 2025-2030 ($ million)
Data Table on Kids - Market size and forecast 2025-2030 ($ million)
Chart on Kids - Year-over-year growth 2025-2030 (%)
Data Table on Kids - Year-over-year growth 2025-2030 (%)

10.6 Market opportunity by End-user

Market opportunity by End-user ($ million)
Data Table on Market opportunity by End-user ($ million)

11. Customer Landscape

11.1 Customer landscape overview

Analysis of price sensitivity, lifecycle, customer purchase basket, adoption rates, and purchase criteria

12. Geographic Landscape

12.1 Geographic segmentation

Chart on Market share by geography 2025-2030 (%)
Data Table on Market share by geography 2025-2030 (%)

12.2 Geographic comparison

Chart on Geographic comparison
Data Table on Geographic comparison

12.3 North America - Market size and forecast 2025-2030

Chart on North America - Market size and forecast 2025-2030 ($ million)
Data Table on North America - Market size and forecast 2025-2030 ($ million)
Chart on North America - Year-over-year growth 2025-2030 (%)
Data Table on North America - Year-over-year growth 2025-2030 (%)
Chart on Regional Comparison - North America
Data Table on Regional Comparison - North America

12.3.1 US - Market size and forecast 2025-2030

Chart on US - Market size and forecast 2025-2030 ($ million)
Data Table on US - Market size and forecast 2025-2030 ($ million)
Chart on US - Year-over-year growth 2025-2030 (%)
Data Table on US - Year-over-year growth 2025-2030 (%)

12.3.2 Canada - Market size and forecast 2025-2030

Chart on Canada - Market size and forecast 2025-2030 ($ million)
Data Table on Canada - Market size and forecast 2025-2030 ($ million)
Chart on Canada - Year-over-year growth 2025-2030 (%)
Data Table on Canada - Year-over-year growth 2025-2030 (%)

12.3.3 Mexico - Market size and forecast 2025-2030

Chart on Mexico - Market size and forecast 2025-2030 ($ million)
Data Table on Mexico - Market size and forecast 2025-2030 ($ million)
Chart on Mexico - Year-over-year growth 2025-2030 (%)
Data Table on Mexico - Year-over-year growth 2025-2030 (%)

12.4 Europe - Market size and forecast 2025-2030

Chart on Europe - Market size and forecast 2025-2030 ($ million)
Data Table on Europe - Market size and forecast 2025-2030 ($ million)
Chart on Europe - Year-over-year growth 2025-2030 (%)
Data Table on Europe - Year-over-year growth 2025-2030 (%)
Chart on Regional Comparison - Europe
Data Table on Regional Comparison - Europe

12.4.1 Germany - Market size and forecast 2025-2030

Chart on Germany - Market size and forecast 2025-2030 ($ million)
Data Table on Germany - Market size and forecast 2025-2030 ($ million)
Chart on Germany - Year-over-year growth 2025-2030 (%)
Data Table on Germany - Year-over-year growth 2025-2030 (%)

12.4.2 France - Market size and forecast 2025-2030

Chart on France - Market size and forecast 2025-2030 ($ million)
Data Table on France - Market size and forecast 2025-2030 ($ million)
Chart on France - Year-over-year growth 2025-2030 (%)
Data Table on France - Year-over-year growth 2025-2030 (%)

12.4.3 UK - Market size and forecast 2025-2030

Chart on UK - Market size and forecast 2025-2030 ($ million)
Data Table on UK - Market size and forecast 2025-2030 ($ million)
Chart on UK - Year-over-year growth 2025-2030 (%)
Data Table on UK - Year-over-year growth 2025-2030 (%)

12.4.4 Italy - Market size and forecast 2025-2030

Chart on Italy - Market size and forecast 2025-2030 ($ million)
Data Table on Italy - Market size and forecast 2025-2030 ($ million)
Chart on Italy - Year-over-year growth 2025-2030 (%)
Data Table on Italy - Year-over-year growth 2025-2030 (%)

12.4.5 Spain - Market size and forecast 2025-2030

Chart on Spain - Market size and forecast 2025-2030 ($ million)
Data Table on Spain - Market size and forecast 2025-2030 ($ million)
Chart on Spain - Year-over-year growth 2025-2030 (%)
Data Table on Spain - Year-over-year growth 2025-2030 (%)

12.4.6 The Netherlands - Market size and forecast 2025-2030

Chart on The Netherlands - Market size and forecast 2025-2030 ($ million)
Data Table on The Netherlands - Market size and forecast 2025-2030 ($ million)
Chart on The Netherlands - Year-over-year growth 2025-2030 (%)
Data Table on The Netherlands - Year-over-year growth 2025-2030 (%)

12.5 APAC - Market size and forecast 2025-2030

Chart on APAC - Market size and forecast 2025-2030 ($ million)
Data Table on APAC - Market size and forecast 2025-2030 ($ million)
Chart on APAC - Year-over-year growth 2025-2030 (%)
Data Table on APAC - Year-over-year growth 2025-2030 (%)
Chart on Regional Comparison - APAC
Data Table on Regional Comparison - APAC

12.5.1 China - Market size and forecast 2025-2030

Chart on China - Market size and forecast 2025-2030 ($ million)
Data Table on China - Market size and forecast 2025-2030 ($ million)
Chart on China - Year-over-year growth 2025-2030 (%)
Data Table on China - Year-over-year growth 2025-2030 (%)

12.5.2 India - Market size and forecast 2025-2030

Chart on India - Market size and forecast 2025-2030 ($ million)
Data Table on India - Market size and forecast 2025-2030 ($ million)
Chart on India - Year-over-year growth 2025-2030 (%)
Data Table on India - Year-over-year growth 2025-2030 (%)

12.5.3 Japan - Market size and forecast 2025-2030

Chart on Japan - Market size and forecast 2025-2030 ($ million)
Data Table on Japan - Market size and forecast 2025-2030 ($ million)
Chart on Japan - Year-over-year growth 2025-2030 (%)
Data Table on Japan - Year-over-year growth 2025-2030 (%)

12.5.4 South Korea - Market size and forecast 2025-2030

Chart on South Korea - Market size and forecast 2025-2030 ($ million)
Data Table on South Korea - Market size and forecast 2025-2030 ($ million)
Chart on South Korea - Year-over-year growth 2025-2030 (%)
Data Table on South Korea - Year-over-year growth 2025-2030 (%)

12.5.5 Australia - Market size and forecast 2025-2030

Chart on Australia - Market size and forecast 2025-2030 ($ million)
Data Table on Australia - Market size and forecast 2025-2030 ($ million)
Chart on Australia - Year-over-year growth 2025-2030 (%)
Data Table on Australia - Year-over-year growth 2025-2030 (%)

12.5.6 Indonesia - Market size and forecast 2025-2030

Chart on Indonesia - Market size and forecast 2025-2030 ($ million)
Data Table on Indonesia - Market size and forecast 2025-2030 ($ million)
Chart on Indonesia - Year-over-year growth 2025-2030 (%)
Data Table on Indonesia - Year-over-year growth 2025-2030 (%)

12.6 South America - Market size and forecast 2025-2030

Chart on South America - Market size and forecast 2025-2030 ($ million)
Data Table on South America - Market size and forecast 2025-2030 ($ million)
Chart on South America - Year-over-year growth 2025-2030 (%)
Data Table on South America - Year-over-year growth 2025-2030 (%)
Chart on Regional Comparison - South America
Data Table on Regional Comparison - South America

12.6.1 Brazil - Market size and forecast 2025-2030

Chart on Brazil - Market size and forecast 2025-2030 ($ million)
Data Table on Brazil - Market size and forecast 2025-2030 ($ million)
Chart on Brazil - Year-over-year growth 2025-2030 (%)
Data Table on Brazil - Year-over-year growth 2025-2030 (%)

12.6.2 Argentina - Market size and forecast 2025-2030

Chart on Argentina - Market size and forecast 2025-2030 ($ million)
Data Table on Argentina - Market size and forecast 2025-2030 ($ million)
Chart on Argentina - Year-over-year growth 2025-2030 (%)
Data Table on Argentina - Year-over-year growth 2025-2030 (%)

12.6.3 Chile - Market size and forecast 2025-2030

Chart on Chile - Market size and forecast 2025-2030 ($ million)
Data Table on Chile - Market size and forecast 2025-2030 ($ million)
Chart on Chile - Year-over-year growth 2025-2030 (%)
Data Table on Chile - Year-over-year growth 2025-2030 (%)

12.7 Middle East and Africa - Market size and forecast 2025-2030

Chart on Middle East and Africa - Market size and forecast 2025-2030 ($ million)
Data Table on Middle East and Africa - Market size and forecast 2025-2030 ($ million)
Chart on Middle East and Africa - Year-over-year growth 2025-2030 (%)
Data Table on Middle East and Africa - Year-over-year growth 2025-2030 (%)
Chart on Regional Comparison - Middle East and Africa
Data Table on Regional Comparison - Middle East and Africa

12.7.1 UAE - Market size and forecast 2025-2030

Chart on UAE - Market size and forecast 2025-2030 ($ million)
Data Table on UAE - Market size and forecast 2025-2030 ($ million)
Chart on UAE - Year-over-year growth 2025-2030 (%)
Data Table on UAE - Year-over-year growth 2025-2030 (%)

12.7.2 Saudi Arabia - Market size and forecast 2025-2030

Chart on Saudi Arabia - Market size and forecast 2025-2030 ($ million)
Data Table on Saudi Arabia - Market size and forecast 2025-2030 ($ million)
Chart on Saudi Arabia - Year-over-year growth 2025-2030 (%)
Data Table on Saudi Arabia - Year-over-year growth 2025-2030 (%)

12.7.3 South Africa - Market size and forecast 2025-2030

Chart on South Africa - Market size and forecast 2025-2030 ($ million)
Data Table on South Africa - Market size and forecast 2025-2030 ($ million)
Chart on South Africa - Year-over-year growth 2025-2030 (%)
Data Table on South Africa - Year-over-year growth 2025-2030 (%)

12.7.4 Turkey - Market size and forecast 2025-2030

Chart on Turkey - Market size and forecast 2025-2030 ($ million)
Data Table on Turkey - Market size and forecast 2025-2030 ($ million)
Chart on Turkey - Year-over-year growth 2025-2030 (%)
Data Table on Turkey - Year-over-year growth 2025-2030 (%)

12.7.5 Egypt - Market size and forecast 2025-2030

Chart on Egypt - Market size and forecast 2025-2030 ($ million)
Data Table on Egypt - Market size and forecast 2025-2030 ($ million)
Chart on Egypt - Year-over-year growth 2025-2030 (%)
Data Table on Egypt - Year-over-year growth 2025-2030 (%)

12.8 Market opportunity by geography

Market opportunity by geography ($ million)
Data Tables on Market opportunity by geography ($ million)

13. Drivers, Challenges, and Opportunity

13.1 Market drivers

Technological advancements in production and digital fabrication
Rising consumer preference for meaningful and sentimental gifting
Evolution of e-commerce interfaces and direct to consumer platforms

13.2 Market challenges

Complexities of global supply chain and logistics
Data Privacy and cybersecurity compliance risks
Sustainability pressures and operational cost volatility

13.3 Impact of drivers and challenges

Impact of drivers and challenges in 2025 and 2030

13.4 Market opportunities

AI driven hyper personalization and predictive intent
Expansion of sustainable and ethical sourcing practices
Rise of regionalized micro fulfillment models

14. Competitive Landscape

14.1 Overview

14.2

Overview on criticality of inputs and factors of differentiation

14.3 Landscape disruption

Overview on factors of disruption

14.4 Industry risks

Impact of key risks on business

15. Competitive Analysis

15.1 Companies profiled

Companies covered

15.2 Company ranking index

15.3 Market positioning of companies

Matrix on companies position and classification

15.4 American Greetings Corp.

American Greetings Corp. - Overview
American Greetings Corp. - Product / Service
American Greetings Corp. - Key offerings
SWOT

15.5 American Stationery Co. Inc.

American Stationery Co. Inc. - Overview
American Stationery Co. Inc. - Product / Service
American Stationery Co. Inc. - Key offerings
SWOT

15.6 CafePress Inc.

CafePress Inc. - Overview
CafePress Inc. - Product / Service
CafePress Inc. - Key offerings
SWOT

15.7 Cimpress Plc

Cimpress Plc - Overview
Cimpress Plc - Business segments
Cimpress Plc - Key offerings
Cimpress Plc - Segment focus
SWOT

15.8 Erffmeyer & Son Co Inc

Erffmeyer & Son Co Inc - Overview
Erffmeyer & Son Co Inc - Product / Service
Erffmeyer & Son Co Inc - Key offerings
SWOT

15.9 Fat Brain Toys LLC

Fat Brain Toys LLC - Overview
Fat Brain Toys LLC - Product / Service
Fat Brain Toys LLC - Key offerings
SWOT

15.10 Ferns N Petals Pvt. Ltd.

Ferns N Petals Pvt. Ltd. - Overview
Ferns N Petals Pvt. Ltd. - Product / Service
Ferns N Petals Pvt. Ltd. - Key offerings
SWOT

15.11 Giftographics LLC

Giftographics LLC - Overview
Giftographics LLC - Product / Service
Giftographics LLC - Key offerings
SWOT

15.12 Godiva Chocolatier Inc.

Godiva Chocolatier Inc. - Overview
Godiva Chocolatier Inc. - Product / Service
Godiva Chocolatier Inc. - Key offerings
SWOT

15.13 Hallmark Cards Inc.

Hallmark Cards Inc. - Overview
Hallmark Cards Inc. - Product / Service
Hallmark Cards Inc. - Key offerings
SWOT

15.14 Personal Creations

Personal Creations - Overview
Personal Creations - Product / Service
Personal Creations - Key offerings
SWOT

15.15 Pinnacle Promotions Inc.

Pinnacle Promotions Inc. - Overview
Pinnacle Promotions Inc. - Product / Service
Pinnacle Promotions Inc. - Key offerings
SWOT

15.16 Redbubble Ltd.

Redbubble Ltd. - Overview
Redbubble Ltd. - Product / Service
Redbubble Ltd. - Key offerings
SWOT

15.17 Shutterfly Inc.

Shutterfly Inc. - Overview
Shutterfly Inc. - Product / Service
Shutterfly Inc. - Key offerings
SWOT

15.18 The Walt Disney Co.

The Walt Disney Co. - Overview
The Walt Disney Co. - Business segments
The Walt Disney Co. - Key offerings
The Walt Disney Co. - Segment focus
SWOT

16. Appendix

16.1 Scope of the report

Market definition
Objectives
Notes and caveats

16.2 Inclusions and exclusions checklist

Inclusions checklist
Exclusions checklist

16.3 Currency conversion rates for US$

16.4 Research methodology

16.5 Data procurement

Information sources

16.6 Data validation

16.7 Validation techniques employed for market sizing

16.8 Data synthesis

16.9 360 degree market analysis

16.10 List of abbreviations

Research Methodology

Technavio presents a detailed picture of the market by way of study, synthesis, and summation of data from multiple sources. The analysts have presented the various facets of the market with a particular focus on identifying the key industry influencers. The data thus presented is comprehensive, reliable, and the result of extensive research, both primary and secondary.

INFORMATION SOURCES

Primary sources

  • Manufacturers and suppliers
  • Channel partners
  • Industry experts
  • Strategic decision makers

Secondary sources

  • Industry journals and periodicals
  • Government data
  • Financial reports of key industry players
  • Historical data
  • Press releases

DATA ANALYSIS

Data Synthesis

  • Collation of data
  • Estimation of key figures
  • Analysis of derived insights

Data Validation

  • Triangulation with data models
  • Reference against proprietary databases
  • Corroboration with industry experts

REPORT WRITING

Qualitative

  • Market drivers
  • Market challenges
  • Market trends
  • Five forces analysis

Quantitative

  • Market size and forecast
  • Market segmentation
  • Geographical insights
  • Competitive landscape

Interested in this report?

Get your sample now to see our research methodology and insights!

Download Now

Frequently Asked Questions

Personalized Gifts market growth will increase by USD 13613.1 million during 2026-2030.

The Personalized Gifts market is expected to grow at a CAGR of 6.8% during 2026-2030.

Personalized Gifts market is segmented by Product (Non-photo personalized gifts, Photo personalized gifts) Distribution channel (Online, Offline) End-user (Women, Men, Kids)

American Greetings Corp., American Stationery Co. Inc., CafePress Inc., Card Factory plc, Chococraft India Pvt. Ltd., Cimpress Plc, Erffmeyer & Son Co Inc, Fat Brain Toys LLC, Ferns N Petals Pvt. Ltd., Funkypigeon, Giftiliya India Pvt. Ltd., Giftographics LLC, Godiva Chocolatier Inc., Hallmark Cards Inc., Personal Creations, Pinnacle Promotions Inc., Redbubble Ltd., Shutterfly Inc., Spencer and Co., The Walt Disney Co. are a few of the key vendors in the Personalized Gifts market.

North America will register the highest growth rate of 30.2% among the other regions. Therefore, the Personalized Gifts market in North America is expected to garner significant business opportunities for the vendors during the forecast period.

US, Canada, Mexico, Germany, France, UK, Italy, Spain, The Netherlands, China, India, Japan, South Korea, Australia, Indonesia, Brazil, Argentina, Chile, UAE, Saudi Arabia, South Africa, Turkey, Egypt

  • Technological advancements in production and digital fabrication is the driving factor this market.

The Personalized Gifts market vendors should focus on grabbing business opportunities from the Product segment as it accounted for the largest market share in the base year.
RIA - Research AI Assistant
Ask RIA