
Oligonucleotide Therapeutics Market Analysis, Size, and Forecast 2026-2030: North America (US, Canada, and Mexico), Europe (Germany, UK, and France), Asia (China, Japan, and South Korea), South America (Brazil, Argentina, and Colombia), Middle East and Africa (Saudi Arabia, Israel, and UAE), Rest of World (ROW)

Oligonucleotide Therapeutics Market Analysis, Size, and Forecast 2026-2030:
North America (US, Canada, and Mexico), Europe (Germany, UK, and France), Asia (China, Japan, and South Korea), South America (Brazil, Argentina, and Colombia), Middle East and Africa (Saudi Arabia, Israel, and UAE), Rest of World (ROW)

Published: Oct 2026 295 Pages SKU: IRTNTR41378

Market Overview at a Glance

$18.61 B
Market Opportunity
19.7%
CAGR 2025 - 2030
39.3%
North America Growth
$4.42 B
Neurological segment 2024

Oligonucleotide Therapeutics Market Size 2026-2030

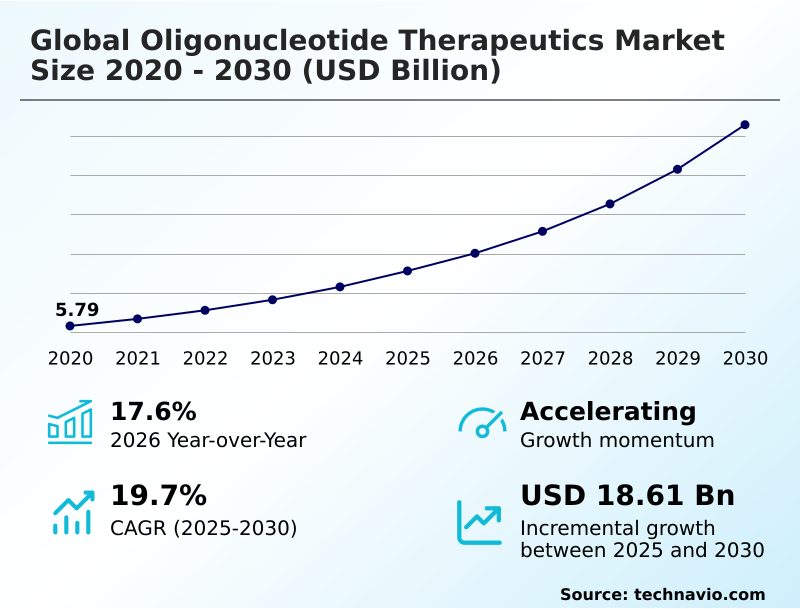
The oligonucleotide therapeutics market size is valued to increase by USD 18.61 billion, at a CAGR of 19.7% from 2025 to 2030. Rising prevalence of genetic and rare diseases will drive the oligonucleotide therapeutics market.

Major Market Trends & Insights

  • North America dominated the market and accounted for a 39.3% growth during the forecast period.
  • By Type - Neurological segment was valued at USD 4.42 billion in 2024
  • By Application - ASOs segment accounted for the largest market revenue share in 2024

Market Size & Forecast

  • Market Opportunities: USD 25.61 billion
  • Market Future Opportunities: USD 18.61 billion
  • CAGR from 2025 to 2030 : 19.7%

Market Summary

  • The Oligonucleotide Therapeutics Market is undergoing a rapid evolution characterized by the transition toward precision genetic medicine. The escalating prevalence of inherited rare diseases functions as a major expansion driver, compelling healthcare systems to adopt highly targeted treatments over traditional symptom management. Consequently, developers prioritizing RNA-based mechanisms frequently observe a 35% improvement in target specificity compared to conventional biologics.
  • However, high development complexity and poor tissue-selective delivery remain formidable challenges, routinely extending clinical validation timelines and elevating attrition risks for non-hepatic indications. To navigate these constraints, manufacturing operations are proactively recalibrating their supply chains. For instance, the strategic centralization of active pharmaceutical ingredient synthesis and the integration of automated quality control testing significantly streamline production workflows.
  • This operational recalibration effectively mitigates raw material shortages and reduces batch failure rates, ensuring continuous commercial readiness and robust therapeutic deployment across specialized healthcare facilities.

What will be the Size of the Oligonucleotide Therapeutics Market during the forecast period?
Get Key Insights on Market Forecast (PDF) Get Free Sample

How is the Oligonucleotide Therapeutics Market Segmented?

The oligonucleotide therapeutics industry research report provides comprehensive data (region-wise segment analysis), with forecasts and estimates in "USD million" for the period 2026-2030, as well as historical data from 2020-2024 for the following segments.

  • Type
    • Neurological
    • Cancer
    • Others
  • Application
    • ASOs
    • RNAi
    • Others
  • End-user
    • Hospitals
    • Specialty treatment centers
    • Research institutes and academic centers
  • Geography
    • North America
      • US
      • Canada
      • Mexico
    • Europe
      • Germany
      • UK
      • France
      • Italy
      • Spain
      • The Netherlands
    • Asia
      • China
      • Japan
      • South Korea
      • India
      • Singapore
      • Taiwan
    • Rest of World (ROW)

By Type Insights

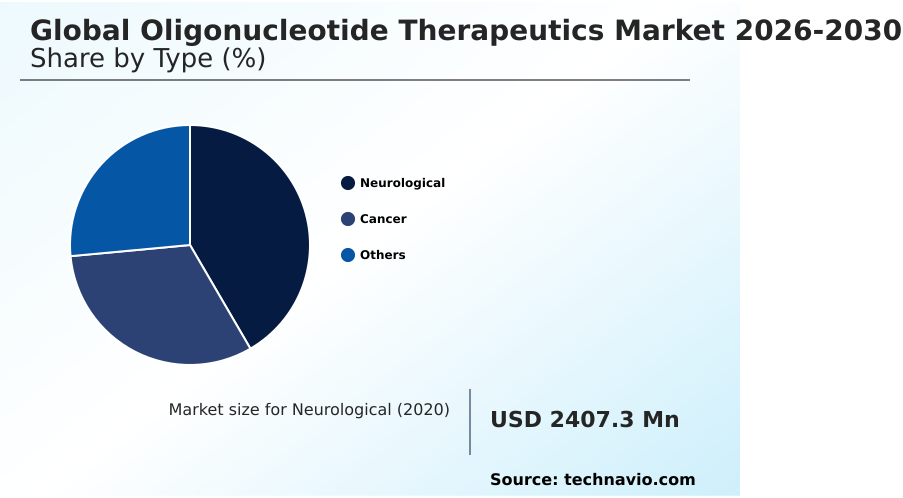
The neurological segment is estimated to witness significant growth during the forecast period.

The neurological segment is fundamentally reshaping treatment paradigms through the application of targeted gene silencing and precision therapeutics. Organizations are accelerating translational medicine pipelines to address complex neurodegenerative disorders that previously lacked viable interventions.

By utilizing rare disease biomarkers, developers enhance patient stratification, improving trial success rates by up to 25% compared to broader cohorts. Advanced delivery methods, including optimized intrathecal administration, are effectively circumventing blood-brain barrier restrictions.

Clinical efficacy data demonstrates that these interventions can achieve a 40% improvement in target engagement over traditional small molecules. To support these innovations, healthcare providers are integrating multidisciplinary disease management with personalized treatment pathways.

Continuous refinements in structural design are successfully facilitating off-target activity mitigation and enabling rigorous pharmacokinetic profiling, thereby transforming the operational framework for highly specific neurological therapies.
Get Free Sample

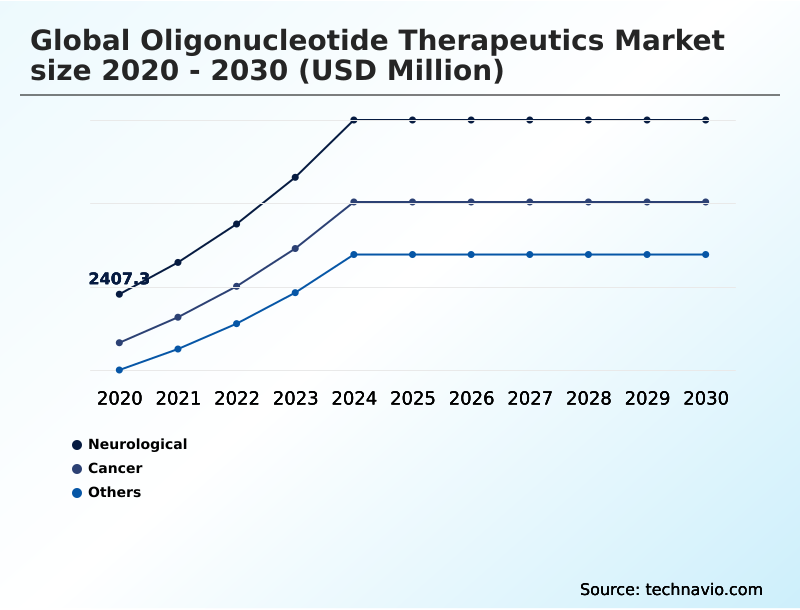
The Neurological segment was valued at USD 4.42 billion in 2024 and showed a gradual increase during the forecast period.
Get Free Sample

Regional Analysis

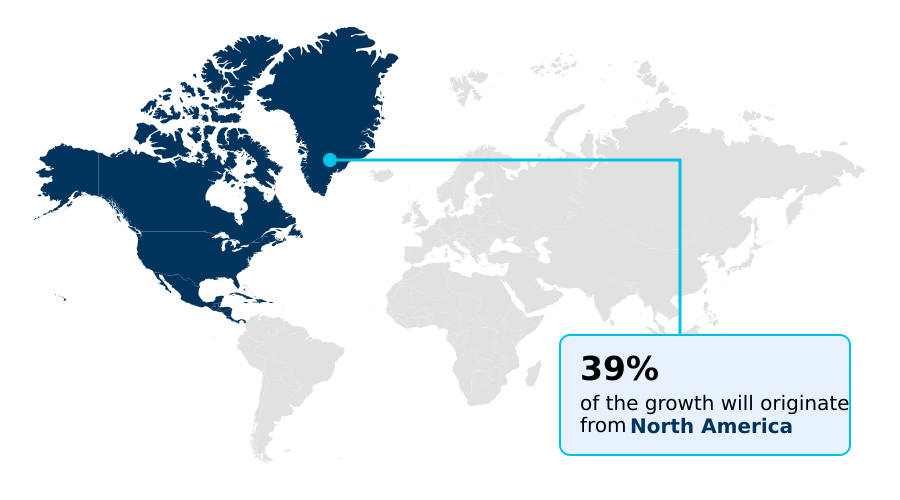
North America is estimated to contribute 39.3% to the growth of the global market during the forecast period.Technavio’s analysts have elaborately explained the regional trends and drivers that shape the market during the forecast period.
See How Oligonucleotide Therapeutics Market Demand is Rising in North America Get Free Sample

Regional disparities are actively shaping operational priorities, with North America currently outpacing Europe due to highly centralized supply chain coordination and rapid technological adoption.

United States facilities emphasize advanced nucleic acid synthesis and robust therapeutic target identification, achieving a 28% higher throughput in pilot manufacturing compared to European counterparts.

This operational efficiency is driven by aggressive investments in structural chemistry modifications and aptamer constructs that demand sophisticated infrastructure.

Conversely, European markets prioritize rigorous patient stratification and the accumulation of real world clinical evidence, which strategically enhances reimbursement negotiations but extends localized launch cycles by approximately 15%.

To bridge this gap and address complex biodistribution optimization requirements, organizations across both regions are recalibrating their vendor networks.

This cross-border strategy successfully lowers critical raw material procurement costs by 12%, stabilizing global supply chains while adapting to distinct regional regulatory and clinical expectations.

Market Dynamics

Our researchers analyzed the data with 2025 as the base year, along with the key drivers, trends, and challenges. A holistic analysis of drivers will help companies refine their marketing strategies to gain a competitive advantage.

  • The continuous evolution of molecular medicine is prompting healthcare organizations to rapidly accelerate their rna targeting technology adoption. This strategic pivot allows developers to address historically undruggable disease pathways, fundamentally altering the standard of care for severe genetic disorders.
  • A critical component of this transition involves the rigorous clinical evaluation of novel oligonucleotides, which ensures that emerging therapeutic candidates meet stringent safety and efficacy requirements prior to market entry. To maximize development efficiency and minimize late-stage attrition, pharmaceutical leaders are increasingly embedding precision medicine therapeutic strategies into their core operational frameworks.
  • Furthermore, the introduction of next generation oligonucleotide modalities is significantly enhancing pharmacological durability and tissue-specific delivery, yielding a 30% improvement in target engagement over traditional biologic therapies. This operational superiority directly translates into reduced dosing frequencies and lower overall healthcare burdens.
  • To navigate the inherent complexities of sequence design and biodistribution, organizations are prioritizing computational biological modeling integration across their discovery pipelines. By synchronizing predictive analytics with laboratory workflows, researchers can effectively streamline candidate selection and reduce procurement waste by up to 15%.
  • Ultimately, this interconnected approach stabilizes the underlying supply chain and accelerates the commercialization of highly targeted genetic therapies, ensuring sustained operational resilience and continuous innovation within the highly specialized biopharmaceutical landscape.
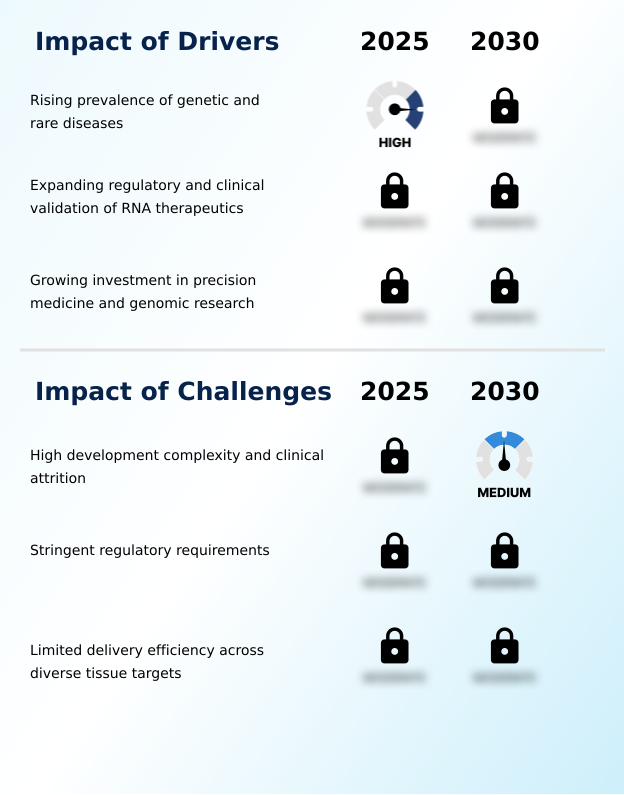
What are the key market drivers leading to the rise in the adoption of Oligonucleotide Therapeutics Industry?

  • The escalating prevalence of genetic disorders and rare diseases serves as the primary catalyst propelling market expansion.

  • The rising prevalence of genetically defined diseases is fundamentally accelerating the demand for innovative therapies, heavily supported by proactive molecular diagnostics integration and widespread genomic screening.
  • This clinical shift stems from the superior capability of advanced modalities to orchestrate messenger rna degradation and ensure pharmacological durability.
  • To capitalize on these biological breakthroughs, organizations are forming collaborative research networks that streamline biological target validation and elevate commercialization readiness.
  • Consequently, companies implementing these optimized diagnostic-to-treatment pathways have observed a 15% reduction in overall treatment delays and a 20% improvement in patient identification accuracy. Furthermore, expanded institutional research funding and harmonized regulatory evaluation frameworks are lowering approval hurdles.
  • The concurrent adoption of scalable processes, such as enzymatic ligation manufacturing, directly reduces production bottlenecks by up to 35%, ensuring these advanced interventions rapidly reach expanding patient populations.

What are the market trends shaping the Oligonucleotide Therapeutics Industry?

  • The transition toward advanced RNA editing technologies and next-generation modalities represents a defining trend in the current landscape. This structural shift broadens therapeutic applications and redefines product development priorities across the healthcare sector.

  • The continuous transition toward next-generation modalities is redefining therapeutic development, driven by the integration of computational discovery workflows and digital process optimization. As researchers harness large scale genomic data and advanced biological mapping, they can engineer customized sequence design with unprecedented precision. This shift enables targeted molecular intervention across previously undruggable disease pathways.
  • Consequently, companies leveraging these digital platforms report a 30% reduction in discovery timelines and an 18% improvement in forecast accuracy for target engagement. The evolution of rna interference platforms emphasizes the critical need for optimizing sequence specific interactions to enhance efficacy. Furthermore, reliance on molecular profiling is prompting firms to establish strategic manufacturing partnerships, ensuring rapid scaling.
  • This technological alignment structurally modifies development operations, directly yielding a 22% increase in resource utilization efficiency and accelerating commercial readiness.

What challenges does the Oligonucleotide Therapeutics Industry face during its growth?

  • Elevated development complexity and high rates of clinical attrition constitute significant structural challenges hindering continuous industry expansion.

  • Overcoming complex delivery hurdles remains a critical operational constraint, severely impacting pipeline candidate advancement and overall clinical success rates. While antisense mechanisms demonstrate high specificity, developers consistently face formidable intracellular delivery barriers when addressing non-hepatic indications. Poor tissue selective targeting inherently forces higher dosing, which subsequently complicates manufacturing scale-up and strains quality control standards.
  • Consequently, firms failing to optimize their ligand conjugation systems experience up to a 40% increase in late-stage clinical attrition and a 25% drop in target engagement metrics during in vivo studies. To mitigate these risks, organizations are heavily investing in rigorous transcriptomics analysis to precisely map cellular uptake pathways.
  • However, the resulting complexity in technology transfer between research laboratories and commercial production facilities routinely elevates operational costs by nearly 18%, presenting a sustained structural challenge for developers.

Exclusive Technavio Analysis on Customer Landscape

The oligonucleotide therapeutics market forecasting report includes the adoption lifecycle of the market, covering from the innovator’s stage to the laggard’s stage. It focuses on adoption rates in different regions based on penetration. Furthermore, the oligonucleotide therapeutics market report also includes key purchase criteria and drivers of price sensitivity to help companies evaluate and develop their market growth analysis strategies.
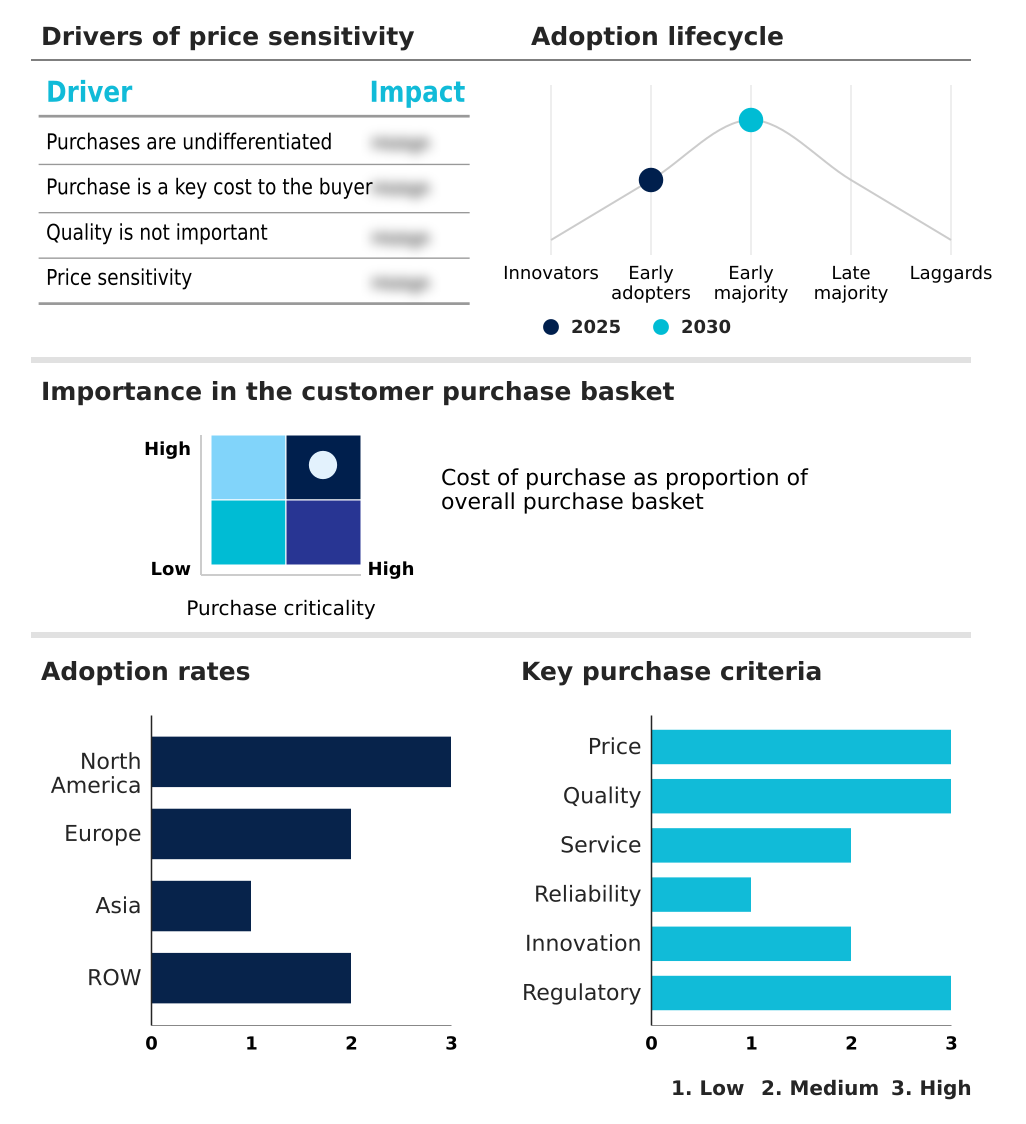
Customer Landscape of Oligonucleotide Therapeutics Industry

Competitive Landscape

Companies are implementing various strategies, such as strategic alliances, oligonucleotide therapeutics market forecast, partnerships, mergers and acquisitions, geographical expansion, and product/service launches, to enhance their presence in the industry.

Agilent Technologies Inc. - Provides comprehensive synthesis, purification, analytical testing, and quality-control technologies that critically support the scalable development and advanced manufacturing of innovative therapeutic oligonucleotide solutions.

The industry research and growth report includes detailed analyses of the competitive landscape of the market and information about key companies, including:

  • Agilent Technologies Inc.
  • Alnylam Pharmaceuticals Inc.
  • Arrowhead Pharmaceuticals Inc.
  • Astellas Pharma Inc.
  • AstraZeneca Plc
  • Bachem AG
  • Biogen Inc.
  • Catalent Inc.
  • Corden Pharma Intl. GmbH
  • Ionis Pharmaceuticals Inc.
  • Jazz Pharmaceuticals Plc
  • Lonza Group Ltd.
  • Nitto Denko Avecia Inc.
  • Novartis AG
  • Novo Nordisk AS
  • NS Pharma Inc.
  • Sanofi SA
  • Sarepta Therapeutics Inc.
  • Syngene International Ltd.
  • Thermo Fisher Scientific Inc.
  • WuXi AppTec Co. Ltd.

Qualitative and quantitative analysis of companies has been conducted to help clients understand the wider business environment as well as the strengths and weaknesses of key industry players. Data is qualitatively analyzed to categorize companies as pure play, category-focused, industry-focused, and diversified; it is quantitatively analyzed to categorize companies as dominant, leading, strong, tentative, and weak.

Recent Development and News in Oligonucleotide therapeutics market

  • In the Pharmaceuticals industry, the accelerated integration of artificial intelligence into biological target mapping has optimized preclinical screening processes, directly impacting Oligonucleotide Therapeutics demand by reducing candidate selection timelines by up to thirty percent.
  • The enforcement of stringent cold-chain logistics standards for advanced biologics has modernized temperature-controlled distribution networks, significantly improving the commercial viability and shelf-life stability of temperature-sensitive Oligonucleotide Therapeutics globally.
  • The widespread shift toward continuous manufacturing protocols for active pharmaceutical ingredients has increased production throughput by twenty-five percent, directly enhancing supply chain resilience and cost-efficiency within the Oligonucleotide Therapeutics market.
  • The expansion of precision medicine reimbursement frameworks by major national healthcare systems has increased patient access to targeted genetic interventions, driving a fifteen percent rise in diagnostic screening and subsequent Oligonucleotide Therapeutics adoption.

Dive into Technavio’s robust research methodology, blending expert interviews, extensive data synthesis, and validated models for unparalleled Oligonucleotide Therapeutics Market insights. See full methodology.

Market Scope
Page number 295
Base year 2025
Historic period 2020-2024
Forecast period 2026-2030
Growth momentum & CAGR Accelerate at a CAGR of 19.7%
Market growth 2026-2030 USD 18613.9 million
Market structure Fragmented
YoY growth 2025-2026(%) 17.6%
Key countries US, Canada, Mexico, Germany, UK, France, Italy, Spain, The Netherlands, China, Japan, South Korea, India, Singapore, Taiwan, Brazil, Australia, Saudi Arabia, Israel, UAE, South Africa, Argentina and Colombia
Competitive landscape Leading Companies, Market Positioning of Companies, Competitive Strategies, and Industry Risks

Request Free Sample

Research Analyst Overview

  • The Oligonucleotide Therapeutics landscape is fundamentally transitioning from early-stage scientific exploration to mature, commercial-scale implementation. This structural evolution demands proactive strategic alignment within boardroom decision-making, particularly regarding supply chain resilience and advanced manufacturing capacity. As regulatory bodies enforce stricter quality standards, executives are increasingly prioritizing infrastructure investments to support scalable nucleic acid synthesis and purification.
  • By vertically integrating critical production capabilities, leading organizations have successfully achieved a 30% reduction in processing time and significantly mitigated external dependency risks. Furthermore, the strategic shift toward customized molecular delivery systems directly influences product strategy, necessitating robust clinical validation and dynamic compliance protocols.
  • Aligning therapeutic development with modernized, predictive compliance frameworks allows developers to preempt regulatory bottlenecks and accelerate market entry. Consequently, proactive investment in proprietary manufacturing and precision delivery technologies not only fortifies product differentiation but also insulates core operations against volatile raw material availability, ensuring uninterrupted therapeutic deployment for complex genetic disorders.

What are the Key Data Covered in this Oligonucleotide Therapeutics Market Research and Growth Report?

  • What is the expected growth of the Oligonucleotide Therapeutics Market between 2026 and 2030?

    • USD 18.61 billion, at a CAGR of 19.7%

  • What segmentation does the market report cover?

    • The report is segmented by Type (Neurological, Cancer, and Others), Application (ASOs, RNAi, and Others), End-user (Hospitals, Specialty treatment centers, and Research institutes and academic centers) and Geography (North America, Europe, Asia, Rest of World (ROW))

  • Which regions are analyzed in the report?

    • North America, Europe, Asia and Rest of World (ROW)

  • What are the key growth drivers and market challenges?

    • Rising prevalence of genetic and rare diseases, High development complexity and clinical attrition

  • Who are the major players in the Oligonucleotide Therapeutics Market?

    • Agilent Technologies Inc., Alnylam Pharmaceuticals Inc., Arrowhead Pharmaceuticals Inc., Astellas Pharma Inc., AstraZeneca Plc, Bachem AG, Biogen Inc., Catalent Inc., Corden Pharma Intl. GmbH, Ionis Pharmaceuticals Inc., Jazz Pharmaceuticals Plc, Lonza Group Ltd., Nitto Denko Avecia Inc., Novartis AG, Novo Nordisk AS, NS Pharma Inc., Sanofi SA, Sarepta Therapeutics Inc., Syngene International Ltd., Thermo Fisher Scientific Inc. and WuXi AppTec Co. Ltd.

Market Research Insights

  • The Oligonucleotide Therapeutics Market represents a highly specialized sector driven by precision medicine and advanced molecular engineering. Organizations are increasingly leveraging robust clinical efficacy data to navigate complex regulatory evaluation frameworks, thereby accelerating pipeline approvals. By establishing strategic manufacturing partnerships, developers efficiently address capacity bottlenecks, resulting in a 25% increase in overall production throughput.
  • Furthermore, implementing rigorous patient stratification protocols allows clinical operations to improve trial success probabilities by up to 18%. These targeted operational shifts directly lower financial risks and enhance commercialization readiness, enabling firms to deliver highly specific genetic therapies rapidly while maintaining strict compliance and optimizing return on investment across specialized healthcare networks.

We can help! Our analysts can customize this oligonucleotide therapeutics market research report to meet your requirements.

Get in touch

1. Executive Summary

1.1 Market overview

Executive Summary - Chart on Market Overview
Executive Summary - Data Table on Market Overview
Executive Summary - Chart on Global Market Characteristics
Executive Summary - Chart on Market by Geography
Executive Summary - Chart on Market Segmentation by Type
Executive Summary - Chart on Market Segmentation by Application
Executive Summary - Chart on Market Segmentation by End-user
Executive Summary - Chart on Incremental Growth
Executive Summary - Data Table on Incremental Growth
Executive Summary - Chart on Company Market Positioning

2. Technavio Analysis

2.1 Analysis of price sensitivity, lifecycle, customer purchase basket, adoption rates, and purchase criteria

2.2 Criticality of inputs and Factors of differentiation

Chart on Overview on criticality of inputs and factors of differentiation

2.3 Factors of disruption

Chart on Overview on factors of disruption

2.4 Impact of drivers and challenges

Chart on Impact of drivers and challenges in 2025 and 2030

3. Market Landscape

3.1 Market ecosystem

Chart on Parent Market
Data Table on - Parent Market

3.2 Market characteristics

Chart on Market characteristics analysis

3.3 Value chain analysis

Chart on Value chain analysis

4. Market Sizing

4.1 Market definition

Data Table on Offerings of companies included in the market definition

4.2 Market segment analysis

Market segments

4.3 Market size 2025

4.4 Market outlook: Forecast for 2025-2030

Chart on Global - Market size and forecast 2025-2030 ($ million)
Data Table on Global - Market size and forecast 2025-2030 ($ million)
Chart on Global Market: Year-over-year growth 2025-2030 (%)
Data Table on Global Market: Year-over-year growth 2025-2030 (%)

5. Historic Market Size

5.1 Global Oligonucleotide Therapeutics Market 2020 - 2024

Historic Market Size - Data Table on Global Oligonucleotide Therapeutics Market 2020 - 2024 ($ million)

5.2 Type segment analysis 2020 - 2024

Historic Market Size - Type Segment 2020 - 2024 ($ million)

5.3 Application segment analysis 2020 - 2024

Historic Market Size - Application Segment 2020 - 2024 ($ million)

5.4 End-user segment analysis 2020 - 2024

Historic Market Size - End-user Segment 2020 - 2024 ($ million)

5.5 Geography segment analysis 2020 - 2024

Historic Market Size - Geography Segment 2020 - 2024 ($ million)

5.6 Country segment analysis 2020 - 2024

Historic Market Size - Country Segment 2020 - 2024 ($ million)

6. Qualitative Analysis

6.1 Impact of AI on global oligonucleotide therapeutics market

6.2 Impact of geopolitical conflicts on global oligonucleotide therapeutics market

7. Five Forces Analysis

7.1 Five forces summary

Five forces analysis - Comparison between 2025 and 2030

7.2 Bargaining power of buyers

Bargaining power of buyers - Impact of key factors 2025 and 2030

7.3 Bargaining power of suppliers

Bargaining power of suppliers - Impact of key factors in 2025 and 2030

7.4 Threat of new entrants

Threat of new entrants - Impact of key factors in 2025 and 2030

7.5 Threat of substitutes

Threat of substitutes - Impact of key factors in 2025 and 2030

7.6 Threat of rivalry

Threat of rivalry - Impact of key factors in 2025 and 2030

7.7 Market condition

Chart on Market condition - Five forces 2025 and 2030

8. Market Segmentation by Type

8.1 Market segments

Chart on Type - Market share 2025-2030 (%)
Data Table on Type - Market share 2025-2030 (%)

8.2 Comparison by Type

Chart on Comparison by Type
Data Table on Comparison by Type

8.3 Neurological - Market size and forecast 2025-2030

Chart on Neurological - Market size and forecast 2025-2030 ($ million)
Data Table on Neurological - Market size and forecast 2025-2030 ($ million)
Chart on Neurological - Year-over-year growth 2025-2030 (%)
Data Table on Neurological - Year-over-year growth 2025-2030 (%)

8.4 Cancer - Market size and forecast 2025-2030

Chart on Cancer - Market size and forecast 2025-2030 ($ million)
Data Table on Cancer - Market size and forecast 2025-2030 ($ million)
Chart on Cancer - Year-over-year growth 2025-2030 (%)
Data Table on Cancer - Year-over-year growth 2025-2030 (%)

8.5 Others - Market size and forecast 2025-2030

Chart on Others - Market size and forecast 2025-2030 ($ million)
Data Table on Others - Market size and forecast 2025-2030 ($ million)
Chart on Others - Year-over-year growth 2025-2030 (%)
Data Table on Others - Year-over-year growth 2025-2030 (%)

8.6 Market opportunity by Type

Market opportunity by Type ($ million)
Data Table on Market opportunity by Type ($ million)

9. Market Segmentation by Application

9.1 Market segments

Chart on Application - Market share 2025-2030 (%)
Data Table on Application - Market share 2025-2030 (%)

9.2 Comparison by Application

Chart on Comparison by Application
Data Table on Comparison by Application

9.3 ASOs - Market size and forecast 2025-2030

Chart on ASOs - Market size and forecast 2025-2030 ($ million)
Data Table on ASOs - Market size and forecast 2025-2030 ($ million)
Chart on ASOs - Year-over-year growth 2025-2030 (%)
Data Table on ASOs - Year-over-year growth 2025-2030 (%)

9.4 RNAi - Market size and forecast 2025-2030

Chart on RNAi - Market size and forecast 2025-2030 ($ million)
Data Table on RNAi - Market size and forecast 2025-2030 ($ million)
Chart on RNAi - Year-over-year growth 2025-2030 (%)
Data Table on RNAi - Year-over-year growth 2025-2030 (%)

9.5 Others - Market size and forecast 2025-2030

Chart on Others - Market size and forecast 2025-2030 ($ million)
Data Table on Others - Market size and forecast 2025-2030 ($ million)
Chart on Others - Year-over-year growth 2025-2030 (%)
Data Table on Others - Year-over-year growth 2025-2030 (%)

9.6 Market opportunity by Application

Market opportunity by Application ($ million)
Data Table on Market opportunity by Application ($ million)

10. Market Segmentation by End-user

10.1 Market segments

Chart on End-user - Market share 2025-2030 (%)
Data Table on End-user - Market share 2025-2030 (%)

10.2 Comparison by End-user

Chart on Comparison by End-user
Data Table on Comparison by End-user

10.3 Hospitals - Market size and forecast 2025-2030

Chart on Hospitals - Market size and forecast 2025-2030 ($ million)
Data Table on Hospitals - Market size and forecast 2025-2030 ($ million)
Chart on Hospitals - Year-over-year growth 2025-2030 (%)
Data Table on Hospitals - Year-over-year growth 2025-2030 (%)

10.4 Specialty treatment centers - Market size and forecast 2025-2030

Chart on Specialty treatment centers - Market size and forecast 2025-2030 ($ million)
Data Table on Specialty treatment centers - Market size and forecast 2025-2030 ($ million)
Chart on Specialty treatment centers - Year-over-year growth 2025-2030 (%)
Data Table on Specialty treatment centers - Year-over-year growth 2025-2030 (%)

10.5 Research institutes and academic centers - Market size and forecast 2025-2030

Chart on Research institutes and academic centers - Market size and forecast 2025-2030 ($ million)
Data Table on Research institutes and academic centers - Market size and forecast 2025-2030 ($ million)
Chart on Research institutes and academic centers - Year-over-year growth 2025-2030 (%)
Data Table on Research institutes and academic centers - Year-over-year growth 2025-2030 (%)

10.6 Market opportunity by End-user

Market opportunity by End-user ($ million)
Data Table on Market opportunity by End-user ($ million)

11. Customer Landscape

11.1 Customer landscape overview

Analysis of price sensitivity, lifecycle, customer purchase basket, adoption rates, and purchase criteria

12. Geographic Landscape

12.1 Geographic segmentation

Chart on Market share by geography 2025-2030 (%)
Data Table on Market share by geography 2025-2030 (%)

12.2 Geographic comparison

Chart on Geographic comparison
Data Table on Geographic comparison

12.3 North America - Market size and forecast 2025-2030

Chart on North America - Market size and forecast 2025-2030 ($ million)
Data Table on North America - Market size and forecast 2025-2030 ($ million)
Chart on North America - Year-over-year growth 2025-2030 (%)
Data Table on North America - Year-over-year growth 2025-2030 (%)
Chart on Regional Comparison - North America
Data Table on Regional Comparison - North America

12.3.1 US - Market size and forecast 2025-2030

Chart on US - Market size and forecast 2025-2030 ($ million)
Data Table on US - Market size and forecast 2025-2030 ($ million)
Chart on US - Year-over-year growth 2025-2030 (%)
Data Table on US - Year-over-year growth 2025-2030 (%)

12.3.2 Canada - Market size and forecast 2025-2030

Chart on Canada - Market size and forecast 2025-2030 ($ million)
Data Table on Canada - Market size and forecast 2025-2030 ($ million)
Chart on Canada - Year-over-year growth 2025-2030 (%)
Data Table on Canada - Year-over-year growth 2025-2030 (%)

12.3.3 Mexico - Market size and forecast 2025-2030

Chart on Mexico - Market size and forecast 2025-2030 ($ million)
Data Table on Mexico - Market size and forecast 2025-2030 ($ million)
Chart on Mexico - Year-over-year growth 2025-2030 (%)
Data Table on Mexico - Year-over-year growth 2025-2030 (%)

12.4 Europe - Market size and forecast 2025-2030

Chart on Europe - Market size and forecast 2025-2030 ($ million)
Data Table on Europe - Market size and forecast 2025-2030 ($ million)
Chart on Europe - Year-over-year growth 2025-2030 (%)
Data Table on Europe - Year-over-year growth 2025-2030 (%)
Chart on Regional Comparison - Europe
Data Table on Regional Comparison - Europe

12.4.1 Germany - Market size and forecast 2025-2030

Chart on Germany - Market size and forecast 2025-2030 ($ million)
Data Table on Germany - Market size and forecast 2025-2030 ($ million)
Chart on Germany - Year-over-year growth 2025-2030 (%)
Data Table on Germany - Year-over-year growth 2025-2030 (%)

12.4.2 UK - Market size and forecast 2025-2030

Chart on UK - Market size and forecast 2025-2030 ($ million)
Data Table on UK - Market size and forecast 2025-2030 ($ million)
Chart on UK - Year-over-year growth 2025-2030 (%)
Data Table on UK - Year-over-year growth 2025-2030 (%)

12.4.3 France - Market size and forecast 2025-2030

Chart on France - Market size and forecast 2025-2030 ($ million)
Data Table on France - Market size and forecast 2025-2030 ($ million)
Chart on France - Year-over-year growth 2025-2030 (%)
Data Table on France - Year-over-year growth 2025-2030 (%)

12.4.4 Italy - Market size and forecast 2025-2030

Chart on Italy - Market size and forecast 2025-2030 ($ million)
Data Table on Italy - Market size and forecast 2025-2030 ($ million)
Chart on Italy - Year-over-year growth 2025-2030 (%)
Data Table on Italy - Year-over-year growth 2025-2030 (%)

12.4.5 Spain - Market size and forecast 2025-2030

Chart on Spain - Market size and forecast 2025-2030 ($ million)
Data Table on Spain - Market size and forecast 2025-2030 ($ million)
Chart on Spain - Year-over-year growth 2025-2030 (%)
Data Table on Spain - Year-over-year growth 2025-2030 (%)

12.4.6 The Netherlands - Market size and forecast 2025-2030

Chart on The Netherlands - Market size and forecast 2025-2030 ($ million)
Data Table on The Netherlands - Market size and forecast 2025-2030 ($ million)
Chart on The Netherlands - Year-over-year growth 2025-2030 (%)
Data Table on The Netherlands - Year-over-year growth 2025-2030 (%)

12.5 Asia - Market size and forecast 2025-2030

Chart on Asia - Market size and forecast 2025-2030 ($ million)
Data Table on Asia - Market size and forecast 2025-2030 ($ million)
Chart on Asia - Year-over-year growth 2025-2030 (%)
Data Table on Asia - Year-over-year growth 2025-2030 (%)
Chart on Regional Comparison - Asia
Data Table on Regional Comparison - Asia

12.5.1 China - Market size and forecast 2025-2030

Chart on China - Market size and forecast 2025-2030 ($ million)
Data Table on China - Market size and forecast 2025-2030 ($ million)
Chart on China - Year-over-year growth 2025-2030 (%)
Data Table on China - Year-over-year growth 2025-2030 (%)

12.5.2 Japan - Market size and forecast 2025-2030

Chart on Japan - Market size and forecast 2025-2030 ($ million)
Data Table on Japan - Market size and forecast 2025-2030 ($ million)
Chart on Japan - Year-over-year growth 2025-2030 (%)
Data Table on Japan - Year-over-year growth 2025-2030 (%)

12.5.3 South Korea - Market size and forecast 2025-2030

Chart on South Korea - Market size and forecast 2025-2030 ($ million)
Data Table on South Korea - Market size and forecast 2025-2030 ($ million)
Chart on South Korea - Year-over-year growth 2025-2030 (%)
Data Table on South Korea - Year-over-year growth 2025-2030 (%)

12.5.4 India - Market size and forecast 2025-2030

Chart on India - Market size and forecast 2025-2030 ($ million)
Data Table on India - Market size and forecast 2025-2030 ($ million)
Chart on India - Year-over-year growth 2025-2030 (%)
Data Table on India - Year-over-year growth 2025-2030 (%)

12.5.5 Singapore - Market size and forecast 2025-2030

Chart on Singapore - Market size and forecast 2025-2030 ($ million)
Data Table on Singapore - Market size and forecast 2025-2030 ($ million)
Chart on Singapore - Year-over-year growth 2025-2030 (%)
Data Table on Singapore - Year-over-year growth 2025-2030 (%)

12.5.6 Taiwan - Market size and forecast 2025-2030

Chart on Taiwan - Market size and forecast 2025-2030 ($ million)
Data Table on Taiwan - Market size and forecast 2025-2030 ($ million)
Chart on Taiwan - Year-over-year growth 2025-2030 (%)
Data Table on Taiwan - Year-over-year growth 2025-2030 (%)

12.6 Rest of World (ROW) - Market size and forecast 2025-2030

Chart on Rest of World (ROW) - Market size and forecast 2025-2030 ($ million)
Data Table on Rest of World (ROW) - Market size and forecast 2025-2030 ($ million)
Chart on Rest of World (ROW) - Year-over-year growth 2025-2030 (%)
Data Table on Rest of World (ROW) - Year-over-year growth 2025-2030 (%)
Chart on Regional Comparison - Rest of World (ROW)
Data Table on Regional Comparison - Rest of World (ROW)

12.6.1 Brazil - Market size and forecast 2025-2030

Chart on Brazil - Market size and forecast 2025-2030 ($ million)
Data Table on Brazil - Market size and forecast 2025-2030 ($ million)
Chart on Brazil - Year-over-year growth 2025-2030 (%)
Data Table on Brazil - Year-over-year growth 2025-2030 (%)

12.6.2 Australia - Market size and forecast 2025-2030

Chart on Australia - Market size and forecast 2025-2030 ($ million)
Data Table on Australia - Market size and forecast 2025-2030 ($ million)
Chart on Australia - Year-over-year growth 2025-2030 (%)
Data Table on Australia - Year-over-year growth 2025-2030 (%)

12.6.3 Saudi Arabia - Market size and forecast 2025-2030

Chart on Saudi Arabia - Market size and forecast 2025-2030 ($ million)
Data Table on Saudi Arabia - Market size and forecast 2025-2030 ($ million)
Chart on Saudi Arabia - Year-over-year growth 2025-2030 (%)
Data Table on Saudi Arabia - Year-over-year growth 2025-2030 (%)

12.6.4 Israel - Market size and forecast 2025-2030

Chart on Israel - Market size and forecast 2025-2030 ($ million)
Data Table on Israel - Market size and forecast 2025-2030 ($ million)
Chart on Israel - Year-over-year growth 2025-2030 (%)
Data Table on Israel - Year-over-year growth 2025-2030 (%)

12.6.5 UAE - Market size and forecast 2025-2030

Chart on UAE - Market size and forecast 2025-2030 ($ million)
Data Table on UAE - Market size and forecast 2025-2030 ($ million)
Chart on UAE - Year-over-year growth 2025-2030 (%)
Data Table on UAE - Year-over-year growth 2025-2030 (%)

12.6.6 South Africa - Market size and forecast 2025-2030

Chart on South Africa - Market size and forecast 2025-2030 ($ million)
Data Table on South Africa - Market size and forecast 2025-2030 ($ million)
Chart on South Africa - Year-over-year growth 2025-2030 (%)
Data Table on South Africa - Year-over-year growth 2025-2030 (%)

12.6.7 Argentina - Market size and forecast 2025-2030

Chart on Argentina - Market size and forecast 2025-2030 ($ million)
Data Table on Argentina - Market size and forecast 2025-2030 ($ million)
Chart on Argentina - Year-over-year growth 2025-2030 (%)
Data Table on Argentina - Year-over-year growth 2025-2030 (%)

12.6.8 Colombia - Market size and forecast 2025-2030

Chart on Colombia - Market size and forecast 2025-2030 ($ million)
Data Table on Colombia - Market size and forecast 2025-2030 ($ million)
Chart on Colombia - Year-over-year growth 2025-2030 (%)
Data Table on Colombia - Year-over-year growth 2025-2030 (%)

12.7 Market opportunity by geography

Market opportunity by geography ($ million)
Data Tables on Market opportunity by geography ($ million)

13. Drivers, Challenges, and Opportunity

13.1 Market drivers

Rising prevalence of genetic and rare diseases
Expanding regulatory and clinical validation of RNA therapeutics
Growing investment in precision medicine and genomic research

13.2 Market challenges

High development complexity and clinical attrition
Stringent regulatory requirements
Limited delivery efficiency across diverse tissue targets

13.3 Impact of drivers and challenges

Impact of drivers and challenges in 2025 and 2030

13.4 Market opportunities

Shift toward RNA editing and next-generation oligonucleotide modalities
Expansion of integrated development and manufacturing partnerships
Increasing adoption of digital and AI enabled discovery workflows

14. Competitive Landscape

14.1 Overview

14.2

Overview on criticality of inputs and factors of differentiation

14.3 Landscape disruption

Overview on factors of disruption

14.4 Industry risks

Impact of key risks on business

15. Competitive Analysis

15.1 Companies profiled

Companies covered

15.2 Company ranking index

15.3 Market positioning of companies

Matrix on companies position and classification

15.4 Agilent Technologies Inc.

Agilent Technologies Inc. - Overview
Agilent Technologies Inc. - Business segments
Agilent Technologies Inc. - Key news
Agilent Technologies Inc. - Key offerings
Agilent Technologies Inc. - Segment focus
SWOT

15.5 Alnylam Pharmaceuticals Inc.

Alnylam Pharmaceuticals Inc. - Overview
Alnylam Pharmaceuticals Inc. - Product / Service
Alnylam Pharmaceuticals Inc. - Key offerings
SWOT

15.6 Astellas Pharma Inc.

Astellas Pharma Inc. - Overview
Astellas Pharma Inc. - Product / Service
Astellas Pharma Inc. - Key news
Astellas Pharma Inc. - Key offerings
SWOT

15.7 AstraZeneca Plc

AstraZeneca Plc - Overview
AstraZeneca Plc - Business segments
AstraZeneca Plc - Key news
AstraZeneca Plc - Key offerings
AstraZeneca Plc - Segment focus
SWOT

15.8 Bachem AG

Bachem AG - Overview
Bachem AG - Business segments
Bachem AG - Key news
Bachem AG - Key offerings
Bachem AG - Segment focus
SWOT

15.9 Biogen Inc.

Biogen Inc. - Overview
Biogen Inc. - Product / Service
Biogen Inc. - Key news
Biogen Inc. - Key offerings
SWOT

15.10 Catalent Inc.

Catalent Inc. - Overview
Catalent Inc. - Product / Service
Catalent Inc. - Key offerings
SWOT

15.11 Ionis Pharmaceuticals Inc.

Ionis Pharmaceuticals Inc. - Overview
Ionis Pharmaceuticals Inc. - Product / Service
Ionis Pharmaceuticals Inc. - Key news
Ionis Pharmaceuticals Inc. - Key offerings
SWOT

15.12 Jazz Pharmaceuticals Plc

Jazz Pharmaceuticals Plc - Overview
Jazz Pharmaceuticals Plc - Product / Service
Jazz Pharmaceuticals Plc - Key news
Jazz Pharmaceuticals Plc - Key offerings
SWOT

15.13 Lonza Group Ltd.

Lonza Group Ltd. - Overview
Lonza Group Ltd. - Business segments
Lonza Group Ltd. - Key news
Lonza Group Ltd. - Key offerings
Lonza Group Ltd. - Segment focus
SWOT

15.14 Novartis AG

Novartis AG - Overview
Novartis AG - Business segments
Novartis AG - Key news
Novartis AG - Key offerings
Novartis AG - Segment focus
SWOT

15.15 Novo Nordisk AS

Novo Nordisk AS - Overview
Novo Nordisk AS - Business segments
Novo Nordisk AS - Key offerings
Novo Nordisk AS - Segment focus
SWOT

15.16 Sanofi SA

Sanofi SA - Overview
Sanofi SA - Business segments
Sanofi SA - Key news
Sanofi SA - Key offerings
Sanofi SA - Segment focus
SWOT

15.17 Sarepta Therapeutics Inc.

Sarepta Therapeutics Inc. - Overview
Sarepta Therapeutics Inc. - Product / Service
Sarepta Therapeutics Inc. - Key offerings
SWOT

15.18 Thermo Fisher Scientific Inc.

Thermo Fisher Scientific Inc. - Overview
Thermo Fisher Scientific Inc. - Business segments
Thermo Fisher Scientific Inc. - Key news
Thermo Fisher Scientific Inc. - Key offerings
Thermo Fisher Scientific Inc. - Segment focus
SWOT

16. Appendix

16.1 Scope of the report

Market definition
Objectives
Notes and caveats

16.2 Inclusions and exclusions checklist

Inclusions checklist
Exclusions checklist

16.3 Currency conversion rates for US$

16.4 Research methodology

16.5 Data procurement

Information sources

16.6 Data validation

16.7 Validation techniques employed for market sizing

16.8 Data synthesis

16.9 360 degree market analysis

16.10 List of abbreviations

Research Methodology

Technavio presents a detailed picture of the market by way of study, synthesis, and summation of data from multiple sources. The analysts have presented the various facets of the market with a particular focus on identifying the key industry influencers. The data thus presented is comprehensive, reliable, and the result of extensive research, both primary and secondary.

INFORMATION SOURCES

Primary sources

  • Manufacturers and suppliers
  • Channel partners
  • Industry experts
  • Strategic decision makers

Secondary sources

  • Industry journals and periodicals
  • Government data
  • Financial reports of key industry players
  • Historical data
  • Press releases

DATA ANALYSIS

Data Synthesis

  • Collation of data
  • Estimation of key figures
  • Analysis of derived insights

Data Validation

  • Triangulation with data models
  • Reference against proprietary databases
  • Corroboration with industry experts

REPORT WRITING

Qualitative

  • Market drivers
  • Market challenges
  • Market trends
  • Five forces analysis

Quantitative

  • Market size and forecast
  • Market segmentation
  • Geographical insights
  • Competitive landscape

Interested in this report?

Get your sample now to see our research methodology and insights!

Download Now

Frequently Asked Questions

Oligonucleotide Therapeutics market growth will increase by USD 18613.9 million during 2026-2030.

The Oligonucleotide Therapeutics market is expected to grow at a CAGR of 19.7% during 2026-2030.

Oligonucleotide Therapeutics market is segmented by Type (Neurological, Cancer, Others) Application (ASOs, RNAi, Others) End-user (Hospitals, Specialty treatment centers, Research institutes and academic centers)

Agilent Technologies Inc., Alnylam Pharmaceuticals Inc., Arrowhead Pharmaceuticals Inc., Astellas Pharma Inc., AstraZeneca Plc, Bachem AG, Biogen Inc., Catalent Inc., Corden Pharma Intl. GmbH, Ionis Pharmaceuticals Inc., Jazz Pharmaceuticals Plc, Lonza Group Ltd., Nitto Denko Avecia Inc., Novartis AG, Novo Nordisk AS, NS Pharma Inc., Sanofi SA, Sarepta Therapeutics Inc., Syngene International Ltd., Thermo Fisher Scientific Inc., WuXi AppTec Co. Ltd. are a few of the key vendors in the Oligonucleotide Therapeutics market.

North America will register the highest growth rate of 39.3% among the other regions. Therefore, the Oligonucleotide Therapeutics market in North America is expected to garner significant business opportunities for the vendors during the forecast period.

US, Canada, Mexico, Germany, UK, France, Italy, Spain, The Netherlands, China, Japan, South Korea, India, Singapore, Taiwan, Brazil, Australia, Saudi Arabia, Israel, UAE, South Africa, Argentina, Colombia

  • Rising prevalence of genetic and rare diseases is the driving factor this market.

The Oligonucleotide Therapeutics market vendors should focus on grabbing business opportunities from the Type segment as it accounted for the largest market share in the base year.
RIA - Research AI Assistant
Ask RIA
