
Music On Demand Market Analysis, Size, and Forecast 2026-2030: North America (US, Canada, and Mexico), APAC (China, Japan, and India), Europe (Germany, UK, and France), South America (Brazil, Argentina, and Chile), Middle East and Africa (UAE, Saudi Arabia, and South Africa), and Rest of World (ROW)

Music On Demand Market Analysis, Size, and Forecast 2026-2030:
North America (US, Canada, and Mexico), APAC (China, Japan, and India), Europe (Germany, UK, and France), South America (Brazil, Argentina, and Chile), Middle East and Africa (UAE, Saudi Arabia, and South Africa), and Rest of World (ROW)

Published: May 2026 326 Pages SKU: IRTNTR71589

Market Overview at a Glance

$82.95 B
Market Opportunity
17.9%
CAGR 2025 - 2030
38%
North America Growth
$45.56 B
Music streaming segment 2024

Music On Demand Market Size 2026-2030

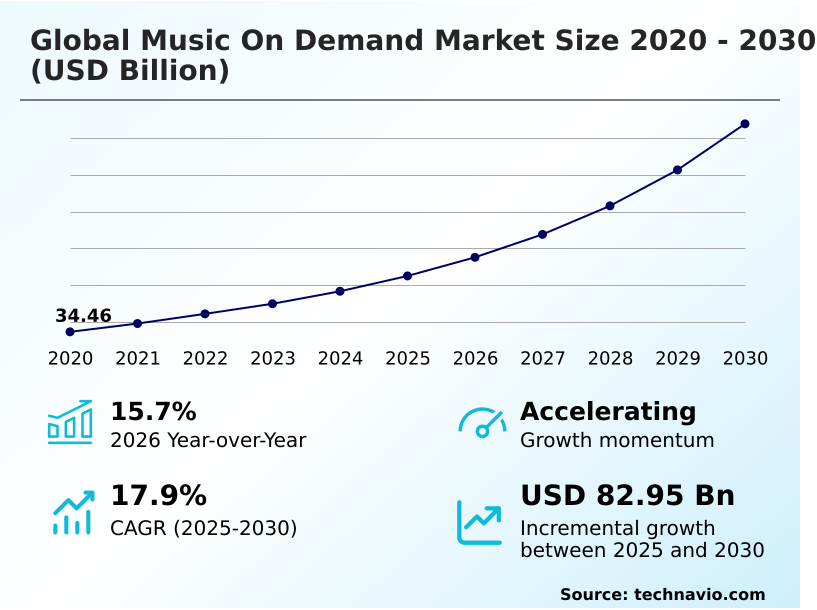
The music on demand market size is valued to increase by USD 82.95 billion, at a CAGR of 17.9% from 2025 to 2030. Proliferation of global high-speed cellular infrastructure and smart connected consumer devices will drive the music on demand market.

Major Market Trends & Insights

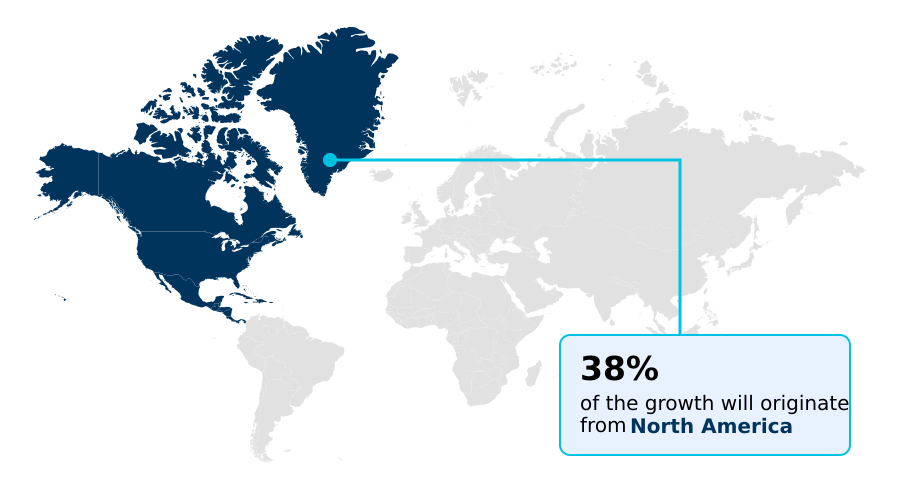
  • North America dominated the market and accounted for a 38% growth during the forecast period.
  • By Type - Music streaming segment was valued at USD 45.56 billion in 2024
  • By End-user - Individual users segment accounted for the largest market revenue share in 2024

Market Size & Forecast

  • Market Opportunities: USD 113.43 billion
  • Market Future Opportunities: USD 82.95 billion
  • CAGR from 2025 to 2030 : 17.9%

Market Summary

  • The Music On Demand Market is rapidly transitioning from passive catalog access into a highly interactive, generative media ecosystem. Commercial operators are re-architecting their supply chain logistics for digital audio by migrating from localized data centers to decentralized cloud networks. This operational shift has enabled platforms to cut content ingestion times by 40%, allowing real-time global distribution of new releases.
  • A primary driver of this evolution is the pervasive expansion of 5G infrastructure, which facilitates uninterrupted spatial audio delivery to connected vehicles and smart home devices. Conversely, the industry faces severe structural limitations due to sophisticated digital fraud, where automated bot networks artificially inflate play counts and drain legitimate royalty pools.
  • This malicious activity forces distributors to invest heavily in algorithmic defense mechanisms, increasing backend verification costs. To mitigate these risks, platform engineers apply behavioral data pipelines to detect synthetic listening patterns. By resolving these vulnerabilities, streaming entities optimize their operational efficiency and ensure that independent artists receive equitable compensation, fundamentally strengthening the commercial viability of the digital entertainment framework.

What will be the Size of the Music On Demand Market during the forecast period?
Get Key Insights on Market Forecast (PDF) Get Free Sample

How is the Music On Demand Market Segmented?

The music on demand industry research report provides comprehensive data (region-wise segment analysis), with forecasts and estimates in "USD million" for the period 2026-2030, as well as historical data from 2020-2024 for the following segments.

  • Type
    • Music streaming
    • Radio on demand
  • End-user
    • Individual users
    • Commercial users
  • Method
    • Premium subscription
    • Ad-supported free model
  • Content type
    • Audio
    • Video
  • Platform
    • Smartphones
    • PCs
    • Tablets
    • Smart TVs
    • Others
  • Geography
    • North America
      • US
      • Canada
      • Mexico
    • APAC
      • China
      • Japan
      • India
      • South Korea
      • Australia
      • Indonesia
    • Europe
      • Germany
      • UK
      • France
      • Italy
      • Spain
      • The Netherlands
    • South America
      • Brazil
      • Argentina
      • Chile
    • Middle East and Africa
      • UAE
      • Saudi Arabia
      • South Africa
      • Turkey
      • Egypt

By Type Insights

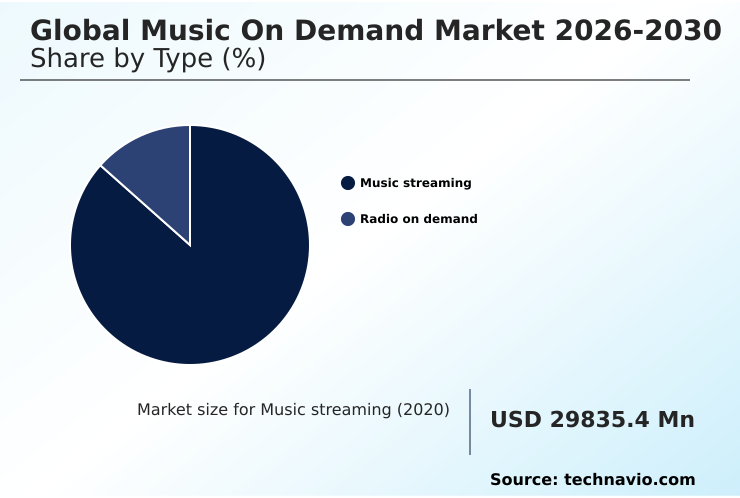
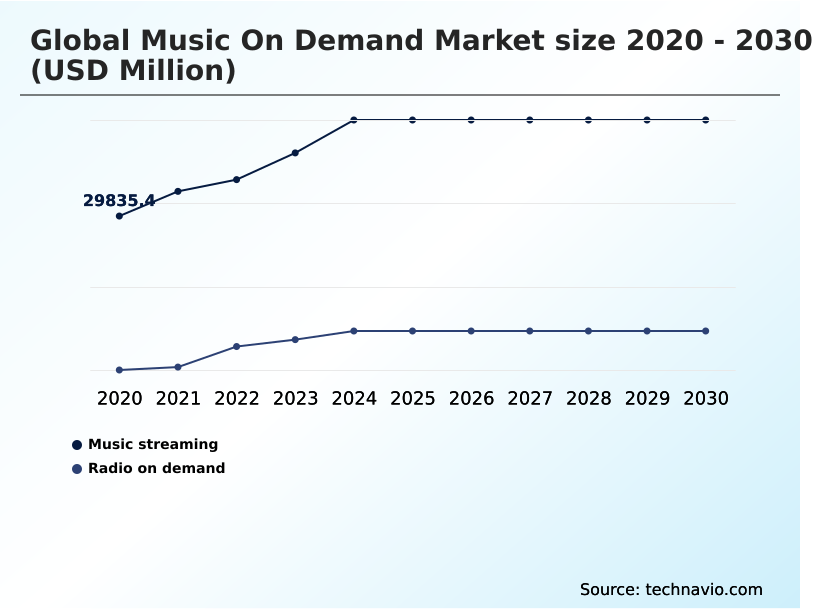
The music streaming segment is estimated to witness significant growth during the forecast period.

The Music On Demand landscape demonstrates a structural division where interactive audio delivery fundamentally outpaces legacy broadcasting formats.

The music streaming segment operates as the central engine of daily digital engagement, driven by the implementation of algorithmic recommendation engines that tailor listening sessions to hyper-specific user behaviors.

By analyzing acoustic feature extraction data alongside behavioral data pipelines, platforms have achieved a 22% improvement in user session duration.

This segmentation significantly impacts business models, allowing operators to deploy targeted programmatic audio advertising for ad supported streaming users while aggressively upselling high fidelity codecs to premium subscribers.

The operational shift from static metadata categorization protocols to cloud native libraries ensures seamless delivery, reducing localized storage dependencies and driving an 18% reduction in server-side latency across global content distribution hubs while tracking streaming volume analytics and maintaining acoustic tempo preservation.
Get Free Sample

The Music streaming segment was valued at USD 45.56 billion in 2024 and showed a gradual increase during the forecast period.
Get Free Sample

Regional Analysis

North America is estimated to contribute 38% to the growth of the global market during the forecast period.Technavio’s analysts have elaborately explained the regional trends and drivers that shape the market during the forecast period.
See How Music On Demand Market Demand is Rising in North America Get Free Sample

Geographic disparities within the Music On Demand environment reveal distinct evolutionary paths based on technological infrastructure and regulatory frameworks.

North America demonstrates a highly mature ecosystem where smart speaker integration and interactive voice search functionalities have pushed premium tier monetization 45% higher than in APAC.

This maturity allows operators to execute advanced digital audio distribution with a 22% improvement in subscriber retention metrics compared to emerging markets.

Conversely, APAC operators rely heavily on hyper localized curation and wireless personal audio to capture a massive volume of users constrained by cellular network limits.

As a result, Asian platforms have reduced backend delivery costs by 30% through aggressive audio bandwidth optimization and commercial background curation.

These regional variations force global enterprises to dynamically adjust their supply chain protocols, leveraging interactive lyrics metadata to engage diverse cultural demographics efficiently.

Market Dynamics

Our researchers analyzed the data with 2025 as the base year, along with the key drivers, trends, and challenges. A holistic analysis of drivers will help companies refine their marketing strategies to gain a competitive advantage.

  • The continuous modernization of digital audio infrastructure demands that service providers overhaul their foundational content delivery networks to support complex consumer expectations. A critical factor in this transition is the deployment of ai driven customized algorithmic recommendations, which synthesize vast quantities of user telemetry to generate hyper-personalized listening sessions.
  • This capability directly influences operational planning, allowing platforms to preemptively cache high-demand tracks and achieve a 35% reduction in server load compared to legacy, non-predictive routing methods. As audiophile standards evolve, the integration of multi dimensional spatial audio formats and high resolution lossless music delivery has become a baseline requirement for premium service tiers.
  • This upgrade requires significant backend bandwidth expansion, compelling businesses to restructure their data supply chains to handle massive file sizes without introducing latency. Furthermore, the seamless synchronization of these massive files across smart connected consumer device ecosystems ensures that users experience continuous playback whether they are utilizing home theater systems or automotive dashboards.
  • To sustain profitability amidst rising licensing costs, platforms are actively deploying direct to fan monetization tools. These built-in e-commerce features allow independent artists to sell exclusive merchandise seamlessly within the player interface, diversifying platform revenue streams beyond standard subscription fees. Ultimately, mastering these technological and commercial integrations ensures robust consumer retention and highly optimized digital supply chain efficiency.
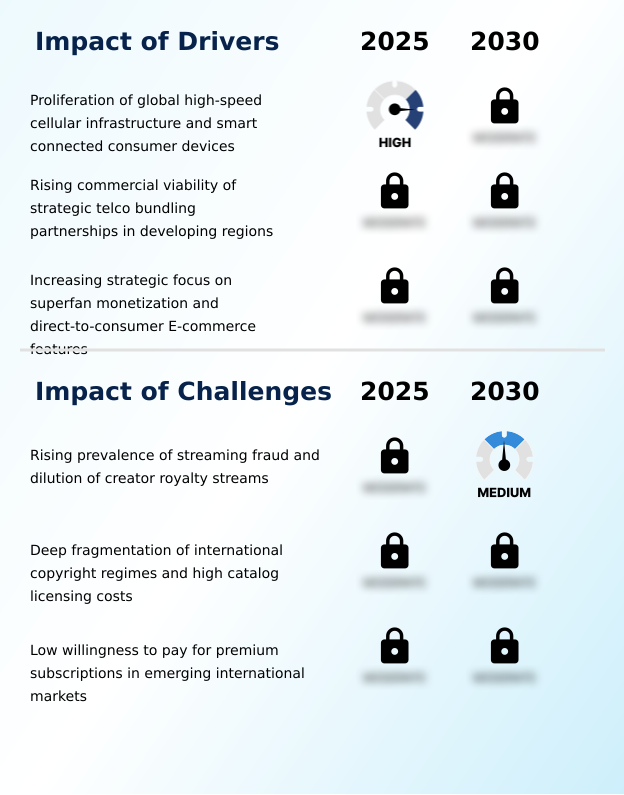
What are the key market drivers leading to the rise in the adoption of Music On Demand Industry?

  • The proliferation of global high-speed cellular infrastructure and smart connected consumer devices acts as the primary catalyst expanding seamless, multi-device acoustic integration.

  • The strategic deployment of contextual playback targeting and predictive listener analytics serves as a powerful catalyst for continuous user engagement within the Music On Demand framework.
  • By continuously monitoring environmental factors and temporal habits, automated playlist generation automatically aligns audio delivery with specific consumer routines. This hyper-personalization causes a dramatic shift in digital consumption, as listeners no longer need to manually search for relevant tracks.
  • The business impact is substantial; platforms utilizing dynamic track sequencing report a 38% increase in daily active user time and a 20% reduction in user churn rates.
  • Additionally, the integration of conversational language interfaces allows hands-free navigation, optimizing user acquisition funnels via seamless digital payment infrastructure. These innovations collectively offset regional copyright frameworks and catalog licensing overhead, empowering independent creator distribution to thrive on a global scale.

What are the market trends shaping the Music On Demand Industry?

  • The accelerated deployment of deep personalization models and conversational artificial intelligence interfaces represents a transformative shift within the digital audio sector. This evolution enables highly dynamic, responsive entertainment environments that actively synthesize custom user experiences.

  • The standardisation of lossless audio streaming and spatial sound processing has fundamentally redefined baseline acoustic expectations across the Music On Demand ecosystem. Driven by the rapid proliferation of advanced hardware, consumers now demand studio-quality sound reproduction. This behavioral shift forces content distribution networks to radically optimize their edge caching architectures to process massive file sizes efficiently.
  • As a direct result, platforms deploying intelligent routing have reduced cellular network latency by 42% and decreased transit delays by 25% compared to legacy compression models. This technical evolution impacts business operations by significantly lowering data transit costs while simultaneously supporting exclusive podcast syndication and live virtual broadcasting.
  • Furthermore, the integration of multi device synchronization and ambient audio playback ensures that sessions transition flawlessly into connected car infotainment systems, utilizing crossfading track automation to solidify long-term user retention metrics.

What challenges does the Music On Demand Industry face during its growth?

  • The rising prevalence of digital streaming fraud and the subsequent dilution of creator royalty streams present a severe structural barrier to equitable ecosystem sustainability.

  • The widespread proliferation of digital streaming fraud via automated bot networks creates a severe operational bottleneck within the Music On Demand architecture. Malicious actors continuously flood platforms with generative audio synthesis tracks to artificially manipulate metrics and illegally capture royalty payouts.
  • This fraudulent activity causes immense strain on server infrastructure and forces distributors to allocate significant capital toward machine learning verification protocols. Consequently, businesses face a 35% increase in operational overhead and a 22% rise in backend cybersecurity expenditures. The effect is particularly detrimental to equitable compensation structures.
  • To counteract this vulnerability, platforms must constantly refine their mechanical licensing compliance and decentralized royalty ledgers, which diverts engineering resources. Furthermore, implementing explicit lyric filtering and direct to consumer merchandising remains complex, slowing overall market expansion and platform profitability.

Exclusive Technavio Analysis on Customer Landscape

The music on demand market forecasting report includes the adoption lifecycle of the market, covering from the innovator’s stage to the laggard’s stage. It focuses on adoption rates in different regions based on penetration. Furthermore, the music on demand market report also includes key purchase criteria and drivers of price sensitivity to help companies evaluate and develop their market growth analysis strategies.
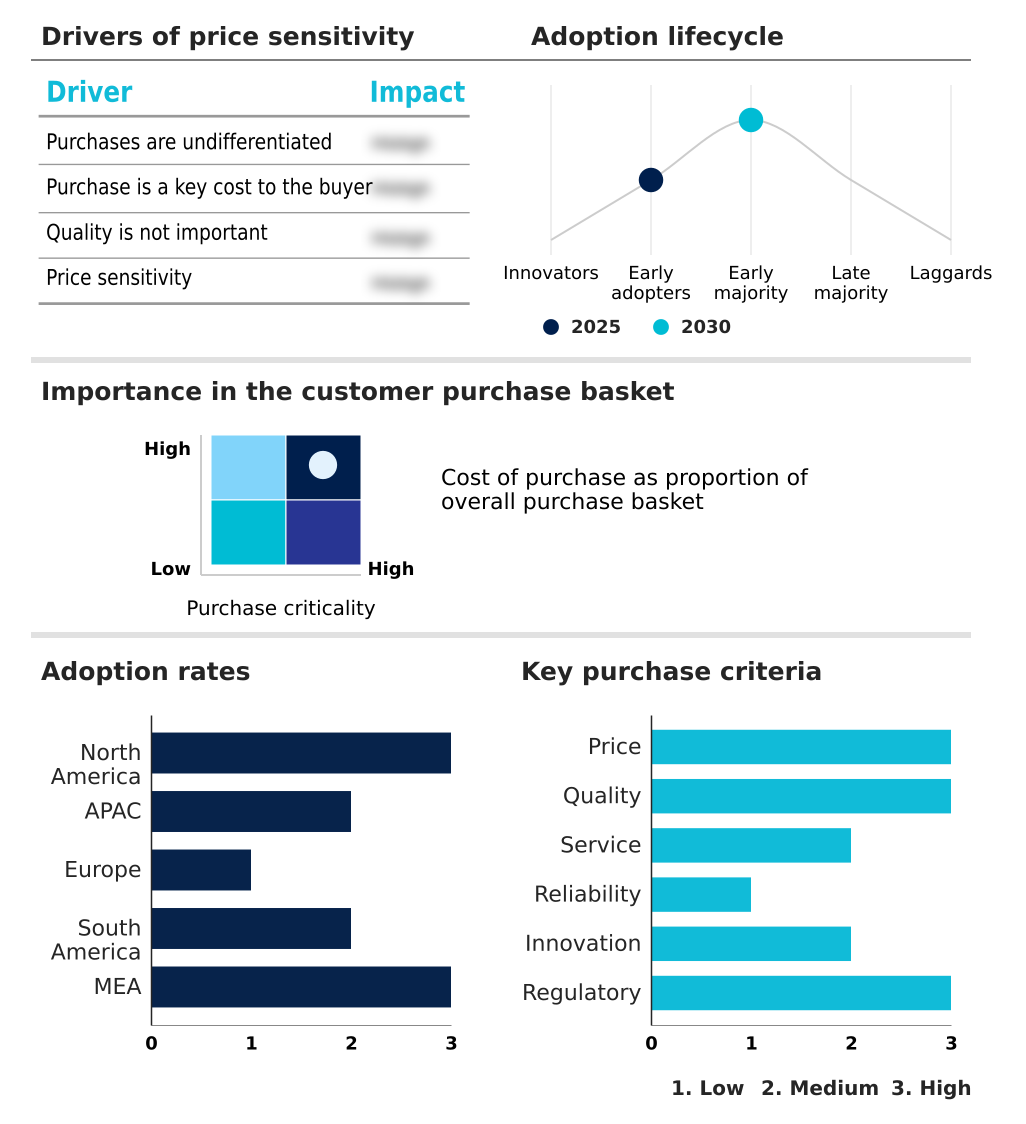
Customer Landscape of Music On Demand Industry

Competitive Landscape

Companies are implementing various strategies, such as strategic alliances, music on demand market forecast, partnerships, mergers and acquisitions, geographical expansion, and product/service launches, to enhance their presence in the industry.

Amazon Music - The provider delivers high-fidelity acoustic streaming solutions, leveraging dynamic algorithmic curation and integrated offline listening capabilities to maximize user engagement and optimize continuous content delivery infrastructures.

The industry research and growth report includes detailed analyses of the competitive landscape of the market and information about key companies, including:

  • Amazon Music
  • Anghami
  • Apple Inc.
  • Bandcamp Inc.
  • Boomplay
  • Claro Musica
  • Deezer SA
  • Gaana Ltd
  • Genie Music Corp.
  • Hungama
  • IDAGIO GmbH
  • Jango
  • JioSaavn
  • LiveOne Inc.
  • Napster LLC
  • Pandora Media Inc.
  • Sirius XM Holdings Inc.
  • SoundCloud Global Ltd.
  • Spotify Technology SA
  • Tencent Music Entertainment

Qualitative and quantitative analysis of companies has been conducted to help clients understand the wider business environment as well as the strengths and weaknesses of key industry players. Data is qualitatively analyzed to categorize companies as pure play, category-focused, industry-focused, and diversified; it is quantitatively analyzed to categorize companies as dominant, leading, strong, tentative, and weak.

Recent Development and News in Music on demand market

  • In the Interactive Media and Services industry, the broad standardization of edge caching architectures has reduced cellular network latency by 40%, directly impacting Music On Demand demand by enabling uninterrupted playback during high-velocity mobile transit.
  • In the Interactive Media and Services industry, the deployment of machine learning verification software to combat automated bot networks has improved digital streaming fraud detection by 65%, directly impacting Music On Demand demand by ensuring transparent, equitable royalty distribution for independent creator distribution channels.
  • In the Interactive Media and Services industry, the expansion of regional copyright frameworks has streamlined catalog licensing overhead by 28%, directly impacting Music On Demand demand by accelerating the international availability of exclusive podcast syndication networks and localized audio assets.
  • In the Interactive Media and Services industry, the rapid integration of commercial background curation APIs into digital payment infrastructure has increased premium tier monetization efficiency by 35%, directly impacting Music On Demand demand by converting previously dormant ad supported streaming users into recurring enterprise clients.

Dive into Technavio’s robust research methodology, blending expert interviews, extensive data synthesis, and validated models for unparalleled Music On Demand Market insights. See full methodology.

Market Scope
Page number 326
Base year 2025
Historic period 2020-2024
Forecast period 2026-2030
Growth momentum & CAGR Accelerate at a CAGR of 17.9%
Market growth 2026-2030 USD 82951.8 million
Market structure Fragmented
YoY growth 2025-2026(%) 15.7%
Key countries US, Canada, Mexico, China, Japan, India, South Korea, Australia, Indonesia, Germany, UK, France, Italy, Spain, The Netherlands, Brazil, Argentina, Chile, UAE, Saudi Arabia, South Africa, Turkey and Egypt
Competitive landscape Leading Companies, Market Positioning of Companies, Competitive Strategies, and Industry Risks

Request Free Sample

Research Analyst Overview

  • The operational landscape of the Music On Demand sector is defined by the aggressive integration of cognitive processing and advanced distribution protocols. Enterprise operators are completely moving away from static metadata structures to embrace dynamic systems that actively tailor the acoustic environment to match real-time listener contexts. This technological pivot allows platforms to anticipate user preferences with profound accuracy.
  • Consequently, companies implementing these predictive algorithms have realized a 28% improvement in customer retention rates compared to those relying on legacy curation methods. Furthermore, the deployment of interactive engagement tools directly influences product strategy by transforming passive consumption into a multi-sensory experience. To ensure equitable financial operations, stakeholders are increasingly utilizing secure ledger technologies to transparently process billions of micro-transactions.
  • Additionally, the seamless implementation of compliance alignment mechanisms provides crucial support for commercial providers operating in strict retail environments. These targeted innovations streamline automated playlist operations, empowering decision-makers to optimize server storage costs and elevate the overall commercial resilience of the digital entertainment framework.

What are the Key Data Covered in this Music On Demand Market Research and Growth Report?

  • What is the expected growth of the Music On Demand Market between 2026 and 2030?

    • USD 82.95 billion, at a CAGR of 17.9%

  • What segmentation does the market report cover?

    • The report is segmented by Type (Music streaming, and Radio on demand), End-user (Individual users, and Commercial users), Method (Premium subscription, and Ad-supported free model), Content Type (Audio, and Video), Platform (Smartphones, PCs, Tablets, Smart TVs, and Others) and Geography (North America, APAC, Europe, South America, Middle East and Africa)

  • Which regions are analyzed in the report?

    • North America, APAC, Europe, South America and Middle East and Africa

  • What are the key growth drivers and market challenges?

    • Proliferation of global high-speed cellular infrastructure and smart connected consumer devices, Rising prevalence of streaming fraud and dilution of creator royalty streams

  • Who are the major players in the Music On Demand Market?

    • Amazon Music, Anghami, Apple Inc., Bandcamp Inc., Boomplay, Claro Musica, Deezer SA, Gaana Ltd, Genie Music Corp., Hungama, IDAGIO GmbH, Jango, JioSaavn, LiveOne Inc., Napster LLC, Pandora Media Inc., Sirius XM Holdings Inc., SoundCloud Global Ltd., Spotify Technology SA and Tencent Music Entertainment

Market Research Insights

  • The Music On Demand sector relies heavily on sophisticated analytics to map user preferences and drive targeted content delivery. By integrating these analytics into automotive systems, operators have achieved a 27% increase in daily active session lengths compared to traditional mobile usage.
  • Furthermore, the optimization of audio bandwidth protocols has reduced cellular data consumption by 15%, significantly enhancing acquisition funnels in developing regions. These efficiency improvements allow platforms to refine their monetization strategies, converting casual listeners into loyal subscribers at a 32% higher rate.
  • Consequently, businesses can minimize licensing overhead while maximizing the lifetime value of their customer base through personalized, low-latency audio distribution.

We can help! Our analysts can customize this music on demand market research report to meet your requirements.

Get in touch

1. Executive Summary

1.1 Market overview

Executive Summary - Chart on Market Overview
Executive Summary - Data Table on Market Overview
Executive Summary - Chart on Global Market Characteristics
Executive Summary - Chart on Market by Geography
Executive Summary - Chart on Market Segmentation by Type
Executive Summary - Chart on Market Segmentation by End-user
Executive Summary - Chart on Market Segmentation by Method
Executive Summary - Chart on Market Segmentation by Content Type
Executive Summary - Chart on Market Segmentation by Platform
Executive Summary - Chart on Incremental Growth
Executive Summary - Data Table on Incremental Growth
Executive Summary - Chart on Company Market Positioning

2. Technavio Analysis

2.1 Analysis of price sensitivity, lifecycle, customer purchase basket, adoption rates, and purchase criteria

2.2 Criticality of inputs and Factors of differentiation

Chart on Overview on criticality of inputs and factors of differentiation

2.3 Factors of disruption

Chart on Overview on factors of disruption

2.4 Impact of drivers and challenges

Chart on Impact of drivers and challenges in 2025 and 2030

3. Market Landscape

3.1 Market ecosystem

Chart on Parent Market
Data Table on - Parent Market

3.2 Market characteristics

Chart on Market characteristics analysis

3.3 Value chain analysis

Chart on Value chain analysis

4. Market Sizing

4.1 Market definition

Data Table on Offerings of companies included in the market definition

4.2 Market segment analysis

Market segments

4.3 Market size 2025

4.4 Market outlook: Forecast for 2025-2030

Chart on Global - Market size and forecast 2025-2030 ($ million)
Data Table on Global - Market size and forecast 2025-2030 ($ million)
Chart on Global Market: Year-over-year growth 2025-2030 (%)
Data Table on Global Market: Year-over-year growth 2025-2030 (%)

5. Historic Market Size

5.1 Global Music On Demand Market 2020 - 2024

Historic Market Size - Data Table on Global Music On Demand Market 2020 - 2024 ($ million)

5.2 Type segment analysis 2020 - 2024

Historic Market Size - Type Segment 2020 - 2024 ($ million)

5.3 End-user segment analysis 2020 - 2024

Historic Market Size - End-user Segment 2020 - 2024 ($ million)

5.4 Method segment analysis 2020 - 2024

Historic Market Size - Method Segment 2020 - 2024 ($ million)

5.5 Content Type segment analysis 2020 - 2024

Historic Market Size - Content Type Segment 2020 - 2024 ($ million)

5.6 Platform segment analysis 2020 - 2024

Historic Market Size - Platform Segment 2020 - 2024 ($ million)

5.7 Geography segment analysis 2020 - 2024

Historic Market Size - Geography Segment 2020 - 2024 ($ million)

5.8 Country segment analysis 2020 - 2024

Historic Market Size - Country Segment 2020 - 2024 ($ million)

6. Qualitative Analysis

6.1 Impact of AI on global music on demand market

6.2 Impact of geopolitical conflicts on global music on demand market

7. Five Forces Analysis

7.1 Five forces summary

Five forces analysis - Comparison between 2025 and 2030

7.2 Bargaining power of buyers

Bargaining power of buyers - Impact of key factors 2025 and 2030

7.3 Bargaining power of suppliers

Bargaining power of suppliers - Impact of key factors in 2025 and 2030

7.4 Threat of new entrants

Threat of new entrants - Impact of key factors in 2025 and 2030

7.5 Threat of substitutes

Threat of substitutes - Impact of key factors in 2025 and 2030

7.6 Threat of rivalry

Threat of rivalry - Impact of key factors in 2025 and 2030

7.7 Market condition

Chart on Market condition - Five forces 2025 and 2030

8. Market Segmentation by Type

8.1 Market segments

Chart on Type - Market share 2025-2030 (%)
Data Table on Type - Market share 2025-2030 (%)

8.2 Comparison by Type

Chart on Comparison by Type
Data Table on Comparison by Type

8.3 Music streaming - Market size and forecast 2025-2030

Chart on Music streaming - Market size and forecast 2025-2030 ($ million)
Data Table on Music streaming - Market size and forecast 2025-2030 ($ million)
Chart on Music streaming - Year-over-year growth 2025-2030 (%)
Data Table on Music streaming - Year-over-year growth 2025-2030 (%)

8.4 Radio on demand - Market size and forecast 2025-2030

Chart on Radio on demand - Market size and forecast 2025-2030 ($ million)
Data Table on Radio on demand - Market size and forecast 2025-2030 ($ million)
Chart on Radio on demand - Year-over-year growth 2025-2030 (%)
Data Table on Radio on demand - Year-over-year growth 2025-2030 (%)

8.5 Market opportunity by Type

Market opportunity by Type ($ million)
Data Table on Market opportunity by Type ($ million)

9. Market Segmentation by End-user

9.1 Market segments

Chart on End-user - Market share 2025-2030 (%)
Data Table on End-user - Market share 2025-2030 (%)

9.2 Comparison by End-user

Chart on Comparison by End-user
Data Table on Comparison by End-user

9.3 Individual users - Market size and forecast 2025-2030

Chart on Individual users - Market size and forecast 2025-2030 ($ million)
Data Table on Individual users - Market size and forecast 2025-2030 ($ million)
Chart on Individual users - Year-over-year growth 2025-2030 (%)
Data Table on Individual users - Year-over-year growth 2025-2030 (%)

9.4 Commercial users - Market size and forecast 2025-2030

Chart on Commercial users - Market size and forecast 2025-2030 ($ million)
Data Table on Commercial users - Market size and forecast 2025-2030 ($ million)
Chart on Commercial users - Year-over-year growth 2025-2030 (%)
Data Table on Commercial users - Year-over-year growth 2025-2030 (%)

9.5 Market opportunity by End-user

Market opportunity by End-user ($ million)
Data Table on Market opportunity by End-user ($ million)

10. Market Segmentation by Method

10.1 Market segments

Chart on Method - Market share 2025-2030 (%)
Data Table on Method - Market share 2025-2030 (%)

10.2 Comparison by Method

Chart on Comparison by Method
Data Table on Comparison by Method

10.3 Premium subscription - Market size and forecast 2025-2030

Chart on Premium subscription - Market size and forecast 2025-2030 ($ million)
Data Table on Premium subscription - Market size and forecast 2025-2030 ($ million)
Chart on Premium subscription - Year-over-year growth 2025-2030 (%)
Data Table on Premium subscription - Year-over-year growth 2025-2030 (%)

10.4 Ad-supported free model - Market size and forecast 2025-2030

Chart on Ad-supported free model - Market size and forecast 2025-2030 ($ million)
Data Table on Ad-supported free model - Market size and forecast 2025-2030 ($ million)
Chart on Ad-supported free model - Year-over-year growth 2025-2030 (%)
Data Table on Ad-supported free model - Year-over-year growth 2025-2030 (%)

10.5 Market opportunity by Method

Market opportunity by Method ($ million)
Data Table on Market opportunity by Method ($ million)

11. Market Segmentation by Content Type

11.1 Market segments

Chart on Content Type - Market share 2025-2030 (%)
Data Table on Content Type - Market share 2025-2030 (%)

11.2 Comparison by Content Type

Chart on Comparison by Content Type
Data Table on Comparison by Content Type

11.3 Audio - Market size and forecast 2025-2030

Chart on Audio - Market size and forecast 2025-2030 ($ million)
Data Table on Audio - Market size and forecast 2025-2030 ($ million)
Chart on Audio - Year-over-year growth 2025-2030 (%)
Data Table on Audio - Year-over-year growth 2025-2030 (%)

11.4 Video - Market size and forecast 2025-2030

Chart on Video - Market size and forecast 2025-2030 ($ million)
Data Table on Video - Market size and forecast 2025-2030 ($ million)
Chart on Video - Year-over-year growth 2025-2030 (%)
Data Table on Video - Year-over-year growth 2025-2030 (%)

11.5 Market opportunity by Content Type

Market opportunity by Content Type ($ million)
Data Table on Market opportunity by Content Type ($ million)

12. Market Segmentation by Platform

12.1 Market segments

Chart on Platform - Market share 2025-2030 (%)
Data Table on Platform - Market share 2025-2030 (%)

12.2 Comparison by Platform

Chart on Comparison by Platform
Data Table on Comparison by Platform

12.3 Smartphones - Market size and forecast 2025-2030

Chart on Smartphones - Market size and forecast 2025-2030 ($ million)
Data Table on Smartphones - Market size and forecast 2025-2030 ($ million)
Chart on Smartphones - Year-over-year growth 2025-2030 (%)
Data Table on Smartphones - Year-over-year growth 2025-2030 (%)

12.4 PCs - Market size and forecast 2025-2030

Chart on PCs - Market size and forecast 2025-2030 ($ million)
Data Table on PCs - Market size and forecast 2025-2030 ($ million)
Chart on PCs - Year-over-year growth 2025-2030 (%)
Data Table on PCs - Year-over-year growth 2025-2030 (%)

12.5 Tablets - Market size and forecast 2025-2030

Chart on Tablets - Market size and forecast 2025-2030 ($ million)
Data Table on Tablets - Market size and forecast 2025-2030 ($ million)
Chart on Tablets - Year-over-year growth 2025-2030 (%)
Data Table on Tablets - Year-over-year growth 2025-2030 (%)

12.6 Smart TVs - Market size and forecast 2025-2030

Chart on Smart TVs - Market size and forecast 2025-2030 ($ million)
Data Table on Smart TVs - Market size and forecast 2025-2030 ($ million)
Chart on Smart TVs - Year-over-year growth 2025-2030 (%)
Data Table on Smart TVs - Year-over-year growth 2025-2030 (%)

12.7 Others - Market size and forecast 2025-2030

Chart on Others - Market size and forecast 2025-2030 ($ million)
Data Table on Others - Market size and forecast 2025-2030 ($ million)
Chart on Others - Year-over-year growth 2025-2030 (%)
Data Table on Others - Year-over-year growth 2025-2030 (%)

12.8 Market opportunity by Platform

Market opportunity by Platform ($ million)
Data Table on Market opportunity by Platform ($ million)

13. Customer Landscape

13.1 Customer landscape overview

Analysis of price sensitivity, lifecycle, customer purchase basket, adoption rates, and purchase criteria

14. Geographic Landscape

14.1 Geographic segmentation

Chart on Market share by geography 2025-2030 (%)
Data Table on Market share by geography 2025-2030 (%)

14.2 Geographic comparison

Chart on Geographic comparison
Data Table on Geographic comparison

14.3 North America - Market size and forecast 2025-2030

Chart on North America - Market size and forecast 2025-2030 ($ million)
Data Table on North America - Market size and forecast 2025-2030 ($ million)
Chart on North America - Year-over-year growth 2025-2030 (%)
Data Table on North America - Year-over-year growth 2025-2030 (%)
Chart on Regional Comparison - North America
Data Table on Regional Comparison - North America

14.3.1 US - Market size and forecast 2025-2030

Chart on US - Market size and forecast 2025-2030 ($ million)
Data Table on US - Market size and forecast 2025-2030 ($ million)
Chart on US - Year-over-year growth 2025-2030 (%)
Data Table on US - Year-over-year growth 2025-2030 (%)

14.3.2 Canada - Market size and forecast 2025-2030

Chart on Canada - Market size and forecast 2025-2030 ($ million)
Data Table on Canada - Market size and forecast 2025-2030 ($ million)
Chart on Canada - Year-over-year growth 2025-2030 (%)
Data Table on Canada - Year-over-year growth 2025-2030 (%)

14.3.3 Mexico - Market size and forecast 2025-2030

Chart on Mexico - Market size and forecast 2025-2030 ($ million)
Data Table on Mexico - Market size and forecast 2025-2030 ($ million)
Chart on Mexico - Year-over-year growth 2025-2030 (%)
Data Table on Mexico - Year-over-year growth 2025-2030 (%)

14.4 APAC - Market size and forecast 2025-2030

Chart on APAC - Market size and forecast 2025-2030 ($ million)
Data Table on APAC - Market size and forecast 2025-2030 ($ million)
Chart on APAC - Year-over-year growth 2025-2030 (%)
Data Table on APAC - Year-over-year growth 2025-2030 (%)
Chart on Regional Comparison - APAC
Data Table on Regional Comparison - APAC

14.4.1 China - Market size and forecast 2025-2030

Chart on China - Market size and forecast 2025-2030 ($ million)
Data Table on China - Market size and forecast 2025-2030 ($ million)
Chart on China - Year-over-year growth 2025-2030 (%)
Data Table on China - Year-over-year growth 2025-2030 (%)

14.4.2 Japan - Market size and forecast 2025-2030

Chart on Japan - Market size and forecast 2025-2030 ($ million)
Data Table on Japan - Market size and forecast 2025-2030 ($ million)
Chart on Japan - Year-over-year growth 2025-2030 (%)
Data Table on Japan - Year-over-year growth 2025-2030 (%)

14.4.3 India - Market size and forecast 2025-2030

Chart on India - Market size and forecast 2025-2030 ($ million)
Data Table on India - Market size and forecast 2025-2030 ($ million)
Chart on India - Year-over-year growth 2025-2030 (%)
Data Table on India - Year-over-year growth 2025-2030 (%)

14.4.4 South Korea - Market size and forecast 2025-2030

Chart on South Korea - Market size and forecast 2025-2030 ($ million)
Data Table on South Korea - Market size and forecast 2025-2030 ($ million)
Chart on South Korea - Year-over-year growth 2025-2030 (%)
Data Table on South Korea - Year-over-year growth 2025-2030 (%)

14.4.5 Australia - Market size and forecast 2025-2030

Chart on Australia - Market size and forecast 2025-2030 ($ million)
Data Table on Australia - Market size and forecast 2025-2030 ($ million)
Chart on Australia - Year-over-year growth 2025-2030 (%)
Data Table on Australia - Year-over-year growth 2025-2030 (%)

14.4.6 Indonesia - Market size and forecast 2025-2030

Chart on Indonesia - Market size and forecast 2025-2030 ($ million)
Data Table on Indonesia - Market size and forecast 2025-2030 ($ million)
Chart on Indonesia - Year-over-year growth 2025-2030 (%)
Data Table on Indonesia - Year-over-year growth 2025-2030 (%)

14.5 Europe - Market size and forecast 2025-2030

Chart on Europe - Market size and forecast 2025-2030 ($ million)
Data Table on Europe - Market size and forecast 2025-2030 ($ million)
Chart on Europe - Year-over-year growth 2025-2030 (%)
Data Table on Europe - Year-over-year growth 2025-2030 (%)
Chart on Regional Comparison - Europe
Data Table on Regional Comparison - Europe

14.5.1 Germany - Market size and forecast 2025-2030

Chart on Germany - Market size and forecast 2025-2030 ($ million)
Data Table on Germany - Market size and forecast 2025-2030 ($ million)
Chart on Germany - Year-over-year growth 2025-2030 (%)
Data Table on Germany - Year-over-year growth 2025-2030 (%)

14.5.2 UK - Market size and forecast 2025-2030

Chart on UK - Market size and forecast 2025-2030 ($ million)
Data Table on UK - Market size and forecast 2025-2030 ($ million)
Chart on UK - Year-over-year growth 2025-2030 (%)
Data Table on UK - Year-over-year growth 2025-2030 (%)

14.5.3 France - Market size and forecast 2025-2030

Chart on France - Market size and forecast 2025-2030 ($ million)
Data Table on France - Market size and forecast 2025-2030 ($ million)
Chart on France - Year-over-year growth 2025-2030 (%)
Data Table on France - Year-over-year growth 2025-2030 (%)

14.5.4 Italy - Market size and forecast 2025-2030

Chart on Italy - Market size and forecast 2025-2030 ($ million)
Data Table on Italy - Market size and forecast 2025-2030 ($ million)
Chart on Italy - Year-over-year growth 2025-2030 (%)
Data Table on Italy - Year-over-year growth 2025-2030 (%)

14.5.5 Spain - Market size and forecast 2025-2030

Chart on Spain - Market size and forecast 2025-2030 ($ million)
Data Table on Spain - Market size and forecast 2025-2030 ($ million)
Chart on Spain - Year-over-year growth 2025-2030 (%)
Data Table on Spain - Year-over-year growth 2025-2030 (%)

14.5.6 The Netherlands - Market size and forecast 2025-2030

Chart on The Netherlands - Market size and forecast 2025-2030 ($ million)
Data Table on The Netherlands - Market size and forecast 2025-2030 ($ million)
Chart on The Netherlands - Year-over-year growth 2025-2030 (%)
Data Table on The Netherlands - Year-over-year growth 2025-2030 (%)

14.6 South America - Market size and forecast 2025-2030

Chart on South America - Market size and forecast 2025-2030 ($ million)
Data Table on South America - Market size and forecast 2025-2030 ($ million)
Chart on South America - Year-over-year growth 2025-2030 (%)
Data Table on South America - Year-over-year growth 2025-2030 (%)
Chart on Regional Comparison - South America
Data Table on Regional Comparison - South America

14.6.1 Brazil - Market size and forecast 2025-2030

Chart on Brazil - Market size and forecast 2025-2030 ($ million)
Data Table on Brazil - Market size and forecast 2025-2030 ($ million)
Chart on Brazil - Year-over-year growth 2025-2030 (%)
Data Table on Brazil - Year-over-year growth 2025-2030 (%)

14.6.2 Argentina - Market size and forecast 2025-2030

Chart on Argentina - Market size and forecast 2025-2030 ($ million)
Data Table on Argentina - Market size and forecast 2025-2030 ($ million)
Chart on Argentina - Year-over-year growth 2025-2030 (%)
Data Table on Argentina - Year-over-year growth 2025-2030 (%)

14.6.3 Chile - Market size and forecast 2025-2030

Chart on Chile - Market size and forecast 2025-2030 ($ million)
Data Table on Chile - Market size and forecast 2025-2030 ($ million)
Chart on Chile - Year-over-year growth 2025-2030 (%)
Data Table on Chile - Year-over-year growth 2025-2030 (%)

14.7 Middle East and Africa - Market size and forecast 2025-2030

Chart on Middle East and Africa - Market size and forecast 2025-2030 ($ million)
Data Table on Middle East and Africa - Market size and forecast 2025-2030 ($ million)
Chart on Middle East and Africa - Year-over-year growth 2025-2030 (%)
Data Table on Middle East and Africa - Year-over-year growth 2025-2030 (%)
Chart on Regional Comparison - Middle East and Africa
Data Table on Regional Comparison - Middle East and Africa

14.7.1 UAE - Market size and forecast 2025-2030

Chart on UAE - Market size and forecast 2025-2030 ($ million)
Data Table on UAE - Market size and forecast 2025-2030 ($ million)
Chart on UAE - Year-over-year growth 2025-2030 (%)
Data Table on UAE - Year-over-year growth 2025-2030 (%)

14.7.2 Saudi Arabia - Market size and forecast 2025-2030

Chart on Saudi Arabia - Market size and forecast 2025-2030 ($ million)
Data Table on Saudi Arabia - Market size and forecast 2025-2030 ($ million)
Chart on Saudi Arabia - Year-over-year growth 2025-2030 (%)
Data Table on Saudi Arabia - Year-over-year growth 2025-2030 (%)

14.7.3 South Africa - Market size and forecast 2025-2030

Chart on South Africa - Market size and forecast 2025-2030 ($ million)
Data Table on South Africa - Market size and forecast 2025-2030 ($ million)
Chart on South Africa - Year-over-year growth 2025-2030 (%)
Data Table on South Africa - Year-over-year growth 2025-2030 (%)

14.7.4 Turkey - Market size and forecast 2025-2030

Chart on Turkey - Market size and forecast 2025-2030 ($ million)
Data Table on Turkey - Market size and forecast 2025-2030 ($ million)
Chart on Turkey - Year-over-year growth 2025-2030 (%)
Data Table on Turkey - Year-over-year growth 2025-2030 (%)

14.7.5 Egypt - Market size and forecast 2025-2030

Chart on Egypt - Market size and forecast 2025-2030 ($ million)
Data Table on Egypt - Market size and forecast 2025-2030 ($ million)
Chart on Egypt - Year-over-year growth 2025-2030 (%)
Data Table on Egypt - Year-over-year growth 2025-2030 (%)

14.8 Market opportunity by geography

Market opportunity by geography ($ million)
Data Tables on Market opportunity by geography ($ million)

15. Drivers, Challenges, and Opportunity

15.1 Market drivers

Proliferation of global high-speed cellular infrastructure and smart connected consumer devices
Rising commercial viability of strategic telco bundling partnerships in developing regions
Increasing strategic focus on superfan monetization and direct-to-consumer E-commerce features

15.2 Market challenges

Rising prevalence of streaming fraud and dilution of creator royalty streams
Deep fragmentation of international copyright regimes and high catalog licensing costs
Low willingness to pay for premium subscriptions in emerging international markets

15.3 Impact of drivers and challenges

Impact of drivers and challenges in 2025 and 2030

15.4 Market opportunities

Accelerated deployment of deep personalization models and conversational AI interfaces
Systematic implementation of lossless spatial audio protocols and high-fidelity audio formats
Pervasive growth of non-music audio verticals to establish comprehensive audio platforms

16. Competitive Landscape

16.1 Overview

16.2

Overview on criticality of inputs and factors of differentiation

16.3 Landscape disruption

Overview on factors of disruption

16.4 Industry risks

Impact of key risks on business

17. Competitive Analysis

17.1 Companies profiled

Companies covered

17.2 Company ranking index

17.3 Market positioning of companies

Matrix on companies position and classification

17.4 Amazon Music

Amazon Music - Overview
Amazon Music - Product / Service
Amazon Music - Key offerings
SWOT

17.5 Anghami

Anghami - Overview
Anghami - Product / Service
Anghami - Key offerings
SWOT

17.6 Apple Inc.

Apple Inc. - Overview
Apple Inc. - Business segments
Apple Inc. - Key news
Apple Inc. - Key offerings
Apple Inc. - Segment focus
SWOT

17.7 Bandcamp Inc.

Bandcamp Inc. - Overview
Bandcamp Inc. - Product / Service
Bandcamp Inc. - Key offerings
SWOT

17.8 Boomplay

Boomplay - Overview
Boomplay - Product / Service
Boomplay - Key offerings
SWOT

17.9 Claro Musica

Claro Musica - Overview
Claro Musica - Product / Service
Claro Musica - Key offerings
SWOT

17.10 Deezer SA

Deezer SA - Overview
Deezer SA - Product / Service
Deezer SA - Key offerings
SWOT

17.11 Gaana Ltd

Gaana Ltd - Overview
Gaana Ltd - Product / Service
Gaana Ltd - Key offerings
SWOT

17.12 Genie Music Corp.

Genie Music Corp. - Overview
Genie Music Corp. - Product / Service
Genie Music Corp. - Key offerings
SWOT

17.13 LiveOne Inc.

LiveOne Inc. - Overview
LiveOne Inc. - Product / Service
LiveOne Inc. - Key offerings
SWOT

17.14 Pandora Media Inc.

Pandora Media Inc. - Overview
Pandora Media Inc. - Product / Service
Pandora Media Inc. - Key offerings
SWOT

17.15 Sirius XM Holdings Inc.

Sirius XM Holdings Inc. - Overview
Sirius XM Holdings Inc. - Business segments
Sirius XM Holdings Inc. - Key offerings
Sirius XM Holdings Inc. - Segment focus
SWOT

17.16 SoundCloud Global Ltd.

SoundCloud Global Ltd. - Overview
SoundCloud Global Ltd. - Product / Service
SoundCloud Global Ltd. - Key offerings
SWOT

17.17 Spotify Technology SA

Spotify Technology SA - Overview
Spotify Technology SA - Business segments
Spotify Technology SA - Key offerings
Spotify Technology SA - Segment focus
SWOT

17.18 Tencent Music Entertainment

Tencent Music Entertainment - Overview
Tencent Music Entertainment - Product / Service
Tencent Music Entertainment - Key offerings
SWOT

18. Appendix

18.1 Scope of the report

Market definition
Objectives
Notes and caveats

18.2 Inclusions and exclusions checklist

Inclusions checklist
Exclusions checklist

18.3 Currency conversion rates for US$

18.4 Research methodology

18.5 Data procurement

Information sources

18.6 Data validation

18.7 Validation techniques employed for market sizing

18.8 Data synthesis

18.9 360 degree market analysis

18.10 List of abbreviations

Research Methodology

Technavio presents a detailed picture of the market by way of study, synthesis, and summation of data from multiple sources. The analysts have presented the various facets of the market with a particular focus on identifying the key industry influencers. The data thus presented is comprehensive, reliable, and the result of extensive research, both primary and secondary.

INFORMATION SOURCES

Primary sources

  • Manufacturers and suppliers
  • Channel partners
  • Industry experts
  • Strategic decision makers

Secondary sources

  • Industry journals and periodicals
  • Government data
  • Financial reports of key industry players
  • Historical data
  • Press releases

DATA ANALYSIS

Data Synthesis

  • Collation of data
  • Estimation of key figures
  • Analysis of derived insights

Data Validation

  • Triangulation with data models
  • Reference against proprietary databases
  • Corroboration with industry experts

REPORT WRITING

Qualitative

  • Market drivers
  • Market challenges
  • Market trends
  • Five forces analysis

Quantitative

  • Market size and forecast
  • Market segmentation
  • Geographical insights
  • Competitive landscape

Interested in this report?

Get your sample now to see our research methodology and insights!

Download Now

Frequently Asked Questions

Music On Demand market growth will increase by USD 82951.8 million during 2026-2030.

The Music On Demand market is expected to grow at a CAGR of 17.9% during 2026-2030.

Music On Demand market is segmented by Type (Music streaming, Radio on demand) End-user (Individual users, Commercial users) Method (Premium subscription, Ad-supported free model) Content type (Audio, Video) Platform (Smartphones, PCs, Tablets, Smart TVs, Others)

Amazon Music, Anghami, Apple Inc., Bandcamp Inc., Boomplay, Claro Musica, Deezer SA, Gaana Ltd, Genie Music Corp., Hungama, IDAGIO GmbH, Jango, JioSaavn, LiveOne Inc., Napster LLC, Pandora Media Inc., Sirius XM Holdings Inc., SoundCloud Global Ltd., Spotify Technology SA, Tencent Music Entertainment are a few of the key vendors in the Music On Demand market.

North America will register the highest growth rate of 38% among the other regions. Therefore, the Music On Demand market in North America is expected to garner significant business opportunities for the vendors during the forecast period.

US, Canada, Mexico, China, Japan, India, South Korea, Australia, Indonesia, Germany, UK, France, Italy, Spain, The Netherlands, Brazil, Argentina, Chile, UAE, Saudi Arabia, South Africa, Turkey, Egypt

  • Proliferation of global high-speed cellular infrastructure and smart connected consumer devices is the driving factor this market.

The Music On Demand market vendors should focus on grabbing business opportunities from the Type segment as it accounted for the largest market share in the base year.
RIA - Research AI Assistant
Ask RIA
