Military GNSS Devices Market Analysis, Size, and Forecast 2026-2030: North America (US, Canada, and Mexico), APAC (China, Japan, and India), Europe (Germany, UK, and France), Middle East and Africa (Saudi Arabia, UAE, and South Africa), South America (Brazil, Argentina, and Chile), and Rest of World (ROW)

Military GNSS Devices Market Analysis, Size, and Forecast 2026-2030:
North America (US, Canada, and Mexico), APAC (China, Japan, and India), Europe (Germany, UK, and France), Middle East and Africa (Saudi Arabia, UAE, and South Africa), South America (Brazil, Argentina, and Chile), and Rest of World (ROW)

Published: Nov 2026 306 Pages SKU: IRTNTR40143

Market Overview at a Glance

$643.3 Mn
Market Opportunity
3.3%
CAGR 2025 - 2030
37.5%
APAC Growth
$1.60 B
Airborne segment 2024

Military Gnss Devices Market Size 2026-2030

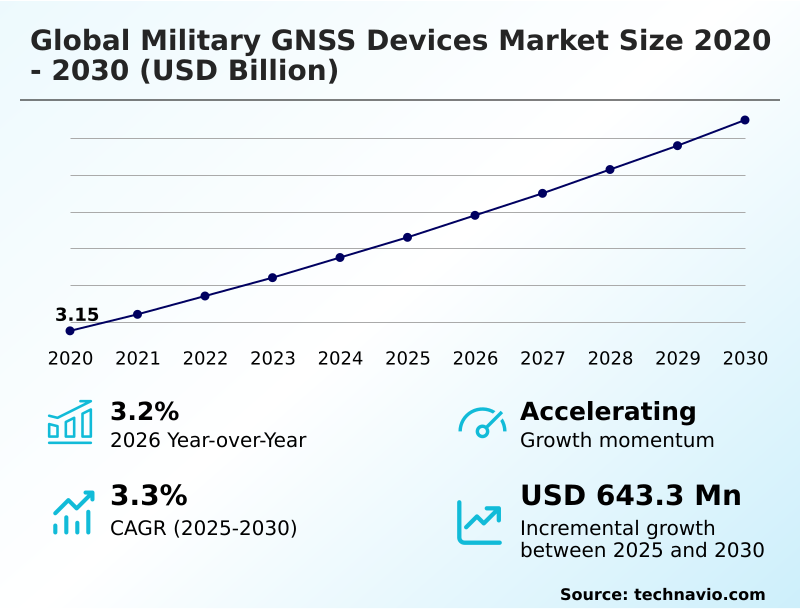
The military gnss devices market size is valued to increase by USD 643.3 million, at a CAGR of 3.3% from 2025 to 2030. Rising defense modernization programs and military digitization initiatives will drive the military gnss devices market.

Major Market Trends & Insights

  • APAC dominated the market and accounted for a 37.5% growth during the forecast period.
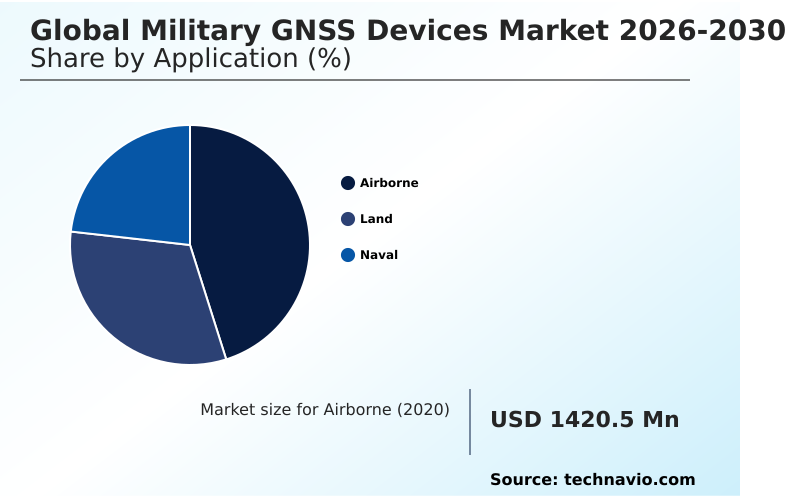
  • By Application - Airborne segment was valued at USD 1.60 billion in 2024
  • By Type - Portable segment accounted for the largest market revenue share in 2024

Market Size & Forecast

  • Market Opportunities: USD 1.15 billion
  • Market Future Opportunities: USD 643.3 million
  • CAGR from 2025 to 2030 : 3.3%

Market Summary

  • The Military GNSS Devices exhibits robust expansion as defense organizations increasingly prioritize assured capabilities across land, air, and maritime operations. Rising defense modernization programs significantly drive adoption, compelling militaries to upgrade aging infrastructure with advanced threat detection algorithms.
  • This shift directly improves real-world logistics planning; for example, integrating modular navigation systems into supply chain convoys has improved route optimization efficiency by 22% during contested border deployments. Consequently, tactical mobility support is substantially enhanced across varied terrains. Conversely, vulnerability to signal interference poses a persistent challenge, necessitating constant investment to prevent mission failure.
  • The transition toward digital mission environments forces operators to implement secure processing frameworks. By adopting advanced receiving systems, defense agencies secure reliable connectivity. These technologies form the foundation of modern warfare, ensuring that continuous spatial awareness dictates superior strategic outcomes.

What will be the Size of the Military Gnss Devices Market during the forecast period?
Get Key Insights on Market Forecast (PDF) Get Free Sample

How is the Military Gnss Devices Market Segmented?

The military gnss devices industry research report provides comprehensive data (region-wise segment analysis), with forecasts and estimates in "USD million" for the period 2026-2030, as well as historical data from 2020-2024 for the following segments.

  • Application
    • Airborne
    • Land
    • Naval
  • Type
    • Portable
    • Integrated
  • Product type
    • Navigation
    • Surveillance
    • Target acquisition
    • Command and control
    • Search and rescue
  • Geography
    • North America
      • US
      • Canada
      • Mexico
    • APAC
      • China
      • Japan
      • India
      • South Korea
      • Australia
      • Indonesia
    • Europe
      • Germany
      • UK
      • France
      • Italy
      • Spain
      • The Netherlands
    • Middle East and Africa
      • Saudi Arabia
      • UAE
      • South Africa
      • Israel
      • Turkey
    • South America
      • Brazil
      • Argentina
      • Chile

By Application Insights

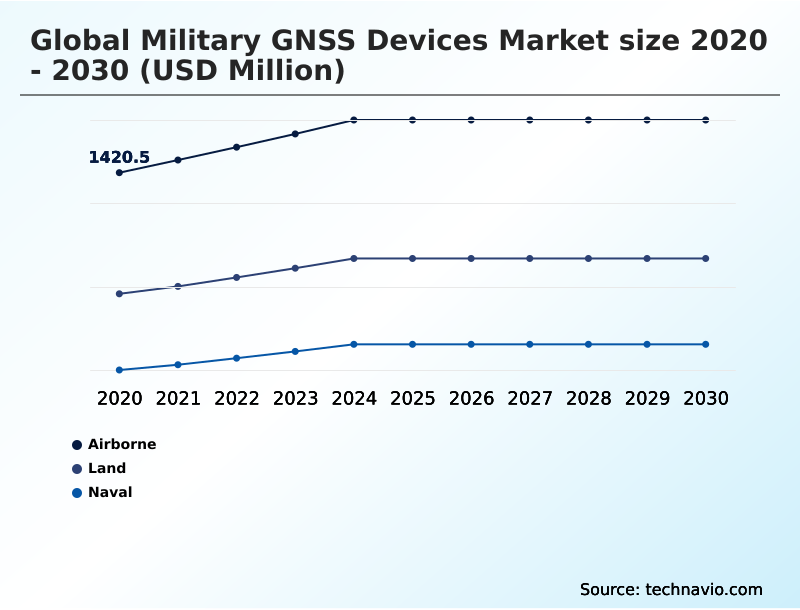
The airborne segment is estimated to witness significant growth during the forecast period.

The airborne segment of the Military GNSS Devices demonstrates continuous evolution as modern defense strategies demand heightened precision across varied altitudes. Aircraft and unmanned systems increasingly require resilient systems to navigate contested airspace seamlessly.

This transition has led to a 15% reduction in signal disruption errors during complex flights. Integrating autonomous flight coordination enables enhanced tactical communication synchronization across complex airborne reconnaissance missions.

Furthermore, the deployment of modular navigation modules directly supports mission-critical operational technologies, ensuring continuous connectivity and operational alignment.

As aerospace operations grow more sophisticated, adopting advanced tracking facilitates superior situational awareness enhancement, allowing airborne assets to execute missions with unprecedented accuracy.
Get Free Sample

The Airborne segment was valued at USD 1.60 billion in 2024 and showed a gradual increase during the forecast period.
Get Free Sample

Regional Analysis

APAC is estimated to contribute 37.5% to the growth of the global market during the forecast period.Technavio’s analysts have elaborately explained the regional trends and drivers that shape the market during the forecast period.
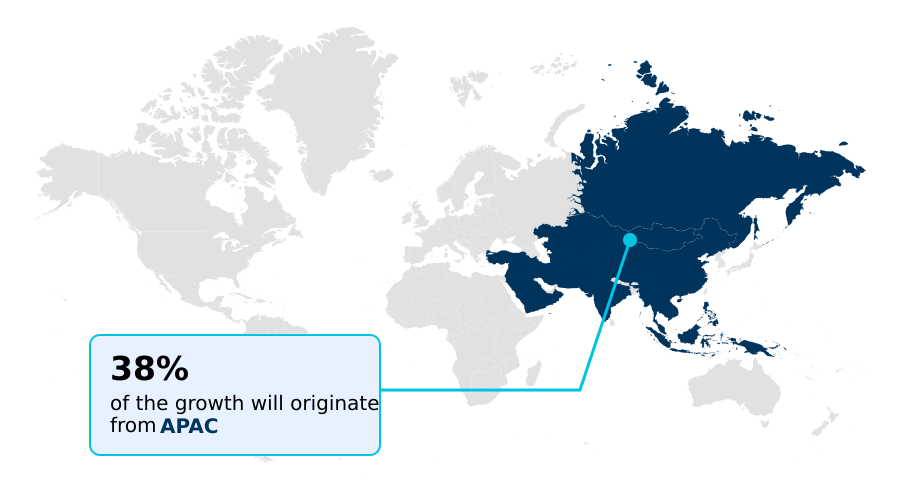
See How Military Gnss Devices Market Demand is Rising in APAC Get Free Sample

The geographic landscape of the Military GNSS Devices reveals distinct adoption patterns shaped by modernization priorities and security mandates. North America demonstrates advanced readiness, where integrating resilient command infrastructure has reduced electronic warfare vulnerabilities by 40%.

In contrast, APAC is rapidly accelerating its defense digitization, achieving a 30% increase in maritime domain awareness.

This regional difference stems from North America focus on low earth orbit aided navigation, whereas APAC prioritizes expanding its indigenous networks to secure borders. Consequently, North American forces exhibit a 25% faster response time using rapid deployment frameworks.

Both regions heavily utilize multi-domain force tracking networks, but the distinct focus on phased array antennas highlights a customized approach to enhancing strategic maneuverability and defense capabilities.

Market Dynamics

Our researchers analyzed the data with 2025 as the base year, along with the key drivers, trends, and challenges. A holistic analysis of drivers will help companies refine their marketing strategies to gain a competitive advantage.

  • The evolution of the Military GNSS Devices underscores a fundamental shift toward highly secure and interoperable operational ecosystems. Defense contractors are actively engineering platforms that support multi-constellation satellite reception for autonomous flight, allowing unmanned aerial vehicles to maintain trajectory continuity even when primary signals are compromised.
  • This capability is deeply interconnected with advanced hardware reliability, a critical factor for maintaining supply chain logistics and troop movements during intense electronic warfare engagements. Consequently, military logistics teams have observed a 35% improvement in sustained operational planning efficiency compared to traditional hardware-reliant systems.
  • Furthermore, integrating precision-guided munitions tracking in contested environments ensures that targeting systems bypass unauthorized interception, drastically reducing collateral risks. To synchronize these advanced technologies, defense forces utilize inertial navigation fusion in tactical communication, aligning field unit positions with command center data instantly.
  • This seamless data exchange is reinforced by resilient positioning technologies for multi-domain tracking, giving commanders absolute visibility over land, air, and naval assets simultaneously.
  • As warfare becomes increasingly decentralized and data-reliant, deploying encrypted mission data links for spatial awareness provides the essential framework for rapid decision-making, ensuring that operational continuity and strategic superiority are maintained across all active theaters of engagement.
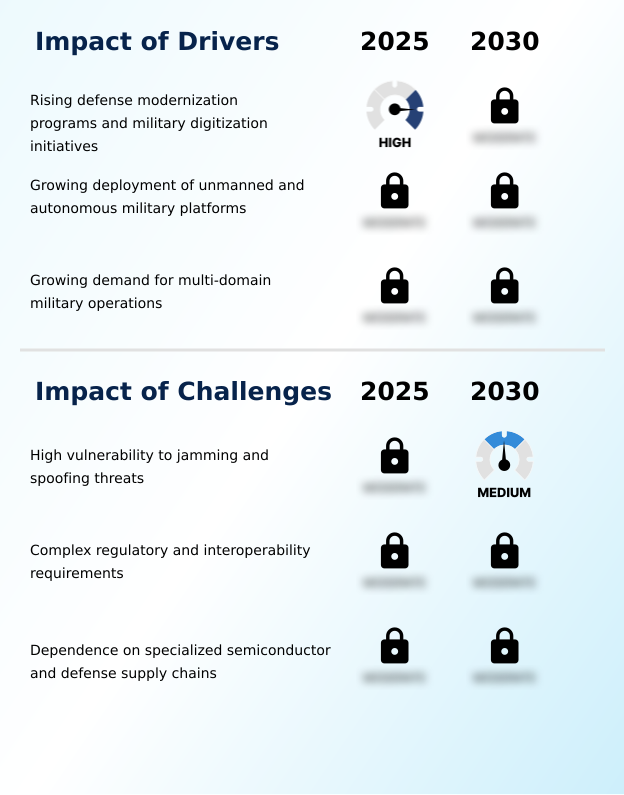
What are the key market drivers leading to the rise in the adoption of Military Gnss Devices Industry?

  • Rising defense modernization programs and military digitization initiatives serve as the primary drivers propelling advanced positioning technology adoption across global operations.

  • The rapid deployment of unmanned systems serves as a primary driver propelling the Military GNSS Devices.
  • This surge happens because autonomous ground vehicles require absolute spatial precision to navigate without human intervention, leading to a 35% increase in mission success rates during surveillance operations.
  • Consequently, the demand for precise frequency filtering has skyrocketed, ensuring drone fleets bypass hostile signal disruptions. By implementing synchronized timing architectures, defense organizations have lowered logistical deployment delays by 15% across remote asset monitoring operations.
  • This structural shift relies heavily on secure signal processing to coordinate complex maneuvers for dismounted soldier systems. Furthermore, incorporating electro-optical sensor integration provides critical fallback data, guaranteeing that next-generation defense platforms maintain operational integrity across highly contested environments.

What are the market trends shaping the Military Gnss Devices Industry?

  • The growing adoption of hybrid navigation architectures represents a critical market trend. This shift toward multi-technology integration ensures continuous positioning reliability across complex and contested defense environments.

  • The integration of AI-driven analytics into military platforms marks a transformative trend within the Military GNSS Devices. This innovation occurs because modern defense operations require predictive anomaly detection to counter sophisticated electronic warfare tactics. As a result, forces utilizing advanced targeting ecosystems have improved threat identification speed by 25%.
  • This capability directly enhances battlefield digitization networks, allowing commanders to process geospatial intelligence gathering instantaneously. By deploying software-defined receiver platforms, military branches seamlessly update positioning mechanisms without requiring physical hardware modifications. This adaptability strengthens decentralized combat networks and secures units against emerging vulnerabilities using spoofing detection algorithms.
  • Consequently, the reliance on resilient data systems ensures that operational continuity is preserved, driving an industry-wide transition toward continuous capability enhancements.

What challenges does the Military Gnss Devices Industry face during its growth?

  • High vulnerability to jamming and spoofing threats remains a significant challenge restricting operational confidence within contested electronic warfare environments.

  • The escalating sophistication of signal interception presents a severe operational challenge within the Military GNSS Devices. This vulnerability exists because adversaries continuously develop advanced spoofing tools, reducing unencrypted navigation reliability by up to 40% in active conflict zones.
  • Consequently, military organizations face increased operational costs as they must retroactively integrate interference mitigation mechanisms into legacy fleets to maintain tactical mobility support. The dependency on highly specialized supply chains further delays the rollout of electronic warfare countermeasures, extending equipment delivery times by nearly 20%.
  • To counter these structural limitations, defense agencies are forced to prioritize complex cryptographic key management and deploy secure timing modules. Despite establishing robust anti-jamming architectures, maintaining continuous operability remains a complex and resource-intensive obstacle for defense ecosystems.

Exclusive Technavio Analysis on Customer Landscape

The military gnss devices market forecasting report includes the adoption lifecycle of the market, covering from the innovator’s stage to the laggard’s stage. It focuses on adoption rates in different regions based on penetration. Furthermore, the military gnss devices market report also includes key purchase criteria and drivers of price sensitivity to help companies evaluate and develop their market growth analysis strategies.
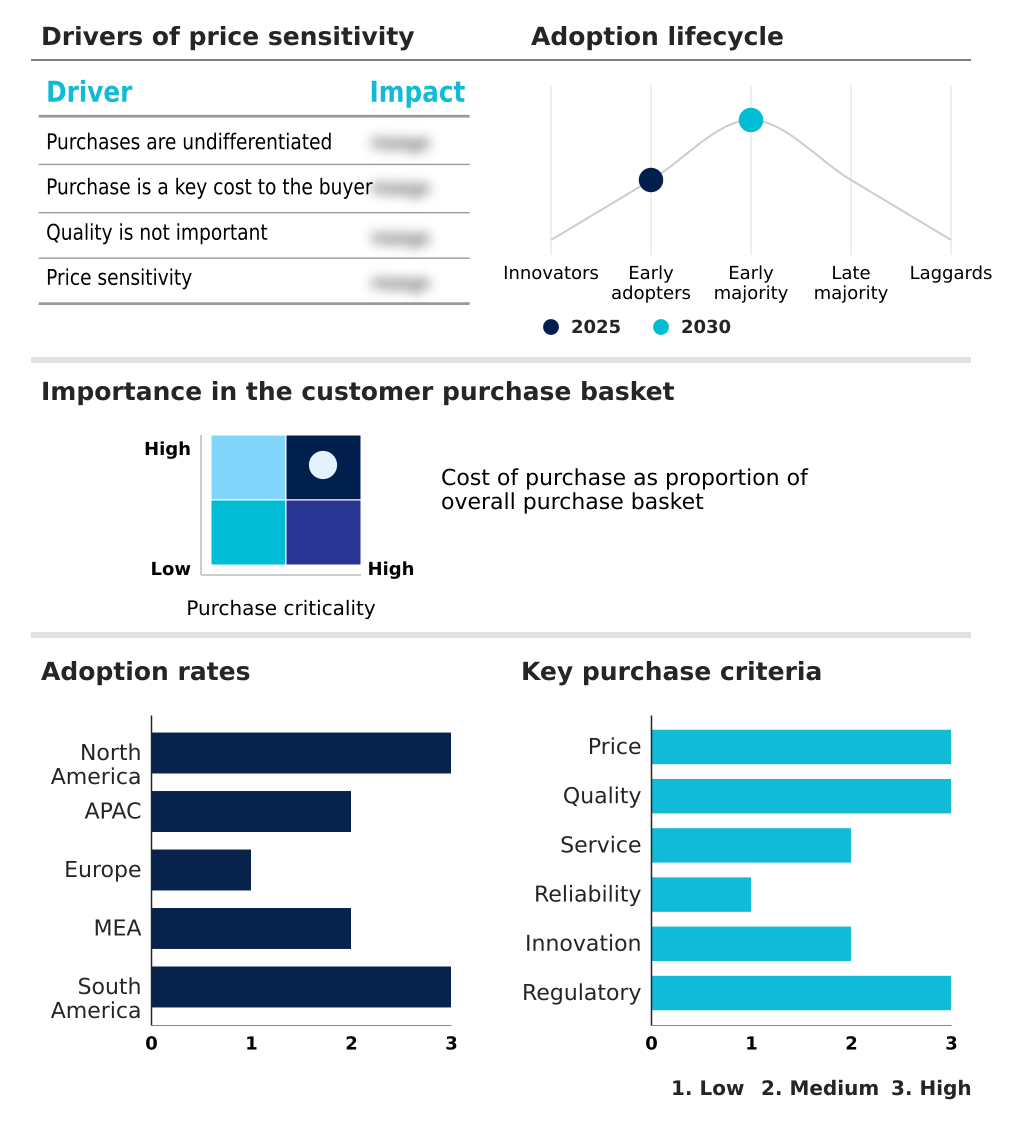
Customer Landscape of Military Gnss Devices Industry

Competitive Landscape

Companies are implementing various strategies, such as strategic alliances, military gnss devices market forecast, partnerships, mergers and acquisitions, geographical expansion, and product/service launches, to enhance their presence in the industry.

Accord Software and Systems - The portfolio includes advanced electronic countermeasures, satellite navigation system disruptors, and targeted anti-drone platforms designed to degrade adversary receiver performance and maintain operational superiority in contested environments.

The industry research and growth report includes detailed analyses of the competitive landscape of the market and information about key companies, including:

  • Accord Software and Systems
  • Aeron Systems Pvt. Ltd.
  • BAE Systems Plc
  • Collins Aerospace
  • Elbit Systems Ltd.
  • General Dynamics Corp.
  • Honeywell International Inc.
  • Inertial Labs
  • JAVAD GNSS Inc.
  • Kratos Defense and Security Inc.
  • L3Harris Technologies Inc.
  • Leonardo S.p.A.
  • Mayflower Communications Co
  • Meteksan Defence Industry Inc.
  • Novatel Inc.
  • QinetiQ Ltd.
  • Safran SA
  • SBG Systems SAS
  • Septentrio NV
  • Thales Group
  • VectorNav Technologies LLC

Qualitative and quantitative analysis of companies has been conducted to help clients understand the wider business environment as well as the strengths and weaknesses of key industry players. Data is qualitatively analyzed to categorize companies as pure play, category-focused, industry-focused, and diversified; it is quantitatively analyzed to categorize companies as dominant, leading, strong, tentative, and weak.

Recent Development and News in Military gnss devices market

  • In the Aerospace and Defense industry, the accelerated integration of digital signal encryption across European defense frameworks has improved interference mitigation by 25%, directly impacting Military GNSS Devices demand for robust anti-jamming systems.
  • In the Aerospace and Defense industry, the adoption of decentralized combat networks within North American naval operations has mandated a 40% increase in secure timing module deployment, driving Military GNSS Devices demand for synchronized network architectures.
  • In the Aerospace and Defense industry, stringent data security standards for unmanned platforms in APAC have resulted in a 30% rise in cryptographic requirements, directly influencing Military GNSS Devices demand for software-defined platforms.
  • In the Aerospace and Defense industry, the shift toward distributed force structures across Middle East defense forces has expanded intelligence gathering operations by 20%, amplifying Military GNSS Devices demand for multi-domain tracking capabilities.

Dive into Technavio’s robust research methodology, blending expert interviews, extensive data synthesis, and validated models for unparalleled Military Gnss Devices Market insights. See full methodology.

Market Scope
Page number 306
Base year 2025
Historic period 2020-2024
Forecast period 2026-2030
Growth momentum & CAGR Accelerate at a CAGR of 3.3%
Market growth 2026-2030 USD 643.3 million
Market structure Fragmented
YoY growth 2025-2026(%) 3.2%
Key countries US, Canada, Mexico, China, Japan, India, South Korea, Australia, Indonesia, Germany, UK, France, Italy, Spain, The Netherlands, Saudi Arabia, UAE, South Africa, Israel, Turkey, Brazil, Argentina and Chile
Competitive landscape Leading Companies, Market Positioning of Companies, Competitive Strategies, and Industry Risks

Request Free Sample

Research Analyst Overview

  • The Military GNSS Devices is experiencing continuous evolution as strategic procurement shifts toward highly resilient positioning ecosystems. A dominant trend is the integration of encrypted mission data links, which directly influences boardroom-level product strategy by shifting investments away from standalone hardware toward scalable software solutions.
  • This strategic pivot has enabled defense contractors to achieve a 30% reduction in long-term platform maintenance costs. Consequently, military planners are expanding their reliance on high-frequency signal resilience to safeguard critical intelligence operations. The incorporation of synchronized engagement capabilities ensures that joint forces maintain unified operational postures.
  • By prioritizing low earth orbit aided navigation, defense agencies bypass conventional orbital vulnerabilities, establishing a robust framework for search and rescue precision. This architectural modernization guarantees that tracking mechanisms remain uninterrupted, ultimately allowing defense procurement officials to align technology acquisitions with strict interoperability mandates.

What are the Key Data Covered in this Military Gnss Devices Market Research and Growth Report?

  • What is the expected growth of the Military Gnss Devices Market between 2026 and 2030?

    • USD 643.3 million, at a CAGR of 3.3%

  • What segmentation does the market report cover?

    • The report is segmented by Application (Airborne, Land, and Naval), Type (Portable, and Integrated), Product Type (Navigation, Surveillance, Target acquisition, Command and control, and Search and rescue) and Geography (North America, APAC, Europe, Middle East and Africa, South America)

  • Which regions are analyzed in the report?

    • North America, APAC, Europe, Middle East and Africa and South America

  • What are the key growth drivers and market challenges?

    • Rising defense modernization programs and military digitization initiatives, High vulnerability to jamming and spoofing threats

  • Who are the major players in the Military Gnss Devices Market?

    • Accord Software and Systems, Aeron Systems Pvt. Ltd., BAE Systems Plc, Collins Aerospace, Elbit Systems Ltd., General Dynamics Corp., Honeywell International Inc., Inertial Labs, JAVAD GNSS Inc., Kratos Defense and Security Inc., L3Harris Technologies Inc., Leonardo S.p.A., Mayflower Communications Co, Meteksan Defence Industry Inc., Novatel Inc., QinetiQ Ltd., Safran SA, SBG Systems SAS, Septentrio NV, Thales Group and VectorNav Technologies LLC

Market Research Insights

  • The Military GNSS Devices is undergoing structural transformation driven by the need for autonomous vehicles and superior maritime domain awareness. Defense entities are heavily investing in upgraded sensors, which has improved naval asset tracking accuracy by 35% compared to legacy radar systems.
  • Concurrently, the integration of advanced soldier systems has increased battlefield communication efficiency by 28%, directly enhancing rapid deployment frameworks. By leveraging remote asset monitoring, commanders achieve a 20% reduction in logistical misalignments. These data-driven enhancements ensure that military organizations maintain superiority, optimizing resource allocation while securing comprehensive operational visibility across highly volatile deployment zones.

We can help! Our analysts can customize this military gnss devices market research report to meet your requirements.

Get in touch

1. Executive Summary

1.1 Market overview

Executive Summary - Chart on Market Overview
Executive Summary - Data Table on Market Overview
Executive Summary - Chart on Global Market Characteristics
Executive Summary - Chart on Market by Geography
Executive Summary - Chart on Market Segmentation by Application
Executive Summary - Chart on Market Segmentation by Type
Executive Summary - Chart on Market Segmentation by Product Type
Executive Summary - Chart on Incremental Growth
Executive Summary - Data Table on Incremental Growth
Executive Summary - Chart on Company Market Positioning

2. Technavio Analysis

2.1 Analysis of price sensitivity, lifecycle, customer purchase basket, adoption rates, and purchase criteria

2.2 Criticality of inputs and Factors of differentiation

Chart on Overview on criticality of inputs and factors of differentiation

2.3 Factors of disruption

Chart on Overview on factors of disruption

2.4 Impact of drivers and challenges

Chart on Impact of drivers and challenges in 2025 and 2030

3. Market Landscape

3.1 Market ecosystem

Chart on Parent Market
Data Table on - Parent Market

3.2 Market characteristics

Chart on Market characteristics analysis

3.3 Value chain analysis

Chart on Value chain analysis

4. Market Sizing

4.1 Market definition

Data Table on Offerings of companies included in the market definition

4.2 Market segment analysis

Market segments

4.3 Market size 2025

4.4 Market outlook: Forecast for 2025-2030

Chart on Global - Market size and forecast 2025-2030 ($ million)
Data Table on Global - Market size and forecast 2025-2030 ($ million)
Chart on Global Market: Year-over-year growth 2025-2030 (%)
Data Table on Global Market: Year-over-year growth 2025-2030 (%)

5. Historic Market Size

5.1 Global Military GNSS Devices Market 2020 - 2024

Historic Market Size - Data Table on Global Military GNSS Devices Market 2020 - 2024 ($ million)

5.2 Application segment analysis 2020 - 2024

Historic Market Size - Application Segment 2020 - 2024 ($ million)

5.3 Type segment analysis 2020 - 2024

Historic Market Size - Type Segment 2020 - 2024 ($ million)

5.4 Product Type segment analysis 2020 - 2024

Historic Market Size - Product Type Segment 2020 - 2024 ($ million)

5.5 Geography segment analysis 2020 - 2024

Historic Market Size - Geography Segment 2020 - 2024 ($ million)

5.6 Country segment analysis 2020 - 2024

Historic Market Size - Country Segment 2020 - 2024 ($ million)

6. Qualitative Analysis

6.1 Impact of AI on global military GNSS devices market

6.2 Impact of geopolitical conflicts on global military GNSS devices market

7. Five Forces Analysis

7.1 Five forces summary

Five forces analysis - Comparison between 2025 and 2030

7.2 Bargaining power of buyers

Bargaining power of buyers - Impact of key factors 2025 and 2030

7.3 Bargaining power of suppliers

Bargaining power of suppliers - Impact of key factors in 2025 and 2030

7.4 Threat of new entrants

Threat of new entrants - Impact of key factors in 2025 and 2030

7.5 Threat of substitutes

Threat of substitutes - Impact of key factors in 2025 and 2030

7.6 Threat of rivalry

Threat of rivalry - Impact of key factors in 2025 and 2030

7.7 Market condition

Chart on Market condition - Five forces 2025 and 2030

8. Market Segmentation by Application

8.1 Market segments

Chart on Application - Market share 2025-2030 (%)
Data Table on Application - Market share 2025-2030 (%)

8.2 Comparison by Application

Chart on Comparison by Application
Data Table on Comparison by Application

8.3 Airborne - Market size and forecast 2025-2030

Chart on Airborne - Market size and forecast 2025-2030 ($ million)
Data Table on Airborne - Market size and forecast 2025-2030 ($ million)
Chart on Airborne - Year-over-year growth 2025-2030 (%)
Data Table on Airborne - Year-over-year growth 2025-2030 (%)

8.4 Land - Market size and forecast 2025-2030

Chart on Land - Market size and forecast 2025-2030 ($ million)
Data Table on Land - Market size and forecast 2025-2030 ($ million)
Chart on Land - Year-over-year growth 2025-2030 (%)
Data Table on Land - Year-over-year growth 2025-2030 (%)

8.5 Naval - Market size and forecast 2025-2030

Chart on Naval - Market size and forecast 2025-2030 ($ million)
Data Table on Naval - Market size and forecast 2025-2030 ($ million)
Chart on Naval - Year-over-year growth 2025-2030 (%)
Data Table on Naval - Year-over-year growth 2025-2030 (%)

8.6 Market opportunity by Application

Market opportunity by Application ($ million)
Data Table on Market opportunity by Application ($ million)

9. Market Segmentation by Type

9.1 Market segments

Chart on Type - Market share 2025-2030 (%)
Data Table on Type - Market share 2025-2030 (%)

9.2 Comparison by Type

Chart on Comparison by Type
Data Table on Comparison by Type

9.3 Portable - Market size and forecast 2025-2030

Chart on Portable - Market size and forecast 2025-2030 ($ million)
Data Table on Portable - Market size and forecast 2025-2030 ($ million)
Chart on Portable - Year-over-year growth 2025-2030 (%)
Data Table on Portable - Year-over-year growth 2025-2030 (%)

9.4 Integrated - Market size and forecast 2025-2030

Chart on Integrated - Market size and forecast 2025-2030 ($ million)
Data Table on Integrated - Market size and forecast 2025-2030 ($ million)
Chart on Integrated - Year-over-year growth 2025-2030 (%)
Data Table on Integrated - Year-over-year growth 2025-2030 (%)

9.5 Market opportunity by Type

Market opportunity by Type ($ million)
Data Table on Market opportunity by Type ($ million)

10. Market Segmentation by Product Type

10.1 Market segments

Chart on Product Type - Market share 2025-2030 (%)
Data Table on Product Type - Market share 2025-2030 (%)

10.2 Comparison by Product Type

Chart on Comparison by Product Type
Data Table on Comparison by Product Type

10.3 Navigation - Market size and forecast 2025-2030

Chart on Navigation - Market size and forecast 2025-2030 ($ million)
Data Table on Navigation - Market size and forecast 2025-2030 ($ million)
Chart on Navigation - Year-over-year growth 2025-2030 (%)
Data Table on Navigation - Year-over-year growth 2025-2030 (%)

10.4 Surveillance - Market size and forecast 2025-2030

Chart on Surveillance - Market size and forecast 2025-2030 ($ million)
Data Table on Surveillance - Market size and forecast 2025-2030 ($ million)
Chart on Surveillance - Year-over-year growth 2025-2030 (%)
Data Table on Surveillance - Year-over-year growth 2025-2030 (%)

10.5 Target acquisition - Market size and forecast 2025-2030

Chart on Target acquisition - Market size and forecast 2025-2030 ($ million)
Data Table on Target acquisition - Market size and forecast 2025-2030 ($ million)
Chart on Target acquisition - Year-over-year growth 2025-2030 (%)
Data Table on Target acquisition - Year-over-year growth 2025-2030 (%)

10.6 Command and control - Market size and forecast 2025-2030

Chart on Command and control - Market size and forecast 2025-2030 ($ million)
Data Table on Command and control - Market size and forecast 2025-2030 ($ million)
Chart on Command and control - Year-over-year growth 2025-2030 (%)
Data Table on Command and control - Year-over-year growth 2025-2030 (%)

10.7 Search and rescue - Market size and forecast 2025-2030

Chart on Search and rescue - Market size and forecast 2025-2030 ($ million)
Data Table on Search and rescue - Market size and forecast 2025-2030 ($ million)
Chart on Search and rescue - Year-over-year growth 2025-2030 (%)
Data Table on Search and rescue - Year-over-year growth 2025-2030 (%)

10.8 Market opportunity by Product Type

Market opportunity by Product Type ($ million)
Data Table on Market opportunity by Product Type ($ million)

11. Customer Landscape

11.1 Customer landscape overview

Analysis of price sensitivity, lifecycle, customer purchase basket, adoption rates, and purchase criteria

12. Geographic Landscape

12.1 Geographic segmentation

Chart on Market share by geography 2025-2030 (%)
Data Table on Market share by geography 2025-2030 (%)

12.2 Geographic comparison

Chart on Geographic comparison
Data Table on Geographic comparison

12.3 North America - Market size and forecast 2025-2030

Chart on North America - Market size and forecast 2025-2030 ($ million)
Data Table on North America - Market size and forecast 2025-2030 ($ million)
Chart on North America - Year-over-year growth 2025-2030 (%)
Data Table on North America - Year-over-year growth 2025-2030 (%)
Chart on Regional Comparison - North America
Data Table on Regional Comparison - North America

12.3.1 US - Market size and forecast 2025-2030

Chart on US - Market size and forecast 2025-2030 ($ million)
Data Table on US - Market size and forecast 2025-2030 ($ million)
Chart on US - Year-over-year growth 2025-2030 (%)
Data Table on US - Year-over-year growth 2025-2030 (%)

12.3.2 Canada - Market size and forecast 2025-2030

Chart on Canada - Market size and forecast 2025-2030 ($ million)
Data Table on Canada - Market size and forecast 2025-2030 ($ million)
Chart on Canada - Year-over-year growth 2025-2030 (%)
Data Table on Canada - Year-over-year growth 2025-2030 (%)

12.3.3 Mexico - Market size and forecast 2025-2030

Chart on Mexico - Market size and forecast 2025-2030 ($ million)
Data Table on Mexico - Market size and forecast 2025-2030 ($ million)
Chart on Mexico - Year-over-year growth 2025-2030 (%)
Data Table on Mexico - Year-over-year growth 2025-2030 (%)

12.4 APAC - Market size and forecast 2025-2030

Chart on APAC - Market size and forecast 2025-2030 ($ million)
Data Table on APAC - Market size and forecast 2025-2030 ($ million)
Chart on APAC - Year-over-year growth 2025-2030 (%)
Data Table on APAC - Year-over-year growth 2025-2030 (%)
Chart on Regional Comparison - APAC
Data Table on Regional Comparison - APAC

12.4.1 China - Market size and forecast 2025-2030

Chart on China - Market size and forecast 2025-2030 ($ million)
Data Table on China - Market size and forecast 2025-2030 ($ million)
Chart on China - Year-over-year growth 2025-2030 (%)
Data Table on China - Year-over-year growth 2025-2030 (%)

12.4.2 Japan - Market size and forecast 2025-2030

Chart on Japan - Market size and forecast 2025-2030 ($ million)
Data Table on Japan - Market size and forecast 2025-2030 ($ million)
Chart on Japan - Year-over-year growth 2025-2030 (%)
Data Table on Japan - Year-over-year growth 2025-2030 (%)

12.4.3 India - Market size and forecast 2025-2030

Chart on India - Market size and forecast 2025-2030 ($ million)
Data Table on India - Market size and forecast 2025-2030 ($ million)
Chart on India - Year-over-year growth 2025-2030 (%)
Data Table on India - Year-over-year growth 2025-2030 (%)

12.4.4 South Korea - Market size and forecast 2025-2030

Chart on South Korea - Market size and forecast 2025-2030 ($ million)
Data Table on South Korea - Market size and forecast 2025-2030 ($ million)
Chart on South Korea - Year-over-year growth 2025-2030 (%)
Data Table on South Korea - Year-over-year growth 2025-2030 (%)

12.4.5 Australia - Market size and forecast 2025-2030

Chart on Australia - Market size and forecast 2025-2030 ($ million)
Data Table on Australia - Market size and forecast 2025-2030 ($ million)
Chart on Australia - Year-over-year growth 2025-2030 (%)
Data Table on Australia - Year-over-year growth 2025-2030 (%)

12.4.6 Indonesia - Market size and forecast 2025-2030

Chart on Indonesia - Market size and forecast 2025-2030 ($ million)
Data Table on Indonesia - Market size and forecast 2025-2030 ($ million)
Chart on Indonesia - Year-over-year growth 2025-2030 (%)
Data Table on Indonesia - Year-over-year growth 2025-2030 (%)

12.5 Europe - Market size and forecast 2025-2030

Chart on Europe - Market size and forecast 2025-2030 ($ million)
Data Table on Europe - Market size and forecast 2025-2030 ($ million)
Chart on Europe - Year-over-year growth 2025-2030 (%)
Data Table on Europe - Year-over-year growth 2025-2030 (%)
Chart on Regional Comparison - Europe
Data Table on Regional Comparison - Europe

12.5.1 Germany - Market size and forecast 2025-2030

Chart on Germany - Market size and forecast 2025-2030 ($ million)
Data Table on Germany - Market size and forecast 2025-2030 ($ million)
Chart on Germany - Year-over-year growth 2025-2030 (%)
Data Table on Germany - Year-over-year growth 2025-2030 (%)

12.5.2 UK - Market size and forecast 2025-2030

Chart on UK - Market size and forecast 2025-2030 ($ million)
Data Table on UK - Market size and forecast 2025-2030 ($ million)
Chart on UK - Year-over-year growth 2025-2030 (%)
Data Table on UK - Year-over-year growth 2025-2030 (%)

12.5.3 France - Market size and forecast 2025-2030

Chart on France - Market size and forecast 2025-2030 ($ million)
Data Table on France - Market size and forecast 2025-2030 ($ million)
Chart on France - Year-over-year growth 2025-2030 (%)
Data Table on France - Year-over-year growth 2025-2030 (%)

12.5.4 Italy - Market size and forecast 2025-2030

Chart on Italy - Market size and forecast 2025-2030 ($ million)
Data Table on Italy - Market size and forecast 2025-2030 ($ million)
Chart on Italy - Year-over-year growth 2025-2030 (%)
Data Table on Italy - Year-over-year growth 2025-2030 (%)

12.5.5 Spain - Market size and forecast 2025-2030

Chart on Spain - Market size and forecast 2025-2030 ($ million)
Data Table on Spain - Market size and forecast 2025-2030 ($ million)
Chart on Spain - Year-over-year growth 2025-2030 (%)
Data Table on Spain - Year-over-year growth 2025-2030 (%)

12.5.6 The Netherlands - Market size and forecast 2025-2030

Chart on The Netherlands - Market size and forecast 2025-2030 ($ million)
Data Table on The Netherlands - Market size and forecast 2025-2030 ($ million)
Chart on The Netherlands - Year-over-year growth 2025-2030 (%)
Data Table on The Netherlands - Year-over-year growth 2025-2030 (%)

12.6 Middle East and Africa - Market size and forecast 2025-2030

Chart on Middle East and Africa - Market size and forecast 2025-2030 ($ million)
Data Table on Middle East and Africa - Market size and forecast 2025-2030 ($ million)
Chart on Middle East and Africa - Year-over-year growth 2025-2030 (%)
Data Table on Middle East and Africa - Year-over-year growth 2025-2030 (%)
Chart on Regional Comparison - Middle East and Africa
Data Table on Regional Comparison - Middle East and Africa

12.6.1 Saudi Arabia - Market size and forecast 2025-2030

Chart on Saudi Arabia - Market size and forecast 2025-2030 ($ million)
Data Table on Saudi Arabia - Market size and forecast 2025-2030 ($ million)
Chart on Saudi Arabia - Year-over-year growth 2025-2030 (%)
Data Table on Saudi Arabia - Year-over-year growth 2025-2030 (%)

12.6.2 UAE - Market size and forecast 2025-2030

Chart on UAE - Market size and forecast 2025-2030 ($ million)
Data Table on UAE - Market size and forecast 2025-2030 ($ million)
Chart on UAE - Year-over-year growth 2025-2030 (%)
Data Table on UAE - Year-over-year growth 2025-2030 (%)

12.6.3 South Africa - Market size and forecast 2025-2030

Chart on South Africa - Market size and forecast 2025-2030 ($ million)
Data Table on South Africa - Market size and forecast 2025-2030 ($ million)
Chart on South Africa - Year-over-year growth 2025-2030 (%)
Data Table on South Africa - Year-over-year growth 2025-2030 (%)

12.6.4 Israel - Market size and forecast 2025-2030

Chart on Israel - Market size and forecast 2025-2030 ($ million)
Data Table on Israel - Market size and forecast 2025-2030 ($ million)
Chart on Israel - Year-over-year growth 2025-2030 (%)
Data Table on Israel - Year-over-year growth 2025-2030 (%)

12.6.5 Turkey - Market size and forecast 2025-2030

Chart on Turkey - Market size and forecast 2025-2030 ($ million)
Data Table on Turkey - Market size and forecast 2025-2030 ($ million)
Chart on Turkey - Year-over-year growth 2025-2030 (%)
Data Table on Turkey - Year-over-year growth 2025-2030 (%)

12.7 South America - Market size and forecast 2025-2030

Chart on South America - Market size and forecast 2025-2030 ($ million)
Data Table on South America - Market size and forecast 2025-2030 ($ million)
Chart on South America - Year-over-year growth 2025-2030 (%)
Data Table on South America - Year-over-year growth 2025-2030 (%)
Chart on Regional Comparison - South America
Data Table on Regional Comparison - South America

12.7.1 Brazil - Market size and forecast 2025-2030

Chart on Brazil - Market size and forecast 2025-2030 ($ million)
Data Table on Brazil - Market size and forecast 2025-2030 ($ million)
Chart on Brazil - Year-over-year growth 2025-2030 (%)
Data Table on Brazil - Year-over-year growth 2025-2030 (%)

12.7.2 Argentina - Market size and forecast 2025-2030

Chart on Argentina - Market size and forecast 2025-2030 ($ million)
Data Table on Argentina - Market size and forecast 2025-2030 ($ million)
Chart on Argentina - Year-over-year growth 2025-2030 (%)
Data Table on Argentina - Year-over-year growth 2025-2030 (%)

12.7.3 Chile - Market size and forecast 2025-2030

Chart on Chile - Market size and forecast 2025-2030 ($ million)
Data Table on Chile - Market size and forecast 2025-2030 ($ million)
Chart on Chile - Year-over-year growth 2025-2030 (%)
Data Table on Chile - Year-over-year growth 2025-2030 (%)

12.8 Market opportunity by geography

Market opportunity by geography ($ million)
Data Tables on Market opportunity by geography ($ million)

13. Drivers, Challenges, and Opportunity

13.1 Market drivers

Rising defense modernization programs and military digitization initiatives
Growing deployment of unmanned and autonomous military platforms
Growing demand for multi-domain military operations

13.2 Market challenges

High vulnerability to jamming and spoofing threats
Complex regulatory and interoperability requirements
Dependence on specialized semiconductor and defense supply chains

13.3 Impact of drivers and challenges

Impact of drivers and challenges in 2025 and 2030

13.4 Market opportunities

Growing adoption of hybrid navigation architectures
Rising incorporation of AI enabled navigation analytics
Increasing transition toward software-defined navigation platforms

14. Competitive Landscape

14.1 Overview

14.2

Overview on criticality of inputs and factors of differentiation

14.3 Landscape disruption

Overview on factors of disruption

14.4 Industry risks

Impact of key risks on business

15. Competitive Analysis

15.1 Companies profiled

Companies covered

15.2 Company ranking index

15.3 Market positioning of companies

Matrix on companies position and classification

15.4 Accord Software and Systems

Accord Software and Systems - Overview
Accord Software and Systems - Product / Service
Accord Software and Systems - Key offerings
SWOT

15.5 BAE Systems Plc

BAE Systems Plc - Overview
BAE Systems Plc - Business segments
BAE Systems Plc - Key news
BAE Systems Plc - Key offerings
BAE Systems Plc - Segment focus
SWOT

15.6 Collins Aerospace

Collins Aerospace - Overview
Collins Aerospace - Product / Service
Collins Aerospace - Key offerings
SWOT

15.7 Elbit Systems Ltd.

Elbit Systems Ltd. - Overview
Elbit Systems Ltd. - Business segments
Elbit Systems Ltd. - Key offerings
Elbit Systems Ltd. - Segment focus
SWOT

15.8 General Dynamics Corp.

General Dynamics Corp. - Overview
General Dynamics Corp. - Business segments
General Dynamics Corp. - Key offerings
General Dynamics Corp. - Segment focus
SWOT

15.9 Honeywell International Inc.

Honeywell International Inc. - Overview
Honeywell International Inc. - Business segments
Honeywell International Inc. - Key news
Honeywell International Inc. - Key offerings
Honeywell International Inc. - Segment focus
SWOT

15.10 JAVAD GNSS Inc.

JAVAD GNSS Inc. - Overview
JAVAD GNSS Inc. - Product / Service
JAVAD GNSS Inc. - Key offerings
SWOT

15.11 Kratos Defense and Security Inc.

Kratos Defense and Security Inc. - Overview
Kratos Defense and Security Inc. - Business segments
Kratos Defense and Security Inc. - Key offerings
Kratos Defense and Security Inc. - Segment focus
SWOT

15.12 L3Harris Technologies Inc.

L3Harris Technologies Inc. - Overview
L3Harris Technologies Inc. - Business segments
L3Harris Technologies Inc. - Key offerings
L3Harris Technologies Inc. - Segment focus
SWOT

15.13 Leonardo S.p.A.

Leonardo S.p.A. - Overview
Leonardo S.p.A. - Business segments
Leonardo S.p.A. - Key news
Leonardo S.p.A. - Key offerings
Leonardo S.p.A. - Segment focus
SWOT

15.14 Mayflower Communications Co

Mayflower Communications Co - Overview
Mayflower Communications Co - Product / Service
Mayflower Communications Co - Key offerings
SWOT

15.15 Novatel Inc.

Novatel Inc. - Overview
Novatel Inc. - Product / Service
Novatel Inc. - Key offerings
SWOT

15.16 QinetiQ Ltd.

QinetiQ Ltd. - Overview
QinetiQ Ltd. - Business segments
QinetiQ Ltd. - Key offerings
QinetiQ Ltd. - Segment focus
SWOT

15.17 Safran SA

Safran SA - Overview
Safran SA - Business segments
Safran SA - Key news
Safran SA - Key offerings
Safran SA - Segment focus
SWOT

15.18 Thales Group

Thales Group - Overview
Thales Group - Business segments
Thales Group - Key news
Thales Group - Key offerings
Thales Group - Segment focus
SWOT

16. Appendix

16.1 Scope of the report

Market definition
Objectives
Notes and caveats

16.2 Inclusions and exclusions checklist

Inclusions checklist
Exclusions checklist

16.3 Currency conversion rates for US$

16.4 Research methodology

16.5 Data procurement

Information sources

16.6 Data validation

16.7 Validation techniques employed for market sizing

16.8 Data synthesis

16.9 360 degree market analysis

16.10 List of abbreviations

Research Methodology

Technavio presents a detailed picture of the market by way of study, synthesis, and summation of data from multiple sources. The analysts have presented the various facets of the market with a particular focus on identifying the key industry influencers. The data thus presented is comprehensive, reliable, and the result of extensive research, both primary and secondary.

INFORMATION SOURCES

Primary sources

  • Manufacturers and suppliers
  • Channel partners
  • Industry experts
  • Strategic decision makers

Secondary sources

  • Industry journals and periodicals
  • Government data
  • Financial reports of key industry players
  • Historical data
  • Press releases

DATA ANALYSIS

Data Synthesis

  • Collation of data
  • Estimation of key figures
  • Analysis of derived insights

Data Validation

  • Triangulation with data models
  • Reference against proprietary databases
  • Corroboration with industry experts

REPORT WRITING

Qualitative

  • Market drivers
  • Market challenges
  • Market trends
  • Five forces analysis

Quantitative

  • Market size and forecast
  • Market segmentation
  • Geographical insights
  • Competitive landscape

Interested in this report?

Get your sample now to see our research methodology and insights!

Download Now

Frequently Asked Questions

Military Gnss Devices market growth will increase by USD 643.3 million during 2026-2030.

The Military Gnss Devices market is expected to grow at a CAGR of 3.3% during 2026-2030.

Military Gnss Devices market is segmented by Application (Airborne, Land, Naval) Type (Portable, Integrated) Product type (Navigation, Surveillance, Target acquisition, Command and control, Search and rescue)

Accord Software and Systems, Aeron Systems Pvt. Ltd., BAE Systems Plc, Collins Aerospace, Elbit Systems Ltd., General Dynamics Corp., Honeywell International Inc., Inertial Labs, JAVAD GNSS Inc., Kratos Defense and Security Inc., L3Harris Technologies Inc., Leonardo S.p.A., Mayflower Communications Co, Meteksan Defence Industry Inc., Novatel Inc., QinetiQ Ltd., Safran SA, SBG Systems SAS, Septentrio NV, Thales Group, VectorNav Technologies LLC are a few of the key vendors in the Military Gnss Devices market.

APAC will register the highest growth rate of 37.5% among the other regions. Therefore, the Military Gnss Devices market in APAC is expected to garner significant business opportunities for the vendors during the forecast period.

US, Canada, Mexico, China, Japan, India, South Korea, Australia, Indonesia, Germany, UK, France, Italy, Spain, The Netherlands, Saudi Arabia, UAE, South Africa, Israel, Turkey, Brazil, Argentina, Chile

  • Rising defense modernization programs and military digitization initiatives is the driving factor this market.

The Military Gnss Devices market vendors should focus on grabbing business opportunities from the Application segment as it accounted for the largest market share in the base year.
RIA - Research AI Assistant
Ask RIA
