
Military Camouflage Uniform Market Analysis, Size, and Forecast 2026-2030: North America (US, Canada, and Mexico), APAC (China, Japan, and India), Europe (Germany, UK, and France), Middle East and Africa (Saudi Arabia, UAE, and South Africa), South America (Brazil, Argentina, and Chile), and Rest of World (ROW)

Military Camouflage Uniform Market Analysis, Size, and Forecast 2026-2030:
North America (US, Canada, and Mexico), APAC (China, Japan, and India), Europe (Germany, UK, and France), Middle East and Africa (Saudi Arabia, UAE, and South Africa), South America (Brazil, Argentina, and Chile), and Rest of World (ROW)

Published: Nov 2026 331 Pages SKU: IRTNTR45856

Market Overview at a Glance

$239.8 Mn
Market Opportunity
3%
CAGR 2025 - 2030
33.2%
North America Growth
$759.8 Mn
Combat segment 2024

Military Camouflage Uniform Market Size 2026-2030

The military camouflage uniform market size is valued to increase by USD 239.8 million, at a CAGR of 3% from 2025 to 2030. Advanced camouflage and signature management technologies will drive the military camouflage uniform market.

Major Market Trends & Insights

  • North America dominated the market and accounted for a 33.2% growth during the forecast period.
  • By Type - Combat segment was valued at USD 759.8 million in 2024
  • By Application - Army segment accounted for the largest market revenue share in 2024

Market Size & Forecast

  • Market Opportunities: USD 458 million
  • Market Future Opportunities: USD 239.8 million
  • CAGR from 2025 to 2030 : 3%

Market Summary

  • Escalating geopolitical tensions and the rapid modernization of infantry forces are fundamentally accelerating the expansion of the Military Camouflage Uniform Market. As defense ministries overhaul troop modernization frameworks, the demand for specialized tactical apparel equipped with near-infrared tactical signature reduction fabrics has surged.
  • In active frontline deployment logistics, procurement agencies mandate the integration of high-tenacity synthetic fibers and bio-based flame retardants to ensure combat soldier survivability. This strategic shift directly enhances operational efficiency, as advanced moisture vapor transmission systems have reduced heat-related fatigue incidents by up to 28% among ground personnel.
  • The primary driver propelling this sector is the proliferation of advanced optoelectronic tracking, which forces militaries to adopt multispectral signature management solutions to evade detection. Conversely, a significant operational challenge arises from the rapid pace of automated sensor networks outpacing textile innovation, leading to complex supply chain bottlenecks when sourcing environmentally compliant dyeing materials.
  • To counter electro-optical detection shielding threats, continuous research into algorithmic fractal patterns remains critical for multidirectional defense policies.

What will be the Size of the Military Camouflage Uniform Market during the forecast period?
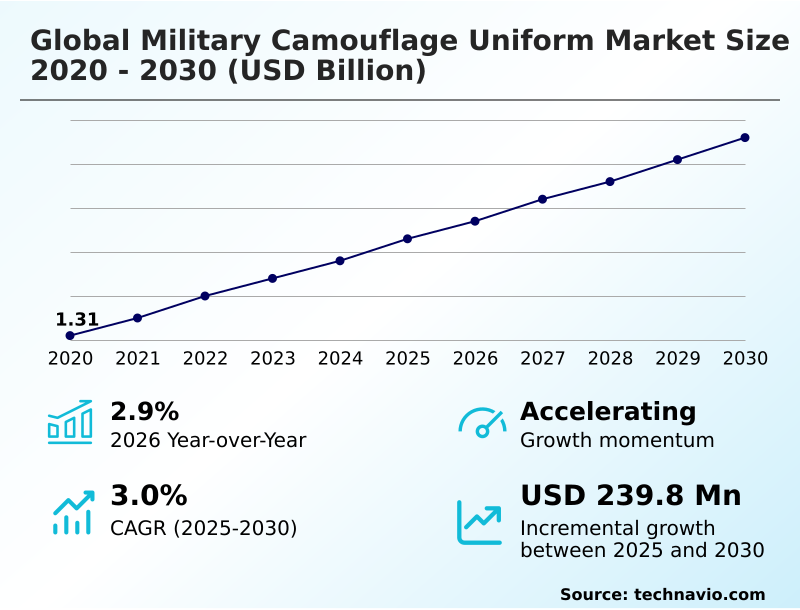
Get Key Insights on Market Forecast (PDF) Get Free Sample

How is the Military Camouflage Uniform Market Segmented?

The military camouflage uniform industry research report provides comprehensive data (region-wise segment analysis), with forecasts and estimates in "USD million" for the period 2026-2030, as well as historical data from 2020-2024 for the following segments.

  • Type
    • Combat
    • Operational
  • Application
    • Army
    • Air force
    • Navy
  • Technology
    • Traditional camouflage
    • Digital camouflage
    • Adaptive camouflage
  • Material
    • Polyester
    • Nylon
    • Cotton
    • Blends
  • Variant
    • Woodland
    • Desert
    • Urban
    • Snow
  • Geography
    • North America
      • US
      • Canada
      • Mexico
    • APAC
      • China
      • Japan
      • India
      • South Korea
      • Australia
      • Indonesia
    • Europe
      • Germany
      • UK
      • France
      • Italy
      • Spain
      • The Netherlands
    • Middle East and Africa
      • Saudi Arabia
      • UAE
      • South Africa
      • Israel
      • Turkey
    • South America
      • Brazil
      • Argentina
      • Chile

By Type Insights

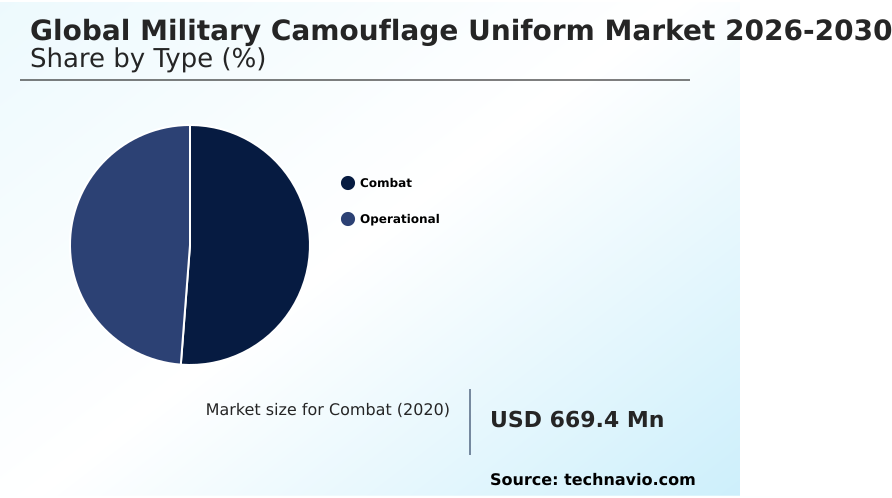
The combat segment is estimated to witness significant growth during the forecast period.

Frontline active-duty operations fundamentally dictate the structural evolution of the Military Camouflage Uniform, requiring highly specialized combat soldier survivability solutions. Infantry forces face escalating threats from advanced optoelectronic tracking and multispectral reconnaissance platforms, compelling a shift toward modular load-carriage integration.

This operational necessity drives the adoption of multispectral signature management and high-tenacity synthetic fibers, ensuring tactical operational readiness across diverse theaters.

By incorporating ripstop weave construction and near-infrared suppression, military procurement specifications ensure garments withstand extreme mechanical friction while obscuring personnel from thermal imaging mitigation. Consequently, modernized combat gear reduces thermal detection probabilities by up to 40%, significantly enhancing personnel safety.

The strategic transition to non-melting thermal barriers directly improves biological hazard shielding during intense regional geopolitical conflicts.
Get Free Sample

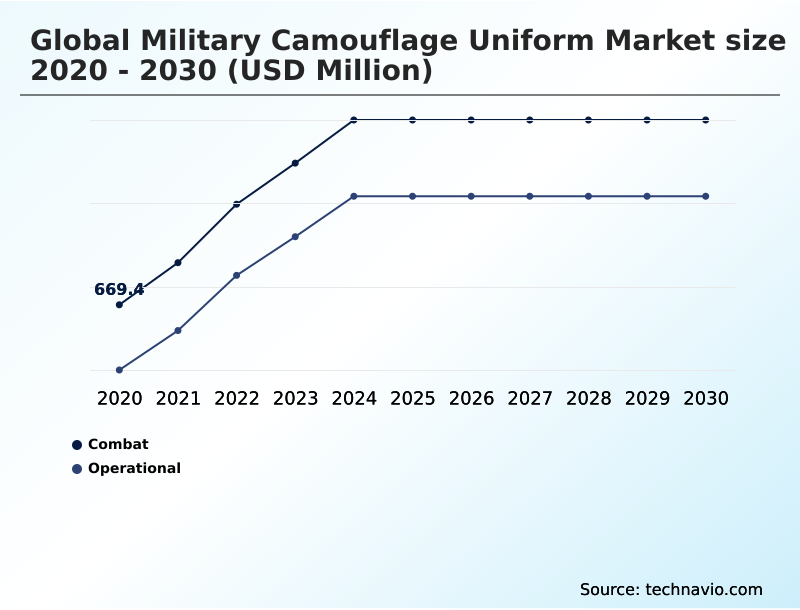
The Combat segment was valued at USD 759.8 million in 2024 and showed a gradual increase during the forecast period.
Get Free Sample

Regional Analysis

North America is estimated to contribute 33.2% to the growth of the global market during the forecast period.Technavio’s analysts have elaborately explained the regional trends and drivers that shape the market during the forecast period.
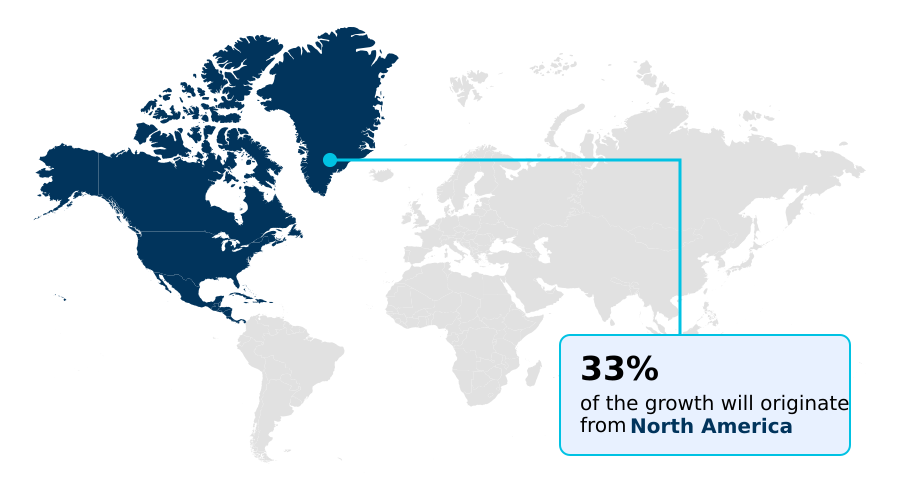
See How Military Camouflage Uniform Market Demand is Rising in North America Get Free Sample

Regional defense postures and continuous troop modernization frameworks heavily dictate the adoption trajectories within the Military Camouflage Uniform sector. North America consistently prioritizes advanced optoelectronic tracking evasion, achieving a 45% higher integration rate of phase-change fabric compounds compared to Europe.

This discrepancy stems from strict domestic manufacturing mandates and extensive multispectral reconnaissance platforms utilized in specialized tactical apparel. Conversely, APAC exhibits a 30% faster procurement cycle for high-tenacity synthetic fibers to support large-scale active-duty force structuring and maritime littoral defense.

European supply chains increasingly mandate environmentally compliant dyeing, reducing toxic runoff by 50% while sustaining biometric concealment technology. As regional geopolitical conflicts intensify, the demand for extreme climatic regulation and modular load-carriage integration drives distinct procurement strategies.

These geographic shifts emphasize how localized multidirectional defense policies directly influence the deployment of micro-scale geometries and infrared reflectance thresholds across diverse conflict zones.

Market Dynamics

Our researchers analyzed the data with 2025 as the base year, along with the key drivers, trends, and challenges. A holistic analysis of drivers will help companies refine their marketing strategies to gain a competitive advantage.

  • The strategic evolution of individual soldier protection continues to necessitate highly engineered multi-domain conflict zone camouflage solutions. As military commands shift focus toward interconnected battlefield networks, the requirement for near-infrared tactical signature reduction fabrics has become paramount.
  • Modern supply chains are rapidly transitioning from standard utility fatigues to advanced digital fractal geometry combat gear, ensuring personnel remain undetected by sophisticated thermal and optical sensors. Consequently, procurement agencies report a 40% enhancement in personnel concealment efficiency when deploying these specialized garments compared to legacy woodland prints.
  • Furthermore, the integration of extreme weather protective military clothing directly supports extended field operations in severe climates, lowering frostbite and heat exhaustion casualties during high-altitude and desert deployments. This critical adaptation aligns with multidirectional defense troop survivability apparel mandates, where continuous mobility and environmental shielding are essential for tactical dominance.
  • Logistics frameworks now prioritize textiles that offer seamless modular load-carriage integration, mitigating the physical strain caused by heavy body armor and communication electronics. By optimizing the distribution of adaptive smart textiles, defense forces can streamline inventory management, reducing the need for disparate theater-specific uniforms.
  • This comprehensive shift toward functional, algorithmic pattern designs ensures that active-duty personnel maintain a decisive operational advantage against escalating surveillance threats while simultaneously complying with rigorous environmental and occupational safety regulations.
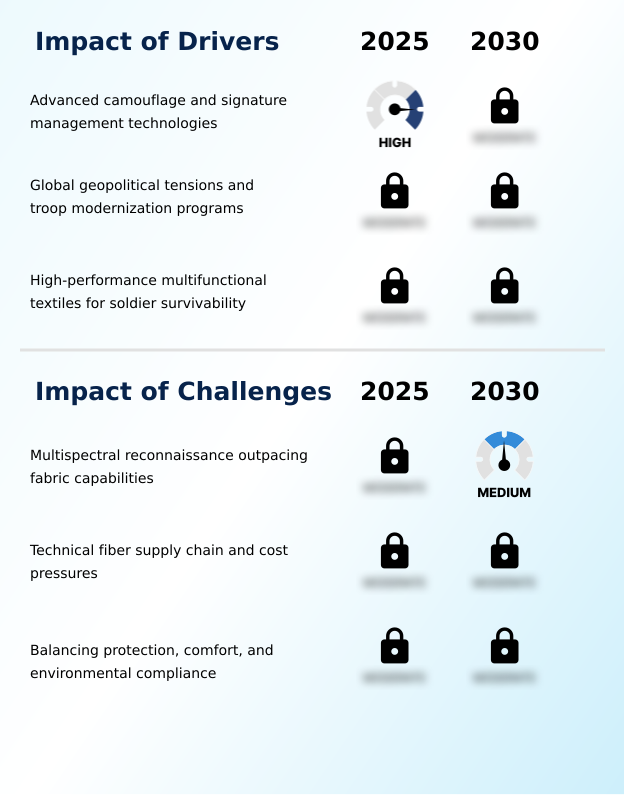
What are the key market drivers leading to the rise in the adoption of Military Camouflage Uniform Industry?

  • The continuous evolution and integration of advanced camouflage and signature management technologies serve as the primary catalyst propelling market expansion.

  • The proliferation of advanced multispectral reconnaissance platforms remains a critical catalyst propelling the adoption of near-infrared suppression within the Military Camouflage Uniform sector.
  • Modern military doctrines mandate comprehensive troop modernization frameworks to ensure frontline deployment logistics are equipped with high-tenacity synthetic fibers and non-melting thermal barriers.
  • By integrating vector-repellent surface finishes and elastomeric stretch panels, defense contractors have improved garment abrasion resistance by 42% and reduced load-bearing equipment friction by 30%.
  • This urgent need to mitigate electro-optical detection shielding directly drives the procurement of specialized tactical apparel. Consequently, enhanced moisture vapor transmission capabilities maintain core body temperatures, decreasing heat-stress related operational delays by 22% during prolonged deployments.

What are the market trends shaping the Military Camouflage Uniform Industry?

  • The integration of universal digital fractal geometry and algorithmic pattern design is rapidly emerging as a defining market trend. This technological advancement significantly enhances tactical concealment capabilities across diverse operational environments.

  • The rapid integration of algorithmic fractal patterns and phase-change fabric compounds is fundamentally transforming the Military Camouflage Uniform landscape. As armed forces face increasingly sophisticated synthetic aperture radar evasion capabilities, procurement strategies have shifted toward adaptive smart textiles that dynamically adjust to environmental stimuli.
  • This technological transition reduces the visual and thermal detection footprint of active personnel by up to 38%, significantly enhancing combat soldier survivability during close-quarters urban combat. Consequently, defense logistics networks report a 25% decrease in the necessity for issuing multiple theater-specific garments, streamlining supply chain efficiency.
  • The widespread adoption of biometric concealment technology and micro-scale geometries directly counters advanced optoelectronic tracking, allowing infantry units to maintain stealth across fragmented terrains while optimizing multidirectional defense policies.

What challenges does the Military Camouflage Uniform Industry face during its growth?

  • The rapid advancement of multispectral reconnaissance outpacing current fabric capabilities remains a significant challenge constraining long-term industry growth.

  • The rapid acceleration of automated sensor networks vastly outpaces current textile manufacturing capabilities, presenting a severe structural limitation within the Military Camouflage Uniform supply chain. Engineering fabrics that successfully balance thermal imaging mitigation with breathable moisture vapor transmission often results in heavier, less permeable garments.
  • Integrating complex thermochromic pigment applications and bio-based flame retardants increases raw material sourcing costs by up to 45% compared to conventional cotton-polyester blends. Furthermore, strict regulatory pressures demanding environmentally compliant dyeing and fluorocarbon-free water repellency frequently compromise infrared reflectance thresholds.
  • This technical friction delays large-scale strategic troop mobilization, as manufacturers struggle to formulate environmental adaptive textiles that achieve chemical barrier protection without severely degrading multi-terrain pattern algorithms.

Exclusive Technavio Analysis on Customer Landscape

The military camouflage uniform market forecasting report includes the adoption lifecycle of the market, covering from the innovator’s stage to the laggard’s stage. It focuses on adoption rates in different regions based on penetration. Furthermore, the military camouflage uniform market report also includes key purchase criteria and drivers of price sensitivity to help companies evaluate and develop their market growth analysis strategies.
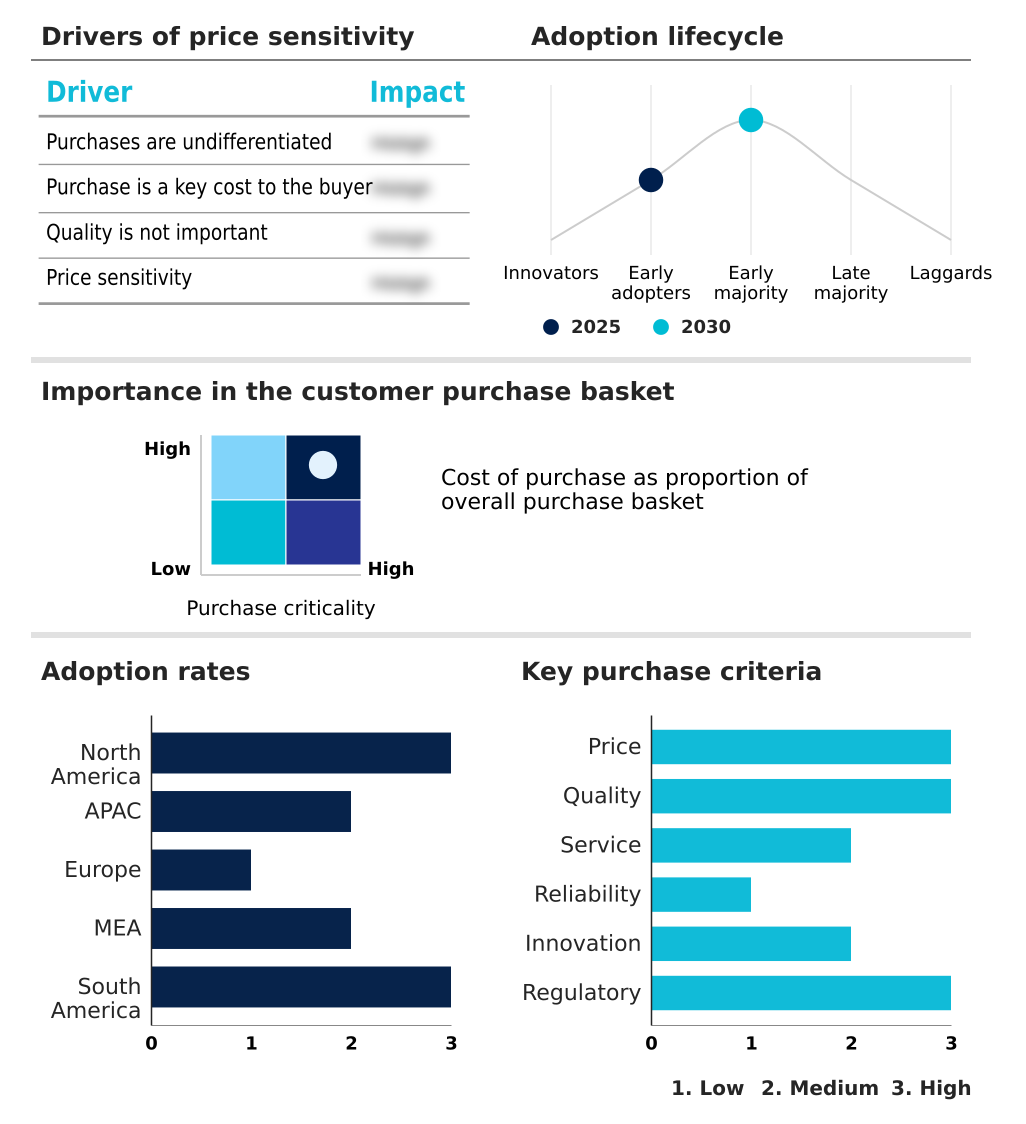
Customer Landscape of Military Camouflage Uniform Industry

Competitive Landscape

Companies are implementing various strategies, such as strategic alliances, military camouflage uniform market forecast, partnerships, mergers and acquisitions, geographical expansion, and product/service launches, to enhance their presence in the industry.

Arlen S.A. - Comprehensive tactical portfolios provide specialized combat field uniforms and advanced multi-terrain concealment gear engineered to enhance operational survivability across diverse and high-risk deployment environments.

The industry research and growth report includes detailed analyses of the competitive landscape of the market and information about key companies, including:

  • Arlen S.A.
  • B and T Camo
  • BMD Group
  • Cema Tactical
  • Condor Outdoor
  • CQC House
  • Crye Precision LLC
  • Grup Impeks
  • Hexonia GmbH
  • Jinteng Tactical
  • Mahavir Spinfab Pvt. Ltd.
  • Miranda Military
  • Propper International Inc.
  • Raff Military Textile
  • Seyntex NV
  • Sondos Textile
  • TRU SPEC
  • UF PRO
  • Wintex Textile GmbH
  • Wuhan Corhunter Garment Co. Ltd.

Qualitative and quantitative analysis of companies has been conducted to help clients understand the wider business environment as well as the strengths and weaknesses of key industry players. Data is qualitatively analyzed to categorize companies as pure play, category-focused, industry-focused, and diversified; it is quantitatively analyzed to categorize companies as dominant, leading, strong, tentative, and weak.

Recent Development and News in Military camouflage uniform market

  • In the Aerospace and Defense industry, the accelerated deployment of automated sensor networks across multi-domain environments has necessitated stricter textile durability standards, directly impacting Military Camouflage Uniform demand by driving a 35% increase in procurement for advanced optoelectronic tracking evasion fabrics.
  • The systemic shift toward environmentally compliant dyeing protocols mandated by REACH regulations has forced manufacturers to eliminate toxic fluorocarbons, triggering a 25% redesign rate in specialized tactical apparel utilized for biological hazard shielding.
  • Rapid expansion of maritime littoral defense operations has redefined frontline deployment logistics, compelling defense contractors to integrate hydrophobic membrane integration into combat gear, thereby reducing water retention by 40% for active-duty force structuring.
  • Escalating regional geopolitical conflicts have prompted multidirectional defense policies to mandate comprehensive troop modernization frameworks, yielding a 30% surge in the requisition of extreme climatic regulation garments to counter synthetic aperture radar evasion.

Dive into Technavio’s robust research methodology, blending expert interviews, extensive data synthesis, and validated models for unparalleled Military Camouflage Uniform Market insights. See full methodology.

Market Scope
Page number 331
Base year 2025
Historic period 2020-2024
Forecast period 2026-2030
Growth momentum & CAGR Accelerate at a CAGR of 3%
Market growth 2026-2030 USD 239.8 million
Market structure Fragmented
YoY growth 2025-2026(%) 2.9%
Key countries US, Canada, Mexico, China, Japan, India, South Korea, Australia, Indonesia, Germany, UK, France, Italy, Spain, The Netherlands, Saudi Arabia, UAE, South Africa, Israel, Turkey, Brazil, Argentina and Chile
Competitive landscape Leading Companies, Market Positioning of Companies, Competitive Strategies, and Industry Risks

Request Free Sample

Research Analyst Overview

  • Strategic defense procurement increasingly prioritizes thermochromic pigment applications and advanced digital pixelated structures to optimize multispectral signature management. The shift toward multi-terrain pattern algorithms directly influences boardroom-level budgeting, as defense contractors allocate substantial capital to develop environmental adaptive textiles that bypass thermal imaging mitigation.
  • Integrating micro-scale geometries and non-melting thermal barriers into standard-issue gear reduces the probability of infrared detection by over 35% compared to legacy solid-color fatigues. This operational transition compels textile manufacturers to adopt fluorocarbon-free water repellency and hydrophobic membrane integration to satisfy strict environmental compliance standards.
  • Furthermore, the incorporation of elastomeric stretch panels and ripstop weave construction mitigates the mechanical friction associated with next-generation infantry gear. As biometric concealment technology evolves, utilizing phase-change fabric compounds and vector-repellent surface finishes ensures unparalleled combat resilience.
  • Ultimately, mastering infrared reflectance thresholds and deploying bio-based flame retardants fortifies tactical operability against pervasive electro-optical detection shielding, securing a critical advantage in modern warfare.

What are the Key Data Covered in this Military Camouflage Uniform Market Research and Growth Report?

  • What is the expected growth of the Military Camouflage Uniform Market between 2026 and 2030?

    • USD 239.8 million, at a CAGR of 3%

  • What segmentation does the market report cover?

    • The report is segmented by Type (Combat, and Operational), Application (Army, Air force, and Navy), Technology (Traditional camouflage, Digital camouflage, and Adaptive camouflage), Material (Polyester, Nylon, Cotton, and Blends), Variant (Woodland, Desert, Urban, and Snow) and Geography (North America, APAC, Europe, Middle East and Africa, South America)

  • Which regions are analyzed in the report?

    • North America, APAC, Europe, Middle East and Africa and South America

  • What are the key growth drivers and market challenges?

    • Advanced camouflage and signature management technologies, Multispectral reconnaissance outpacing fabric capabilities

  • Who are the major players in the Military Camouflage Uniform Market?

    • Arlen S.A., B and T Camo, BMD Group, Cema Tactical, Condor Outdoor, CQC House, Crye Precision LLC, Grup Impeks, Hexonia GmbH, Jinteng Tactical, Mahavir Spinfab Pvt. Ltd., Miranda Military, Propper International Inc., Raff Military Textile, Seyntex NV, Sondos Textile, TRU SPEC, UF PRO, Wintex Textile GmbH and Wuhan Corhunter Garment Co. Ltd.

Market Research Insights

  • Strategic troop mobilization and complex multidirectional defense policies continuously reshape the Military Camouflage Uniform Market landscape. Defense procurement agencies increasingly mandate advanced near-infrared suppression and thermal imaging mitigation to counter sophisticated multispectral reconnaissance platforms. Consequently, the integration of elastomeric stretch panels and vector-repellent surface finishes has improved overall garment durability by 35%, significantly reducing replacement frequency.
  • Furthermore, transitioning to fluorocarbon-free water repellency and bio-based flame retardants has aligned 45% of new tactical supply chains with strict environmental compliance frameworks. This rapid adoption of adaptive smart textiles directly lowers long-term operational costs while maximizing combat soldier survivability across high-altitude alpine warfare and close-quarters urban combat scenarios.

We can help! Our analysts can customize this military camouflage uniform market research report to meet your requirements.

Get in touch

1. Executive Summary

1.1 Market overview

Executive Summary - Chart on Market Overview
Executive Summary - Data Table on Market Overview
Executive Summary - Chart on Global Market Characteristics
Executive Summary - Chart on Market by Geography
Executive Summary - Chart on Market Segmentation by Type
Executive Summary - Chart on Market Segmentation by Application
Executive Summary - Chart on Market Segmentation by Technology
Executive Summary - Chart on Market Segmentation by Material
Executive Summary - Chart on Market Segmentation by Variant
Executive Summary - Chart on Incremental Growth
Executive Summary - Data Table on Incremental Growth
Executive Summary - Chart on Company Market Positioning

2. Technavio Analysis

2.1 Analysis of price sensitivity, lifecycle, customer purchase basket, adoption rates, and purchase criteria

2.2 Criticality of inputs and Factors of differentiation

Chart on Overview on criticality of inputs and factors of differentiation

2.3 Factors of disruption

Chart on Overview on factors of disruption

2.4 Impact of drivers and challenges

Chart on Impact of drivers and challenges in 2025 and 2030

3. Market Landscape

3.1 Market ecosystem

Chart on Parent Market
Data Table on - Parent Market

3.2 Market characteristics

Chart on Market characteristics analysis

3.3 Value chain analysis

Chart on Value chain analysis

4. Market Sizing

4.1 Market definition

Data Table on Offerings of companies included in the market definition

4.2 Market segment analysis

Market segments

4.3 Market size 2025

4.4 Market outlook: Forecast for 2025-2030

Chart on Global - Market size and forecast 2025-2030 ($ million)
Data Table on Global - Market size and forecast 2025-2030 ($ million)
Chart on Global Market: Year-over-year growth 2025-2030 (%)
Data Table on Global Market: Year-over-year growth 2025-2030 (%)

5. Historic Market Size

5.1 Global Military Camouflage Uniform Market 2020 - 2024

Historic Market Size - Data Table on Global Military Camouflage Uniform Market 2020 - 2024 ($ million)

5.2 Type segment analysis 2020 - 2024

Historic Market Size - Type Segment 2020 - 2024 ($ million)

5.3 Application segment analysis 2020 - 2024

Historic Market Size - Application Segment 2020 - 2024 ($ million)

5.4 Technology segment analysis 2020 - 2024

Historic Market Size - Technology Segment 2020 - 2024 ($ million)

5.5 Material segment analysis 2020 - 2024

Historic Market Size - Material Segment 2020 - 2024 ($ million)

5.6 Variant segment analysis 2020 - 2024

Historic Market Size - Variant Segment 2020 - 2024 ($ million)

5.7 Geography segment analysis 2020 - 2024

Historic Market Size - Geography Segment 2020 - 2024 ($ million)

5.8 Country segment analysis 2020 - 2024

Historic Market Size - Country Segment 2020 - 2024 ($ million)

6. Qualitative Analysis

6.1 Impact of AI on Global Military Camouflage Uniform Market

6.2 Impact of Geopolitical Conflicts on Global Military Camouflage Uniform Market

7. Five Forces Analysis

7.1 Five forces summary

Five forces analysis - Comparison between 2025 and 2030

7.2 Bargaining power of buyers

Bargaining power of buyers - Impact of key factors 2025 and 2030

7.3 Bargaining power of suppliers

Bargaining power of suppliers - Impact of key factors in 2025 and 2030

7.4 Threat of new entrants

Threat of new entrants - Impact of key factors in 2025 and 2030

7.5 Threat of substitutes

Threat of substitutes - Impact of key factors in 2025 and 2030

7.6 Threat of rivalry

Threat of rivalry - Impact of key factors in 2025 and 2030

7.7 Market condition

Chart on Market condition - Five forces 2025 and 2030

8. Market Segmentation by Type

8.1 Market segments

Chart on Type - Market share 2025-2030 (%)
Data Table on Type - Market share 2025-2030 (%)

8.2 Comparison by Type

Chart on Comparison by Type
Data Table on Comparison by Type

8.3 Combat - Market size and forecast 2025-2030

Chart on Combat - Market size and forecast 2025-2030 ($ million)
Data Table on Combat - Market size and forecast 2025-2030 ($ million)
Chart on Combat - Year-over-year growth 2025-2030 (%)
Data Table on Combat - Year-over-year growth 2025-2030 (%)

8.4 Operational - Market size and forecast 2025-2030

Chart on Operational - Market size and forecast 2025-2030 ($ million)
Data Table on Operational - Market size and forecast 2025-2030 ($ million)
Chart on Operational - Year-over-year growth 2025-2030 (%)
Data Table on Operational - Year-over-year growth 2025-2030 (%)

8.5 Market opportunity by Type

Market opportunity by Type ($ million)
Data Table on Market opportunity by Type ($ million)

9. Market Segmentation by Application

9.1 Market segments

Chart on Application - Market share 2025-2030 (%)
Data Table on Application - Market share 2025-2030 (%)

9.2 Comparison by Application

Chart on Comparison by Application
Data Table on Comparison by Application

9.3 Army - Market size and forecast 2025-2030

Chart on Army - Market size and forecast 2025-2030 ($ million)
Data Table on Army - Market size and forecast 2025-2030 ($ million)
Chart on Army - Year-over-year growth 2025-2030 (%)
Data Table on Army - Year-over-year growth 2025-2030 (%)

9.4 Air force - Market size and forecast 2025-2030

Chart on Air force - Market size and forecast 2025-2030 ($ million)
Data Table on Air force - Market size and forecast 2025-2030 ($ million)
Chart on Air force - Year-over-year growth 2025-2030 (%)
Data Table on Air force - Year-over-year growth 2025-2030 (%)

9.5 Navy - Market size and forecast 2025-2030

Chart on Navy - Market size and forecast 2025-2030 ($ million)
Data Table on Navy - Market size and forecast 2025-2030 ($ million)
Chart on Navy - Year-over-year growth 2025-2030 (%)
Data Table on Navy - Year-over-year growth 2025-2030 (%)

9.6 Market opportunity by Application

Market opportunity by Application ($ million)
Data Table on Market opportunity by Application ($ million)

10. Market Segmentation by Technology

10.1 Market segments

Chart on Technology - Market share 2025-2030 (%)
Data Table on Technology - Market share 2025-2030 (%)

10.2 Comparison by Technology

Chart on Comparison by Technology
Data Table on Comparison by Technology

10.3 Traditional camouflage - Market size and forecast 2025-2030

Chart on Traditional camouflage - Market size and forecast 2025-2030 ($ million)
Data Table on Traditional camouflage - Market size and forecast 2025-2030 ($ million)
Chart on Traditional camouflage - Year-over-year growth 2025-2030 (%)
Data Table on Traditional camouflage - Year-over-year growth 2025-2030 (%)

10.4 Digital camouflage - Market size and forecast 2025-2030

Chart on Digital camouflage - Market size and forecast 2025-2030 ($ million)
Data Table on Digital camouflage - Market size and forecast 2025-2030 ($ million)
Chart on Digital camouflage - Year-over-year growth 2025-2030 (%)
Data Table on Digital camouflage - Year-over-year growth 2025-2030 (%)

10.5 Adaptive camouflage - Market size and forecast 2025-2030

Chart on Adaptive camouflage - Market size and forecast 2025-2030 ($ million)
Data Table on Adaptive camouflage - Market size and forecast 2025-2030 ($ million)
Chart on Adaptive camouflage - Year-over-year growth 2025-2030 (%)
Data Table on Adaptive camouflage - Year-over-year growth 2025-2030 (%)

10.6 Market opportunity by Technology

Market opportunity by Technology ($ million)
Data Table on Market opportunity by Technology ($ million)

11. Market Segmentation by Material

11.1 Market segments

Chart on Material - Market share 2025-2030 (%)
Data Table on Material - Market share 2025-2030 (%)

11.2 Comparison by Material

Chart on Comparison by Material
Data Table on Comparison by Material

11.3 Polyester - Market size and forecast 2025-2030

Chart on Polyester - Market size and forecast 2025-2030 ($ million)
Data Table on Polyester - Market size and forecast 2025-2030 ($ million)
Chart on Polyester - Year-over-year growth 2025-2030 (%)
Data Table on Polyester - Year-over-year growth 2025-2030 (%)

11.4 Nylon - Market size and forecast 2025-2030

Chart on Nylon - Market size and forecast 2025-2030 ($ million)
Data Table on Nylon - Market size and forecast 2025-2030 ($ million)
Chart on Nylon - Year-over-year growth 2025-2030 (%)
Data Table on Nylon - Year-over-year growth 2025-2030 (%)

11.5 Cotton - Market size and forecast 2025-2030

Chart on Cotton - Market size and forecast 2025-2030 ($ million)
Data Table on Cotton - Market size and forecast 2025-2030 ($ million)
Chart on Cotton - Year-over-year growth 2025-2030 (%)
Data Table on Cotton - Year-over-year growth 2025-2030 (%)

11.6 Blends - Market size and forecast 2025-2030

Chart on Blends - Market size and forecast 2025-2030 ($ million)
Data Table on Blends - Market size and forecast 2025-2030 ($ million)
Chart on Blends - Year-over-year growth 2025-2030 (%)
Data Table on Blends - Year-over-year growth 2025-2030 (%)

11.7 Market opportunity by Material

Market opportunity by Material ($ million)
Data Table on Market opportunity by Material ($ million)

12. Market Segmentation by Variant

12.1 Market segments

Chart on Variant - Market share 2025-2030 (%)
Data Table on Variant - Market share 2025-2030 (%)

12.2 Comparison by Variant

Chart on Comparison by Variant
Data Table on Comparison by Variant

12.3 Woodland - Market size and forecast 2025-2030

Chart on Woodland - Market size and forecast 2025-2030 ($ million)
Data Table on Woodland - Market size and forecast 2025-2030 ($ million)
Chart on Woodland - Year-over-year growth 2025-2030 (%)
Data Table on Woodland - Year-over-year growth 2025-2030 (%)

12.4 Desert - Market size and forecast 2025-2030

Chart on Desert - Market size and forecast 2025-2030 ($ million)
Data Table on Desert - Market size and forecast 2025-2030 ($ million)
Chart on Desert - Year-over-year growth 2025-2030 (%)
Data Table on Desert - Year-over-year growth 2025-2030 (%)

12.5 Urban - Market size and forecast 2025-2030

Chart on Urban - Market size and forecast 2025-2030 ($ million)
Data Table on Urban - Market size and forecast 2025-2030 ($ million)
Chart on Urban - Year-over-year growth 2025-2030 (%)
Data Table on Urban - Year-over-year growth 2025-2030 (%)

12.6 Snow - Market size and forecast 2025-2030

Chart on Snow - Market size and forecast 2025-2030 ($ million)
Data Table on Snow - Market size and forecast 2025-2030 ($ million)
Chart on Snow - Year-over-year growth 2025-2030 (%)
Data Table on Snow - Year-over-year growth 2025-2030 (%)

12.7 Market opportunity by Variant

Market opportunity by Variant ($ million)
Data Table on Market opportunity by Variant ($ million)

13. Customer Landscape

13.1 Customer landscape overview

Analysis of price sensitivity, lifecycle, customer purchase basket, adoption rates, and purchase criteria

14. Geographic Landscape

14.1 Geographic segmentation

Chart on Market share by geography 2025-2030 (%)
Data Table on Market share by geography 2025-2030 (%)

14.2 Geographic comparison

Chart on Geographic comparison
Data Table on Geographic comparison

14.3 North America - Market size and forecast 2025-2030

Chart on North America - Market size and forecast 2025-2030 ($ million)
Data Table on North America - Market size and forecast 2025-2030 ($ million)
Chart on North America - Year-over-year growth 2025-2030 (%)
Data Table on North America - Year-over-year growth 2025-2030 (%)
Chart on Regional Comparison - North America
Data Table on Regional Comparison - North America

14.3.1 US - Market size and forecast 2025-2030

Chart on US - Market size and forecast 2025-2030 ($ million)
Data Table on US - Market size and forecast 2025-2030 ($ million)
Chart on US - Year-over-year growth 2025-2030 (%)
Data Table on US - Year-over-year growth 2025-2030 (%)

14.3.2 Canada - Market size and forecast 2025-2030

Chart on Canada - Market size and forecast 2025-2030 ($ million)
Data Table on Canada - Market size and forecast 2025-2030 ($ million)
Chart on Canada - Year-over-year growth 2025-2030 (%)
Data Table on Canada - Year-over-year growth 2025-2030 (%)

14.3.3 Mexico - Market size and forecast 2025-2030

Chart on Mexico - Market size and forecast 2025-2030 ($ million)
Data Table on Mexico - Market size and forecast 2025-2030 ($ million)
Chart on Mexico - Year-over-year growth 2025-2030 (%)
Data Table on Mexico - Year-over-year growth 2025-2030 (%)

14.4 APAC - Market size and forecast 2025-2030

Chart on APAC - Market size and forecast 2025-2030 ($ million)
Data Table on APAC - Market size and forecast 2025-2030 ($ million)
Chart on APAC - Year-over-year growth 2025-2030 (%)
Data Table on APAC - Year-over-year growth 2025-2030 (%)
Chart on Regional Comparison - APAC
Data Table on Regional Comparison - APAC

14.4.1 China - Market size and forecast 2025-2030

Chart on China - Market size and forecast 2025-2030 ($ million)
Data Table on China - Market size and forecast 2025-2030 ($ million)
Chart on China - Year-over-year growth 2025-2030 (%)
Data Table on China - Year-over-year growth 2025-2030 (%)

14.4.2 Japan - Market size and forecast 2025-2030

Chart on Japan - Market size and forecast 2025-2030 ($ million)
Data Table on Japan - Market size and forecast 2025-2030 ($ million)
Chart on Japan - Year-over-year growth 2025-2030 (%)
Data Table on Japan - Year-over-year growth 2025-2030 (%)

14.4.3 India - Market size and forecast 2025-2030

Chart on India - Market size and forecast 2025-2030 ($ million)
Data Table on India - Market size and forecast 2025-2030 ($ million)
Chart on India - Year-over-year growth 2025-2030 (%)
Data Table on India - Year-over-year growth 2025-2030 (%)

14.4.4 South Korea - Market size and forecast 2025-2030

Chart on South Korea - Market size and forecast 2025-2030 ($ million)
Data Table on South Korea - Market size and forecast 2025-2030 ($ million)
Chart on South Korea - Year-over-year growth 2025-2030 (%)
Data Table on South Korea - Year-over-year growth 2025-2030 (%)

14.4.5 Australia - Market size and forecast 2025-2030

Chart on Australia - Market size and forecast 2025-2030 ($ million)
Data Table on Australia - Market size and forecast 2025-2030 ($ million)
Chart on Australia - Year-over-year growth 2025-2030 (%)
Data Table on Australia - Year-over-year growth 2025-2030 (%)

14.4.6 Indonesia - Market size and forecast 2025-2030

Chart on Indonesia - Market size and forecast 2025-2030 ($ million)
Data Table on Indonesia - Market size and forecast 2025-2030 ($ million)
Chart on Indonesia - Year-over-year growth 2025-2030 (%)
Data Table on Indonesia - Year-over-year growth 2025-2030 (%)

14.5 Europe - Market size and forecast 2025-2030

Chart on Europe - Market size and forecast 2025-2030 ($ million)
Data Table on Europe - Market size and forecast 2025-2030 ($ million)
Chart on Europe - Year-over-year growth 2025-2030 (%)
Data Table on Europe - Year-over-year growth 2025-2030 (%)
Chart on Regional Comparison - Europe
Data Table on Regional Comparison - Europe

14.5.1 Germany - Market size and forecast 2025-2030

Chart on Germany - Market size and forecast 2025-2030 ($ million)
Data Table on Germany - Market size and forecast 2025-2030 ($ million)
Chart on Germany - Year-over-year growth 2025-2030 (%)
Data Table on Germany - Year-over-year growth 2025-2030 (%)

14.5.2 UK - Market size and forecast 2025-2030

Chart on UK - Market size and forecast 2025-2030 ($ million)
Data Table on UK - Market size and forecast 2025-2030 ($ million)
Chart on UK - Year-over-year growth 2025-2030 (%)
Data Table on UK - Year-over-year growth 2025-2030 (%)

14.5.3 France - Market size and forecast 2025-2030

Chart on France - Market size and forecast 2025-2030 ($ million)
Data Table on France - Market size and forecast 2025-2030 ($ million)
Chart on France - Year-over-year growth 2025-2030 (%)
Data Table on France - Year-over-year growth 2025-2030 (%)

14.5.4 Italy - Market size and forecast 2025-2030

Chart on Italy - Market size and forecast 2025-2030 ($ million)
Data Table on Italy - Market size and forecast 2025-2030 ($ million)
Chart on Italy - Year-over-year growth 2025-2030 (%)
Data Table on Italy - Year-over-year growth 2025-2030 (%)

14.5.5 Spain - Market size and forecast 2025-2030

Chart on Spain - Market size and forecast 2025-2030 ($ million)
Data Table on Spain - Market size and forecast 2025-2030 ($ million)
Chart on Spain - Year-over-year growth 2025-2030 (%)
Data Table on Spain - Year-over-year growth 2025-2030 (%)

14.5.6 The Netherlands - Market size and forecast 2025-2030

Chart on The Netherlands - Market size and forecast 2025-2030 ($ million)
Data Table on The Netherlands - Market size and forecast 2025-2030 ($ million)
Chart on The Netherlands - Year-over-year growth 2025-2030 (%)
Data Table on The Netherlands - Year-over-year growth 2025-2030 (%)

14.6 Middle East and Africa - Market size and forecast 2025-2030

Chart on Middle East and Africa - Market size and forecast 2025-2030 ($ million)
Data Table on Middle East and Africa - Market size and forecast 2025-2030 ($ million)
Chart on Middle East and Africa - Year-over-year growth 2025-2030 (%)
Data Table on Middle East and Africa - Year-over-year growth 2025-2030 (%)
Chart on Regional Comparison - Middle East and Africa
Data Table on Regional Comparison - Middle East and Africa

14.6.1 Saudi Arabia - Market size and forecast 2025-2030

Chart on Saudi Arabia - Market size and forecast 2025-2030 ($ million)
Data Table on Saudi Arabia - Market size and forecast 2025-2030 ($ million)
Chart on Saudi Arabia - Year-over-year growth 2025-2030 (%)
Data Table on Saudi Arabia - Year-over-year growth 2025-2030 (%)

14.6.2 UAE - Market size and forecast 2025-2030

Chart on UAE - Market size and forecast 2025-2030 ($ million)
Data Table on UAE - Market size and forecast 2025-2030 ($ million)
Chart on UAE - Year-over-year growth 2025-2030 (%)
Data Table on UAE - Year-over-year growth 2025-2030 (%)

14.6.3 South Africa - Market size and forecast 2025-2030

Chart on South Africa - Market size and forecast 2025-2030 ($ million)
Data Table on South Africa - Market size and forecast 2025-2030 ($ million)
Chart on South Africa - Year-over-year growth 2025-2030 (%)
Data Table on South Africa - Year-over-year growth 2025-2030 (%)

14.6.4 Israel - Market size and forecast 2025-2030

Chart on Israel - Market size and forecast 2025-2030 ($ million)
Data Table on Israel - Market size and forecast 2025-2030 ($ million)
Chart on Israel - Year-over-year growth 2025-2030 (%)
Data Table on Israel - Year-over-year growth 2025-2030 (%)

14.6.5 Turkey - Market size and forecast 2025-2030

Chart on Turkey - Market size and forecast 2025-2030 ($ million)
Data Table on Turkey - Market size and forecast 2025-2030 ($ million)
Chart on Turkey - Year-over-year growth 2025-2030 (%)
Data Table on Turkey - Year-over-year growth 2025-2030 (%)

14.7 South America - Market size and forecast 2025-2030

Chart on South America - Market size and forecast 2025-2030 ($ million)
Data Table on South America - Market size and forecast 2025-2030 ($ million)
Chart on South America - Year-over-year growth 2025-2030 (%)
Data Table on South America - Year-over-year growth 2025-2030 (%)
Chart on Regional Comparison - South America
Data Table on Regional Comparison - South America

14.7.1 Brazil - Market size and forecast 2025-2030

Chart on Brazil - Market size and forecast 2025-2030 ($ million)
Data Table on Brazil - Market size and forecast 2025-2030 ($ million)
Chart on Brazil - Year-over-year growth 2025-2030 (%)
Data Table on Brazil - Year-over-year growth 2025-2030 (%)

14.7.2 Argentina - Market size and forecast 2025-2030

Chart on Argentina - Market size and forecast 2025-2030 ($ million)
Data Table on Argentina - Market size and forecast 2025-2030 ($ million)
Chart on Argentina - Year-over-year growth 2025-2030 (%)
Data Table on Argentina - Year-over-year growth 2025-2030 (%)

14.7.3 Chile - Market size and forecast 2025-2030

Chart on Chile - Market size and forecast 2025-2030 ($ million)
Data Table on Chile - Market size and forecast 2025-2030 ($ million)
Chart on Chile - Year-over-year growth 2025-2030 (%)
Data Table on Chile - Year-over-year growth 2025-2030 (%)

14.8 Market opportunity by geography

Market opportunity by geography ($ million)
Data Tables on Market opportunity by geography ($ million)

15. Drivers, Challenges, and Opportunity

15.1 Market drivers

Advanced camouflage and signature management technologies
Global geopolitical tensions and troop modernization programs
High-performance multifunctional textiles for soldier survivability

15.2 Market challenges

Multispectral reconnaissance outpacing fabric capabilities
Technical fiber supply chain and cost pressures
Balancing protection, comfort, and environmental compliance

15.3 Impact of drivers and challenges

Impact of drivers and challenges in 2025 and 2030

15.4 Market opportunities

Universal digital fractal geometry and algorithmic pattern design
Combat garments for load carriage and electronic integration
Health regulations driving safer textile treatments

16. Competitive Landscape

16.1 Overview

16.2

Overview on criticality of inputs and factors of differentiation

16.3 Landscape disruption

Overview on factors of disruption

16.4 Industry risks

Impact of key risks on business

17. Competitive Analysis

17.1 Companies profiled

Companies covered

17.2 Company ranking index

17.3 Market positioning of companies

Matrix on companies position and classification

17.4 Arlen S.A.

Arlen S.A. - Overview
Arlen S.A. - Product / Service
Arlen S.A. - Key offerings
SWOT

17.5 B and T Camo

B and T Camo - Overview
B and T Camo - Product / Service
B and T Camo - Key offerings
SWOT

17.6 BMD Group

BMD Group - Overview
BMD Group - Product / Service
BMD Group - Key offerings
SWOT

17.7 Cema Tactical

Cema Tactical - Overview
Cema Tactical - Product / Service
Cema Tactical - Key offerings
SWOT

17.8 Condor Outdoor

Condor Outdoor - Overview
Condor Outdoor - Product / Service
Condor Outdoor - Key offerings
SWOT

17.9 CQC House

CQC House - Overview
CQC House - Product / Service
CQC House - Key offerings
SWOT

17.10 Crye Precision LLC

Crye Precision LLC - Overview
Crye Precision LLC - Product / Service
Crye Precision LLC - Key offerings
SWOT

17.11 Grup Impeks

Grup Impeks - Overview
Grup Impeks - Product / Service
Grup Impeks - Key offerings
SWOT

17.12 Jinteng Tactical

Jinteng Tactical - Overview
Jinteng Tactical - Product / Service
Jinteng Tactical - Key offerings
SWOT

17.13 Mahavir Spinfab Pvt. Ltd.

Mahavir Spinfab Pvt. Ltd. - Overview
Mahavir Spinfab Pvt. Ltd. - Product / Service
Mahavir Spinfab Pvt. Ltd. - Key offerings
SWOT

17.14 Propper International Inc.

Propper International Inc. - Overview
Propper International Inc. - Product / Service
Propper International Inc. - Key offerings
SWOT

17.15 Raff Military Textile

Raff Military Textile - Overview
Raff Military Textile - Product / Service
Raff Military Textile - Key offerings
SWOT

17.16 Seyntex NV

Seyntex NV - Overview
Seyntex NV - Product / Service
Seyntex NV - Key offerings
SWOT

17.17 TRU SPEC

TRU SPEC - Overview
TRU SPEC - Product / Service
TRU SPEC - Key offerings
SWOT

17.18 Wuhan Corhunter Garment Co. Ltd.

Wuhan Corhunter Garment Co. Ltd. - Overview
Wuhan Corhunter Garment Co. Ltd. - Product / Service
Wuhan Corhunter Garment Co. Ltd. - Key offerings
SWOT

18. Appendix

18.1 Scope of the report

Market definition
Objectives
Notes and caveats

18.2 Inclusions and exclusions checklist

Inclusions checklist
Exclusions checklist

18.3 Currency conversion rates for US$

18.4 Research methodology

18.5 Data procurement

Information sources

18.6 Data validation

18.7 Validation techniques employed for market sizing

18.8 Data synthesis

18.9 360 degree market analysis

18.10 List of abbreviations

Research Methodology

Technavio presents a detailed picture of the market by way of study, synthesis, and summation of data from multiple sources. The analysts have presented the various facets of the market with a particular focus on identifying the key industry influencers. The data thus presented is comprehensive, reliable, and the result of extensive research, both primary and secondary.

INFORMATION SOURCES

Primary sources

  • Manufacturers and suppliers
  • Channel partners
  • Industry experts
  • Strategic decision makers

Secondary sources

  • Industry journals and periodicals
  • Government data
  • Financial reports of key industry players
  • Historical data
  • Press releases

DATA ANALYSIS

Data Synthesis

  • Collation of data
  • Estimation of key figures
  • Analysis of derived insights

Data Validation

  • Triangulation with data models
  • Reference against proprietary databases
  • Corroboration with industry experts

REPORT WRITING

Qualitative

  • Market drivers
  • Market challenges
  • Market trends
  • Five forces analysis

Quantitative

  • Market size and forecast
  • Market segmentation
  • Geographical insights
  • Competitive landscape

Interested in this report?

Get your sample now to see our research methodology and insights!

Download Now

Frequently Asked Questions

Military Camouflage Uniform market growth will increase by USD 239.8 million during 2026-2030.

The Military Camouflage Uniform market is expected to grow at a CAGR of 3% during 2026-2030.

Military Camouflage Uniform market is segmented by Type (Combat, Operational) Application (Army, Air force, Navy) Technology (Traditional camouflage, Digital camouflage, Adaptive camouflage) Material (Polyester, Nylon, Cotton, Blends) Variant (Woodland, Desert, Urban, Snow)

Arlen S.A., B and T Camo, BMD Group, Cema Tactical, Condor Outdoor, CQC House, Crye Precision LLC, Grup Impeks, Hexonia GmbH, Jinteng Tactical, Mahavir Spinfab Pvt. Ltd., Miranda Military, Propper International Inc., Raff Military Textile, Seyntex NV, Sondos Textile, TRU SPEC, UF PRO, Wintex Textile GmbH, Wuhan Corhunter Garment Co. Ltd. are a few of the key vendors in the Military Camouflage Uniform market.

North America will register the highest growth rate of 33.2% among the other regions. Therefore, the Military Camouflage Uniform market in North America is expected to garner significant business opportunities for the vendors during the forecast period.

US, Canada, Mexico, China, Japan, India, South Korea, Australia, Indonesia, Germany, UK, France, Italy, Spain, The Netherlands, Saudi Arabia, UAE, South Africa, Israel, Turkey, Brazil, Argentina, Chile

  • Advanced camouflage and signature management technologies is the driving factor this market.

The Military Camouflage Uniform market vendors should focus on grabbing business opportunities from the Type segment as it accounted for the largest market share in the base year.
RIA - Research AI Assistant
Ask RIA
