
Incident Response System Market Analysis, Size, and Forecast 2026-2030: North America (US, Canada, and Mexico), APAC (China, Japan, and India), Europe (Germany, UK, and France), South America (Brazil, Argentina, and Chile), Middle East and Africa (Saudi Arabia, UAE, and South Africa), and Rest of World (ROW)

Incident Response System Market Analysis, Size, and Forecast 2026-2030:
North America (US, Canada, and Mexico), APAC (China, Japan, and India), Europe (Germany, UK, and France), South America (Brazil, Argentina, and Chile), Middle East and Africa (Saudi Arabia, UAE, and South Africa), and Rest of World (ROW)

Published: Oct 2026 308 Pages SKU: IRTNTR70071

Market Overview at a Glance

$159.00 Mn
Market Opportunity
19.3%
CAGR 2025 - 2030
41.8%
North America Growth
$30.05 Mn
Backup and disaster recovery solutions segment 2024

Incident Response System Market Size 2026-2030

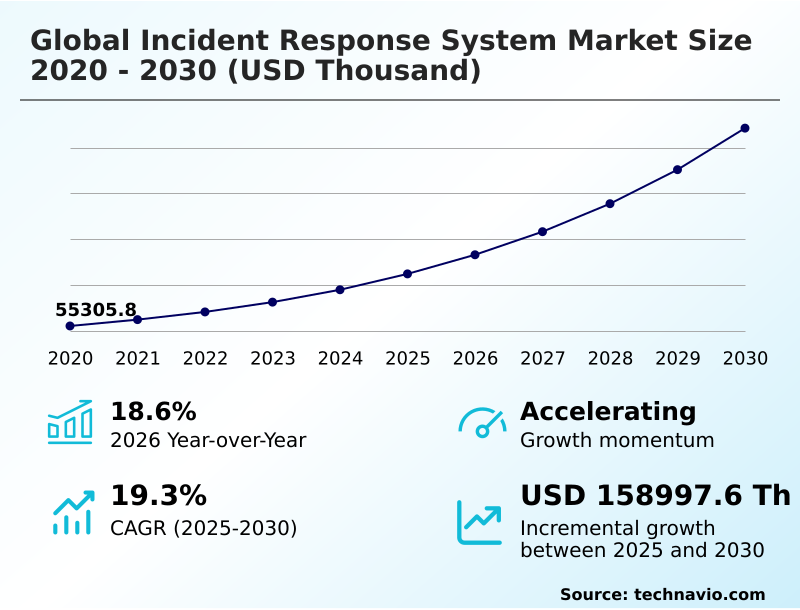
The incident response system market size is valued to increase by USD 159.00 million, at a CAGR of 19.3% from 2025 to 2030. Rising threat of ransomware extortion will drive the incident response system market.

Major Market Trends & Insights

  • North America dominated the market and accounted for a 41.8% growth during the forecast period.
  • By Type - Backup and disaster recovery solutions segment was valued at USD 30.05 million in 2024
  • By Component - Software segment accounted for the largest market revenue share in 2024

Market Size & Forecast

  • Market Opportunities:
  • Market Future Opportunities: USD 159.00 million
  • CAGR from 2025 to 2030 : 19.3%

Market Summary

  • The Incident Response System Market experiences remarkable expansion as digital threats grow increasingly sophisticated across enterprise environments. Organizations across multiple sectors face mounting pressure to fortify their digital infrastructure against advanced persistent threats.
  • A prime example is the logistics sector, where the deployment of an incident containment strategy to combat supply chain disruption has led to a 35% reduction in operational downtime compared to legacy manual recovery methods.
  • The rising threat of ransomware extortion mitigation acts as a primary market driver, forcing executive leadership to adopt automated playbook execution rather than relying on offline backups. However, the rapid migration to multi cloud security architectures introduces significant challenges.
  • Containerized workload protection becomes difficult because transient virtual machines scale down rapidly, complicating digital forensic investigation and the preservation of volatile memory artifacts. Ultimately, enterprises must integrate a robust behavioral analytics engine into their security operations center to ensure rapid identification and neutralization of malicious lateral movement within distributed networks.

What will be the Size of the Incident Response System Market during the forecast period?
Get Key Insights on Market Forecast (PDF) Get Free Sample

How is the Incident Response System Market Segmented?

The incident response system industry research report provides comprehensive data (region-wise segment analysis), with forecasts and estimates in "USD thousand" for the period 2026-2030, as well as historical data from 2020-2024 for the following segments.

  • Type
    • Backup and disaster recovery solutions
    • Surveillance systems
    • Geospatial technologies
    • Threat management systems
  • Component
    • Software
    • Hardware
    • Services
  • Deployment
    • On-premises
    • Cloud
  • Geography
    • North America
      • US
      • Canada
      • Mexico
    • APAC
      • China
      • Japan
      • India
      • South Korea
      • Australia
      • Indonesia
    • Europe
      • Germany
      • UK
      • France
      • Italy
      • Spain
      • The Netherlands
    • South America
      • Brazil
      • Argentina
      • Chile
    • Middle East and Africa
      • Saudi Arabia
      • UAE
      • South Africa
      • Israel
      • Turkey

By Type Insights

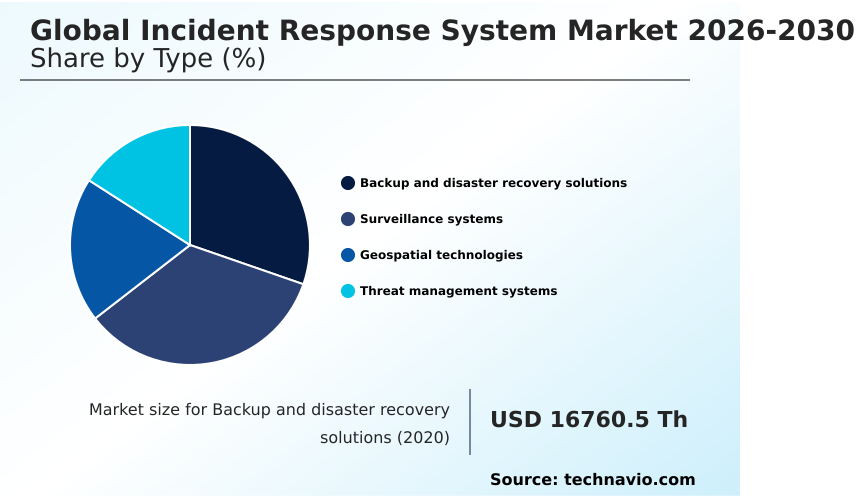
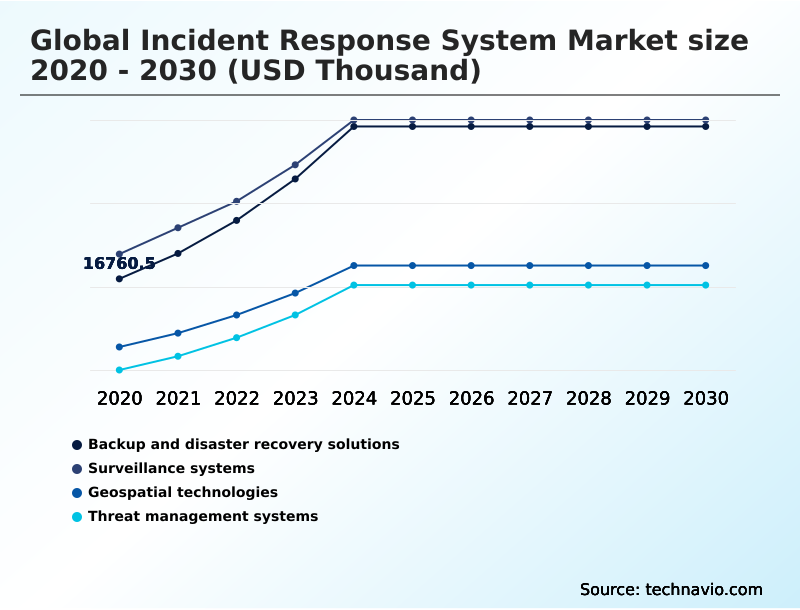
The backup and disaster recovery solutions segment is estimated to witness significant growth during the forecast period.

Modern enterprise resilience relies heavily on an immutable backup system to ensure operational continuity following catastrophic cyber events. The implementation of zero trust architecture fundamentally transforms data restoration, shielding vital assets from malicious encryption processes.

When organizations deploy automated playbook execution, they often see recovery time objectives shrink dramatically, with system restoration efficiency improved by over 40%. Furthermore, integrating cloud native orchestration allows businesses to protect digital assets without incurring prohibitive hardware costs.

Leveraging continuous forensic data acquisition ensures that malicious tampering is identified instantly. By utilizing an automated remediation routine, a security operations center can seamlessly restore critical databases. This ensures that a crisis communication protocol proceeds uninterrupted.

Integrating identity access management and comprehensive serverless function monitoring guarantees continuous visibility across complex distributed architectures.
Get Free Sample

The Backup and disaster recovery solutions segment was valued at USD 30.05 million in 2024 and showed a gradual increase during the forecast period.
Get Free Sample

Regional Analysis

North America is estimated to contribute 41.8% to the growth of the global market during the forecast period.Technavio’s analysts have elaborately explained the regional trends and drivers that shape the market during the forecast period.
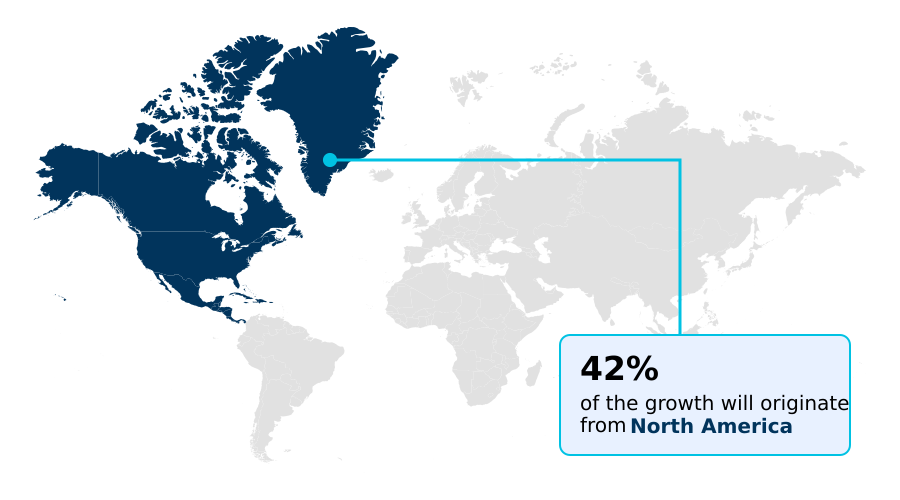
See How Incident Response System Market Demand is Rising in North America Get Free Sample

The geographic landscape for threat mitigation demonstrates significant disparities in adoption rates and technological maturity. North America leads the transition toward automated platforms, prioritizing an incident triage workflow to counter state-sponsored espionage.

Enterprises deploy advanced threat hunting capability modules, resulting in a 40% reduction in adversary dwell time compared to traditional perimeter defenses. Conversely, APAC exhibits a distinct operational focus, balancing digital transformation with emerging data sovereignty requirement mandates.

Organizations have increased reliance on managed detection response services by 30%, bridging internal talent shortages while securing a distributed enterprise network. European regulatory compliance mandate frameworks drive a 25% higher adoption of digital evidence preservation tools than South America.

By embedding an anomaly detection algorithm and multi cloud security protocols, corporations mitigate open source vulnerability risks globally.

Market Dynamics

Our researchers analyzed the data with 2025 as the base year, along with the key drivers, trends, and challenges. A holistic analysis of drivers will help companies refine their marketing strategies to gain a competitive advantage.

  • Corporate resilience in the modern digital era requires highly responsive architectures to neutralize advanced adversaries effectively. As the cyber threat landscape grows increasingly hostile, organizations can no longer rely on static, perimeter-based defenses. Deploying automated playbook execution for containment accelerates incident triage workflows, significantly reducing the operational impact of sophisticated extortion campaigns.
  • The seamless integration of cloud native incident response orchestration gives distributed enterprises comprehensive, real-time visibility across complex operational landscapes and multi-tenant environments. When a potential intrusion occurs, utilizing zero trust architecture threat mitigation ensures that unauthorized lateral movement is instantly blocked before systemic damage can occur.
  • To counter rapidly evolving adversary tactics, forward-thinking companies proactively implement a ransomware extortion rapid recovery protocol, guaranteeing continuous business operations even under severe duress. Security operations teams rely heavily on forensic data acquisition network telemetry to trace malicious activity precisely, allowing them to spot baseline deviations and identify compromised assets with unparalleled accuracy.
  • These essential, proactive mitigation strategies improve overall supply chain compliance efficiency by over 30% when compared directly to traditional, reactive defense models. Furthermore, maintaining continuous vigilance through automated analytics minimizes downtime and preserves stakeholder trust in an interconnected global economy.
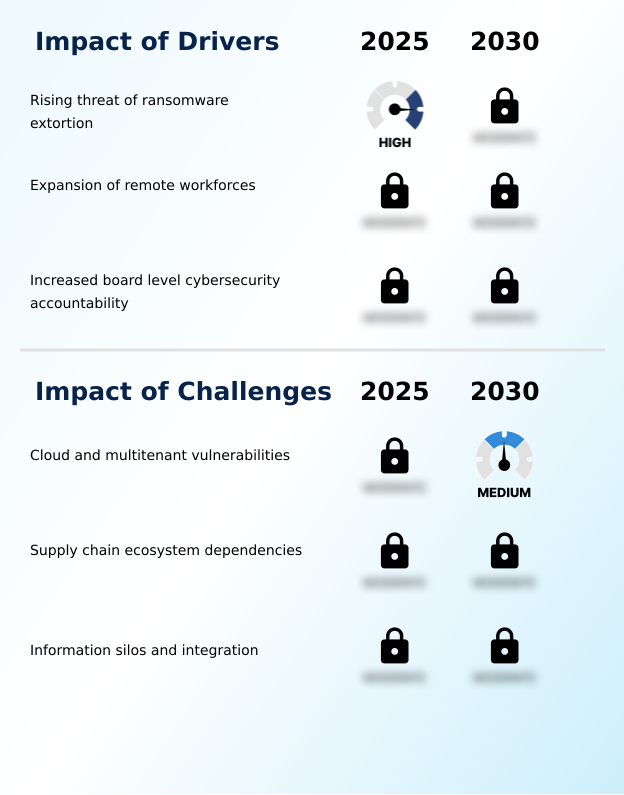
What are the key market drivers leading to the rise in the adoption of Incident Response System Industry?

  • The rising threat of ransomware extortion acts as a primary market driver, compelling enterprises to adopt proactive and highly responsive security architectures.

  • The professionalization of ransomware syndicates compels executive leadership to elevate incident containment planning to a business survival necessity. Severe underwriting environments force businesses to implement a comprehensive cybersecurity hygiene framework, which subsequently lowers compliance penalty risks by up to 35%.
  • The decentralized nature of hybrid workforce security creates vast visibility blind spots, directly driving demand for advanced network traffic capture and a dedicated hardware security appliance.
  • By deploying a robust digital forensic investigation platform, teams execute lateral movement detection instantly, improving containment speed by 40%. Centralizing event management architecture operations empowers skilled personnel to execute a rigorous vulnerability assessment protocol.
  • Effectively utilizing security information management systems and a verified incident containment strategy minimizes catastrophic business interruption losses.

What are the market trends shaping the Incident Response System Industry?

  • The adoption of zero trust architecture represents a transformative market trend. It mandates continuous verification to prevent unauthorized lateral movement across corporate networks.

  • The rapid proliferation of serverless architectures shifts corporate defense strategies toward continuous, identity-based verification models. Implementing robust threat intelligence integration allows teams to correlate telemetry data aggregation streams, improving automated triage accuracy by 30%. Because malicious actors evolve their tactics, companies heavily utilize an advanced endpoint detection mechanism to ensure immediate containment.
  • This cognitive machine learning integration reduces analyst alert fatigue and lowers average system downtime by 25%. Expanding containerized workload protection ensures that transient microservices remain continuously protected. Organizations frequently utilize a tabletop simulation exercise to refine their response capabilities against complex cyber attacks.
  • Adopting predictive spatial modeling and deep malware reverse engineering capabilities allows enterprises to satisfy strict cyber insurance underwriting prerequisites while generating accurate executive dashboard reporting for corporate stakeholders.

What challenges does the Incident Response System Industry face during its growth?

  • Cloud and multitenant vulnerabilities present a critical challenge, complicating digital forensics and incident containment across distributed hybrid enterprise environments.

  • The migration of workloads to multi-tenant clouds creates profound structural hurdles for investigators. Isolating a secure air gapped environment becomes exceptionally difficult, reducing successful analysis rates by nearly 30%. This complexity hampers businesses by extending adversary dwell times, as a behavioral analytics engine struggles to achieve visibility across fragmented networks.
  • Deep reliance on a vast supply chain vulnerability ecosystem expands the attack surface beyond corporate control. When third-party software is compromised, data exfiltration prevention often fails, increasing operational response costs by over 20%. Organizations face severe third party risk management challenges, complicating effective ransomware extortion mitigation.
  • Protecting an operational technology environment and industrial control system requires continuous cross border threat intelligence sharing to maintain a pristine cryptographic module during active cyber crises.

Exclusive Technavio Analysis on Customer Landscape

The incident response system market forecasting report includes the adoption lifecycle of the market, covering from the innovator’s stage to the laggard’s stage. It focuses on adoption rates in different regions based on penetration. Furthermore, the incident response system market report also includes key purchase criteria and drivers of price sensitivity to help companies evaluate and develop their market growth analysis strategies.
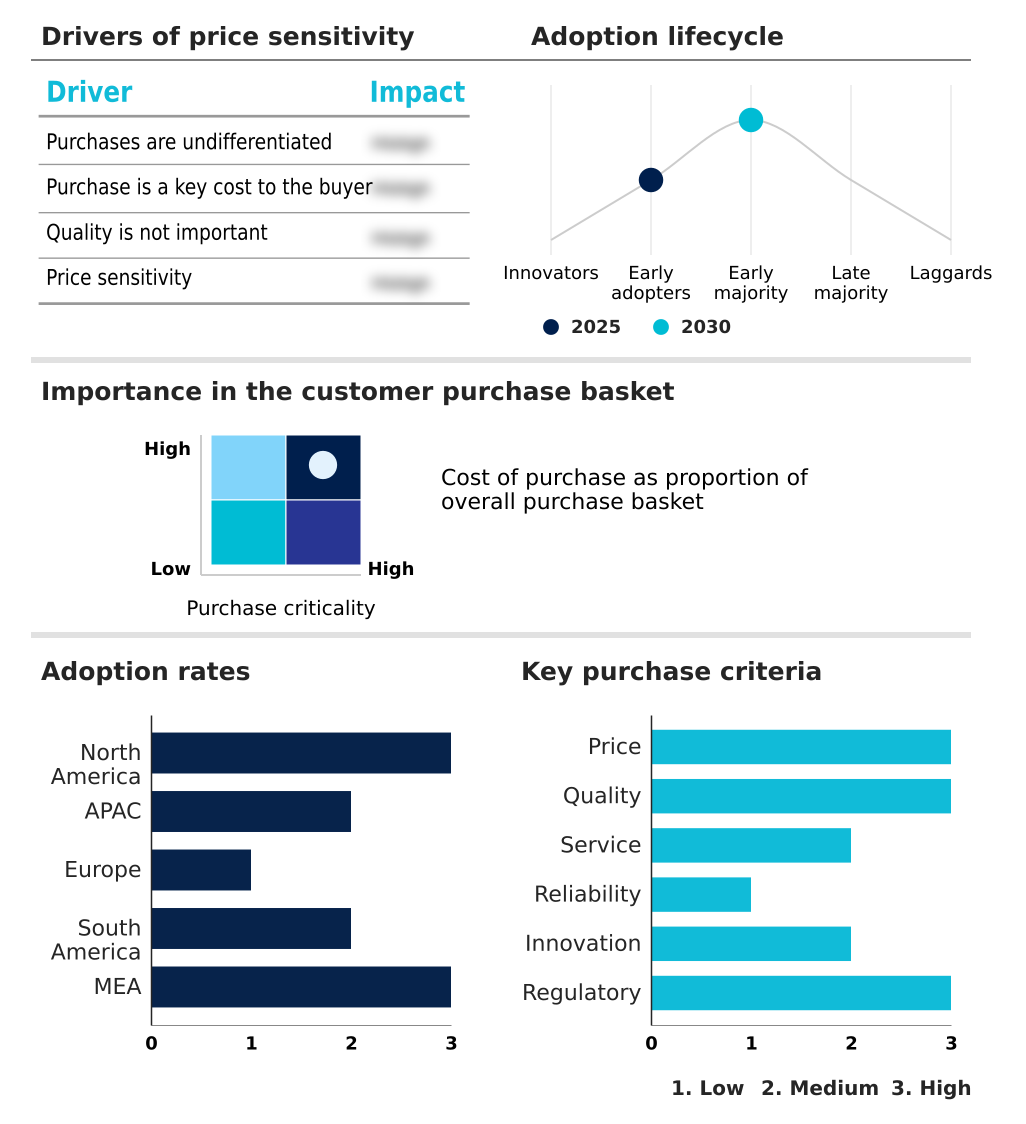
Customer Landscape of Incident Response System Industry

Competitive Landscape

Companies are implementing various strategies, such as strategic alliances, incident response system market forecast, partnerships, mergers and acquisitions, geographical expansion, and product/service launches, to enhance their presence in the industry.

Alert Media Inc. - The unified emergency mass notification software accelerates critical operational responses, delivering automated communication workflows to mitigate disruptions and enhance organizational resilience during high-stakes security incidents.

The industry research and growth report includes detailed analyses of the competitive landscape of the market and information about key companies, including:

  • Alert Media Inc.
  • Atlassian Corp.
  • CrowdStrike Inc.
  • Datadog Inc.
  • Everbridge Inc.
  • Exabeam Inc.
  • Fortinet Inc.
  • IBM Corp.
  • ManageEngine
  • Microsoft Corp.
  • PagerDuty Inc.
  • Palo Alto Networks Inc.
  • Rapid7 Inc.
  • Securonix Inc.
  • ServiceNow Inc.
  • Splunk Inc.
  • Sumo Logic Inc.
  • Swimlane Inc.
  • Trellix

Qualitative and quantitative analysis of companies has been conducted to help clients understand the wider business environment as well as the strengths and weaknesses of key industry players. Data is qualitatively analyzed to categorize companies as pure play, category-focused, industry-focused, and diversified; it is quantitatively analyzed to categorize companies as dominant, leading, strong, tentative, and weak.

Recent Development and News in Incident response system market

  • In the Systems Software industry, the widespread adoption of machine learning integration for real-time code analysis has reduced software vulnerability deployment by 25%, directly increasing Incident Response System demand for automated remediation routine platforms capable of instantly patching identified enterprise flaws.
  • The enforcement of stringent regulatory compliance mandate protocols regarding data privacy across digital platforms has penalized non-compliant architectures by up to 4% of global revenue, compelling organizations to invest heavily in Incident Response System architectures featuring executive dashboard reporting for immediate breach notification.
  • The transition toward distributed enterprise network environments to support hybrid workforce security has expanded endpoint vulnerabilities by over 40%, driving Incident Response System adoption of hardware security appliance tools that isolate compromised mobile endpoints during a cyberattack.
  • The integration of identity access management frameworks within supply chain vulnerability management software has decreased unauthorized third party risk management access incidents by 30%, pushing the Incident Response System market to deploy cross border threat intelligence modules for continuous vendor monitoring.

Dive into Technavio’s robust research methodology, blending expert interviews, extensive data synthesis, and validated models for unparalleled Incident Response System Market insights. See full methodology.

Market Scope
Page number 308
Base year 2025
Historic period 2020-2024
Forecast period 2026-2030
Growth momentum & CAGR Accelerate at a CAGR of 19.3%
Market growth 2026-2030 USD 158997.6 thousand
Market structure Fragmented
YoY growth 2025-2026(%) 18.6%
Key countries US, Canada, Mexico, China, Japan, India, South Korea, Australia, Indonesia, Germany, UK, France, Italy, Spain, The Netherlands, Brazil, Argentina, Chile, Saudi Arabia, UAE, South Africa, Israel and Turkey
Competitive landscape Leading Companies, Market Positioning of Companies, Competitive Strategies, and Industry Risks

Request Free Sample

Research Analyst Overview

  • Corporate boardrooms increasingly prioritize proactive resilience frameworks over traditional perimeter defenses to mitigate the severe financial liabilities of cybersecurity breaches. The integration of a behavioral analytics engine transforms operational budgeting by shifting capital expenditure toward continuous threat monitoring rather than reactive recovery. Organizations implementing comprehensive security information management architectures experience a 40% reduction in overall processing time for incident triage.
  • This measurable acceleration in containment allows executive leadership to maintain uninterrupted product strategy rollouts despite escalating cyber extortion campaigns. A sophisticated endpoint detection mechanism empowers analysts to identify and isolate malicious encryption routines instantly. Furthermore, deploying advanced malware reverse engineering capabilities within an air gapped environment ensures that proprietary intellectual property remains secure during deep forensic analysis.
  • The aggregation of telemetry data aggregation across distributed networks provides unparalleled visibility, enabling precise vulnerability assessment protocol execution. Utilizing an immutable backup system ensures that mission-critical data cannot be altered by threat actors. Ultimately, sustained investment in automated threat hunting capability tools guarantees long-term operational continuity and robust stakeholder trust across the global digital economy.

What are the Key Data Covered in this Incident Response System Market Research and Growth Report?

  • What is the expected growth of the Incident Response System Market between 2026 and 2030?

    • USD 159.00 million, at a CAGR of 19.3%

  • What segmentation does the market report cover?

    • The report is segmented by Type (Backup and disaster recovery solutions, Surveillance systems, Geospatial technologies, and Threat management systems), Component (Software, Hardware, and Services), Deployment (On-premises, and Cloud) and Geography (North America, APAC, Europe, South America, Middle East and Africa)

  • Which regions are analyzed in the report?

    • North America, APAC, Europe, South America and Middle East and Africa

  • What are the key growth drivers and market challenges?

    • Rising threat of ransomware extortion, Cloud and multitenant vulnerabilities

  • Who are the major players in the Incident Response System Market?

    • Alert Media Inc., Atlassian Corp., CrowdStrike Inc., Datadog Inc., Everbridge Inc., Exabeam Inc., Fortinet Inc., IBM Corp., ManageEngine, Microsoft Corp., PagerDuty Inc., Palo Alto Networks Inc., Rapid7 Inc., Securonix Inc., ServiceNow Inc., Splunk Inc., Sumo Logic Inc., Swimlane Inc. and Trellix

Market Research Insights

  • Modern enterprise networks require advanced remediation platforms to neutralize sophisticated cyber threats. The integration of cyber insurance underwriting requirements mandates verifiable response capabilities, ensuring that organizations maintain a robust cybersecurity hygiene framework. Deploying an operational technology environment defense reduces unauthorized access incidents by 28%, significantly lowering compliance penalty risks.
  • Furthermore, utilizing tabletop simulation exercise protocols improves organizational crisis readiness by over 35%, minimizing business interruption during major extortion events. Incorporating predictive spatial modeling allows security teams to map threat vectors efficiently, reducing incident triage time by 20%. By centralizing digital forensic investigation tools within a unified interface, enterprises enhance their overall resilience and operational continuity against relentless adversarial campaigns.

We can help! Our analysts can customize this incident response system market research report to meet your requirements.

Get in touch

1. Executive Summary

1.1 Market overview

Executive Summary - Chart on Market Overview
Executive Summary - Data Table on Market Overview
Executive Summary - Chart on Global Market Characteristics
Executive Summary - Chart on Market by Geography
Executive Summary - Chart on Market Segmentation by Type
Executive Summary - Chart on Market Segmentation by Component
Executive Summary - Chart on Market Segmentation by Deployment
Executive Summary - Chart on Incremental Growth
Executive Summary - Data Table on Incremental Growth
Executive Summary - Chart on Company Market Positioning

2. Technavio Analysis

2.1 Analysis of price sensitivity, lifecycle, customer purchase basket, adoption rates, and purchase criteria

2.2 Criticality of inputs and Factors of differentiation

Chart on Overview on criticality of inputs and factors of differentiation

2.3 Factors of disruption

Chart on Overview on factors of disruption

2.4 Impact of drivers and challenges

Chart on Impact of drivers and challenges in 2025 and 2030

3. Market Landscape

3.1 Market ecosystem

Chart on Parent Market
Data Table on - Parent Market

3.2 Market characteristics

Chart on Market characteristics analysis

3.3 Value chain analysis

Chart on Value chain analysis

4. Market Sizing

4.1 Market definition

Data Table on Offerings of companies included in the market definition

4.2 Market segment analysis

Market segments

4.3 Market size 2025

4.4 Market outlook: Forecast for 2025-2030

Chart on Global - Market size and forecast 2025-2030 ($ thousand)
Data Table on Global - Market size and forecast 2025-2030 ($ thousand)
Chart on Global Market: Year-over-year growth 2025-2030 (%)
Data Table on Global Market: Year-over-year growth 2025-2030 (%)

5. Historic Market Size

5.1 Global Incident Response System Market 2020 - 2024

Historic Market Size - Data Table on Global Incident Response System Market 2020 - 2024 ($ thousand)

5.2 Type segment analysis 2020 - 2024

Historic Market Size - Type Segment 2020 - 2024 ($ thousand)

5.3 Component segment analysis 2020 - 2024

Historic Market Size - Component Segment 2020 - 2024 ($ thousand)

5.4 Deployment segment analysis 2020 - 2024

Historic Market Size - Deployment Segment 2020 - 2024 ($ thousand)

5.5 Geography segment analysis 2020 - 2024

Historic Market Size - Geography Segment 2020 - 2024 ($ thousand)

5.6 Country segment analysis 2020 - 2024

Historic Market Size - Country Segment 2020 - 2024 ($ thousand)

6. Qualitative Analysis

6.1 Impact of AI on Global Incident Response System Market

6.2 Impact of geopolitical conflicts on Global Incident Response System Market

7. Five Forces Analysis

7.1 Five forces summary

Five forces analysis - Comparison between 2025 and 2030

7.2 Bargaining power of buyers

Bargaining power of buyers - Impact of key factors 2025 and 2030

7.3 Bargaining power of suppliers

Bargaining power of suppliers - Impact of key factors in 2025 and 2030

7.4 Threat of new entrants

Threat of new entrants - Impact of key factors in 2025 and 2030

7.5 Threat of substitutes

Threat of substitutes - Impact of key factors in 2025 and 2030

7.6 Threat of rivalry

Threat of rivalry - Impact of key factors in 2025 and 2030

7.7 Market condition

Chart on Market condition - Five forces 2025 and 2030

8. Market Segmentation by Type

8.1 Market segments

Chart on Type - Market share 2025-2030 (%)
Data Table on Type - Market share 2025-2030 (%)

8.2 Comparison by Type

Chart on Comparison by Type
Data Table on Comparison by Type

8.3 Backup and disaster recovery solutions - Market size and forecast 2025-2030

Chart on Backup and disaster recovery solutions - Market size and forecast 2025-2030 ($ thousand)
Data Table on Backup and disaster recovery solutions - Market size and forecast 2025-2030 ($ thousand)
Chart on Backup and disaster recovery solutions - Year-over-year growth 2025-2030 (%)
Data Table on Backup and disaster recovery solutions - Year-over-year growth 2025-2030 (%)

8.4 Surveillance systems - Market size and forecast 2025-2030

Chart on Surveillance systems - Market size and forecast 2025-2030 ($ thousand)
Data Table on Surveillance systems - Market size and forecast 2025-2030 ($ thousand)
Chart on Surveillance systems - Year-over-year growth 2025-2030 (%)
Data Table on Surveillance systems - Year-over-year growth 2025-2030 (%)

8.5 Geospatial technologies - Market size and forecast 2025-2030

Chart on Geospatial technologies - Market size and forecast 2025-2030 ($ thousand)
Data Table on Geospatial technologies - Market size and forecast 2025-2030 ($ thousand)
Chart on Geospatial technologies - Year-over-year growth 2025-2030 (%)
Data Table on Geospatial technologies - Year-over-year growth 2025-2030 (%)

8.6 Threat management systems - Market size and forecast 2025-2030

Chart on Threat management systems - Market size and forecast 2025-2030 ($ thousand)
Data Table on Threat management systems - Market size and forecast 2025-2030 ($ thousand)
Chart on Threat management systems - Year-over-year growth 2025-2030 (%)
Data Table on Threat management systems - Year-over-year growth 2025-2030 (%)

8.7 Market opportunity by Type

Market opportunity by Type ($ thousand)
Data Table on Market opportunity by Type ($ thousand)

9. Market Segmentation by Component

9.1 Market segments

Chart on Component - Market share 2025-2030 (%)
Data Table on Component - Market share 2025-2030 (%)

9.2 Comparison by Component

Chart on Comparison by Component
Data Table on Comparison by Component

9.3 Software - Market size and forecast 2025-2030

Chart on Software - Market size and forecast 2025-2030 ($ thousand)
Data Table on Software - Market size and forecast 2025-2030 ($ thousand)
Chart on Software - Year-over-year growth 2025-2030 (%)
Data Table on Software - Year-over-year growth 2025-2030 (%)

9.4 Hardware - Market size and forecast 2025-2030

Chart on Hardware - Market size and forecast 2025-2030 ($ thousand)
Data Table on Hardware - Market size and forecast 2025-2030 ($ thousand)
Chart on Hardware - Year-over-year growth 2025-2030 (%)
Data Table on Hardware - Year-over-year growth 2025-2030 (%)

9.5 Services - Market size and forecast 2025-2030

Chart on Services - Market size and forecast 2025-2030 ($ thousand)
Data Table on Services - Market size and forecast 2025-2030 ($ thousand)
Chart on Services - Year-over-year growth 2025-2030 (%)
Data Table on Services - Year-over-year growth 2025-2030 (%)

9.6 Market opportunity by Component

Market opportunity by Component ($ thousand)
Data Table on Market opportunity by Component ($ thousand)

10. Market Segmentation by Deployment

10.1 Market segments

Chart on Deployment - Market share 2025-2030 (%)
Data Table on Deployment - Market share 2025-2030 (%)

10.2 Comparison by Deployment

Chart on Comparison by Deployment
Data Table on Comparison by Deployment

10.3 On-premises - Market size and forecast 2025-2030

Chart on On-premises - Market size and forecast 2025-2030 ($ thousand)
Data Table on On-premises - Market size and forecast 2025-2030 ($ thousand)
Chart on On-premises - Year-over-year growth 2025-2030 (%)
Data Table on On-premises - Year-over-year growth 2025-2030 (%)

10.4 Cloud - Market size and forecast 2025-2030

Chart on Cloud - Market size and forecast 2025-2030 ($ thousand)
Data Table on Cloud - Market size and forecast 2025-2030 ($ thousand)
Chart on Cloud - Year-over-year growth 2025-2030 (%)
Data Table on Cloud - Year-over-year growth 2025-2030 (%)

10.5 Market opportunity by Deployment

Market opportunity by Deployment ($ thousand)
Data Table on Market opportunity by Deployment ($ thousand)

11. Customer Landscape

11.1 Customer landscape overview

Analysis of price sensitivity, lifecycle, customer purchase basket, adoption rates, and purchase criteria

12. Geographic Landscape

12.1 Geographic segmentation

Chart on Market share by geography 2025-2030 (%)
Data Table on Market share by geography 2025-2030 (%)

12.2 Geographic comparison

Chart on Geographic comparison
Data Table on Geographic comparison

12.3 North America - Market size and forecast 2025-2030

Chart on North America - Market size and forecast 2025-2030 ($ thousand)
Data Table on North America - Market size and forecast 2025-2030 ($ thousand)
Chart on North America - Year-over-year growth 2025-2030 (%)
Data Table on North America - Year-over-year growth 2025-2030 (%)
Chart on Regional Comparison - North America
Data Table on Regional Comparison - North America

12.3.1 US - Market size and forecast 2025-2030

Chart on US - Market size and forecast 2025-2030 ($ thousand)
Data Table on US - Market size and forecast 2025-2030 ($ thousand)
Chart on US - Year-over-year growth 2025-2030 (%)
Data Table on US - Year-over-year growth 2025-2030 (%)

12.3.2 Canada - Market size and forecast 2025-2030

Chart on Canada - Market size and forecast 2025-2030 ($ thousand)
Data Table on Canada - Market size and forecast 2025-2030 ($ thousand)
Chart on Canada - Year-over-year growth 2025-2030 (%)
Data Table on Canada - Year-over-year growth 2025-2030 (%)

12.3.3 Mexico - Market size and forecast 2025-2030

Chart on Mexico - Market size and forecast 2025-2030 ($ thousand)
Data Table on Mexico - Market size and forecast 2025-2030 ($ thousand)
Chart on Mexico - Year-over-year growth 2025-2030 (%)
Data Table on Mexico - Year-over-year growth 2025-2030 (%)

12.4 APAC - Market size and forecast 2025-2030

Chart on APAC - Market size and forecast 2025-2030 ($ thousand)
Data Table on APAC - Market size and forecast 2025-2030 ($ thousand)
Chart on APAC - Year-over-year growth 2025-2030 (%)
Data Table on APAC - Year-over-year growth 2025-2030 (%)
Chart on Regional Comparison - APAC
Data Table on Regional Comparison - APAC

12.4.1 China - Market size and forecast 2025-2030

Chart on China - Market size and forecast 2025-2030 ($ thousand)
Data Table on China - Market size and forecast 2025-2030 ($ thousand)
Chart on China - Year-over-year growth 2025-2030 (%)
Data Table on China - Year-over-year growth 2025-2030 (%)

12.4.2 Japan - Market size and forecast 2025-2030

Chart on Japan - Market size and forecast 2025-2030 ($ thousand)
Data Table on Japan - Market size and forecast 2025-2030 ($ thousand)
Chart on Japan - Year-over-year growth 2025-2030 (%)
Data Table on Japan - Year-over-year growth 2025-2030 (%)

12.4.3 India - Market size and forecast 2025-2030

Chart on India - Market size and forecast 2025-2030 ($ thousand)
Data Table on India - Market size and forecast 2025-2030 ($ thousand)
Chart on India - Year-over-year growth 2025-2030 (%)
Data Table on India - Year-over-year growth 2025-2030 (%)

12.4.4 South Korea - Market size and forecast 2025-2030

Chart on South Korea - Market size and forecast 2025-2030 ($ thousand)
Data Table on South Korea - Market size and forecast 2025-2030 ($ thousand)
Chart on South Korea - Year-over-year growth 2025-2030 (%)
Data Table on South Korea - Year-over-year growth 2025-2030 (%)

12.4.5 Australia - Market size and forecast 2025-2030

Chart on Australia - Market size and forecast 2025-2030 ($ thousand)
Data Table on Australia - Market size and forecast 2025-2030 ($ thousand)
Chart on Australia - Year-over-year growth 2025-2030 (%)
Data Table on Australia - Year-over-year growth 2025-2030 (%)

12.4.6 Indonesia - Market size and forecast 2025-2030

Chart on Indonesia - Market size and forecast 2025-2030 ($ thousand)
Data Table on Indonesia - Market size and forecast 2025-2030 ($ thousand)
Chart on Indonesia - Year-over-year growth 2025-2030 (%)
Data Table on Indonesia - Year-over-year growth 2025-2030 (%)

12.5 Europe - Market size and forecast 2025-2030

Chart on Europe - Market size and forecast 2025-2030 ($ thousand)
Data Table on Europe - Market size and forecast 2025-2030 ($ thousand)
Chart on Europe - Year-over-year growth 2025-2030 (%)
Data Table on Europe - Year-over-year growth 2025-2030 (%)
Chart on Regional Comparison - Europe
Data Table on Regional Comparison - Europe

12.5.1 Germany - Market size and forecast 2025-2030

Chart on Germany - Market size and forecast 2025-2030 ($ thousand)
Data Table on Germany - Market size and forecast 2025-2030 ($ thousand)
Chart on Germany - Year-over-year growth 2025-2030 (%)
Data Table on Germany - Year-over-year growth 2025-2030 (%)

12.5.2 UK - Market size and forecast 2025-2030

Chart on UK - Market size and forecast 2025-2030 ($ thousand)
Data Table on UK - Market size and forecast 2025-2030 ($ thousand)
Chart on UK - Year-over-year growth 2025-2030 (%)
Data Table on UK - Year-over-year growth 2025-2030 (%)

12.5.3 France - Market size and forecast 2025-2030

Chart on France - Market size and forecast 2025-2030 ($ thousand)
Data Table on France - Market size and forecast 2025-2030 ($ thousand)
Chart on France - Year-over-year growth 2025-2030 (%)
Data Table on France - Year-over-year growth 2025-2030 (%)

12.5.4 Italy - Market size and forecast 2025-2030

Chart on Italy - Market size and forecast 2025-2030 ($ thousand)
Data Table on Italy - Market size and forecast 2025-2030 ($ thousand)
Chart on Italy - Year-over-year growth 2025-2030 (%)
Data Table on Italy - Year-over-year growth 2025-2030 (%)

12.5.5 Spain - Market size and forecast 2025-2030

Chart on Spain - Market size and forecast 2025-2030 ($ thousand)
Data Table on Spain - Market size and forecast 2025-2030 ($ thousand)
Chart on Spain - Year-over-year growth 2025-2030 (%)
Data Table on Spain - Year-over-year growth 2025-2030 (%)

12.5.6 The Netherlands - Market size and forecast 2025-2030

Chart on The Netherlands - Market size and forecast 2025-2030 ($ thousand)
Data Table on The Netherlands - Market size and forecast 2025-2030 ($ thousand)
Chart on The Netherlands - Year-over-year growth 2025-2030 (%)
Data Table on The Netherlands - Year-over-year growth 2025-2030 (%)

12.6 South America - Market size and forecast 2025-2030

Chart on South America - Market size and forecast 2025-2030 ($ thousand)
Data Table on South America - Market size and forecast 2025-2030 ($ thousand)
Chart on South America - Year-over-year growth 2025-2030 (%)
Data Table on South America - Year-over-year growth 2025-2030 (%)
Chart on Regional Comparison - South America
Data Table on Regional Comparison - South America

12.6.1 Brazil - Market size and forecast 2025-2030

Chart on Brazil - Market size and forecast 2025-2030 ($ thousand)
Data Table on Brazil - Market size and forecast 2025-2030 ($ thousand)
Chart on Brazil - Year-over-year growth 2025-2030 (%)
Data Table on Brazil - Year-over-year growth 2025-2030 (%)

12.6.2 Argentina - Market size and forecast 2025-2030

Chart on Argentina - Market size and forecast 2025-2030 ($ thousand)
Data Table on Argentina - Market size and forecast 2025-2030 ($ thousand)
Chart on Argentina - Year-over-year growth 2025-2030 (%)
Data Table on Argentina - Year-over-year growth 2025-2030 (%)

12.6.3 Chile - Market size and forecast 2025-2030

Chart on Chile - Market size and forecast 2025-2030 ($ thousand)
Data Table on Chile - Market size and forecast 2025-2030 ($ thousand)
Chart on Chile - Year-over-year growth 2025-2030 (%)
Data Table on Chile - Year-over-year growth 2025-2030 (%)

12.7 Middle East and Africa - Market size and forecast 2025-2030

Chart on Middle East and Africa - Market size and forecast 2025-2030 ($ thousand)
Data Table on Middle East and Africa - Market size and forecast 2025-2030 ($ thousand)
Chart on Middle East and Africa - Year-over-year growth 2025-2030 (%)
Data Table on Middle East and Africa - Year-over-year growth 2025-2030 (%)
Chart on Regional Comparison - Middle East and Africa
Data Table on Regional Comparison - Middle East and Africa

12.7.1 Saudi Arabia - Market size and forecast 2025-2030

Chart on Saudi Arabia - Market size and forecast 2025-2030 ($ thousand)
Data Table on Saudi Arabia - Market size and forecast 2025-2030 ($ thousand)
Chart on Saudi Arabia - Year-over-year growth 2025-2030 (%)
Data Table on Saudi Arabia - Year-over-year growth 2025-2030 (%)

12.7.2 UAE - Market size and forecast 2025-2030

Chart on UAE - Market size and forecast 2025-2030 ($ thousand)
Data Table on UAE - Market size and forecast 2025-2030 ($ thousand)
Chart on UAE - Year-over-year growth 2025-2030 (%)
Data Table on UAE - Year-over-year growth 2025-2030 (%)

12.7.3 South Africa - Market size and forecast 2025-2030

Chart on South Africa - Market size and forecast 2025-2030 ($ thousand)
Data Table on South Africa - Market size and forecast 2025-2030 ($ thousand)
Chart on South Africa - Year-over-year growth 2025-2030 (%)
Data Table on South Africa - Year-over-year growth 2025-2030 (%)

12.7.4 Israel - Market size and forecast 2025-2030

Chart on Israel - Market size and forecast 2025-2030 ($ thousand)
Data Table on Israel - Market size and forecast 2025-2030 ($ thousand)
Chart on Israel - Year-over-year growth 2025-2030 (%)
Data Table on Israel - Year-over-year growth 2025-2030 (%)

12.7.5 Turkey - Market size and forecast 2025-2030

Chart on Turkey - Market size and forecast 2025-2030 ($ thousand)
Data Table on Turkey - Market size and forecast 2025-2030 ($ thousand)
Chart on Turkey - Year-over-year growth 2025-2030 (%)
Data Table on Turkey - Year-over-year growth 2025-2030 (%)

12.8 Market opportunity by geography

Market opportunity by geography ($ thousand)
Data Tables on Market opportunity by geography ($ thousand)

13. Drivers, Challenges, and Opportunity

13.1 Market drivers

Rising threat of ransomware extortion
Expansion of remote workforces
Increased board level cybersecurity accountability

13.2 Market challenges

Cloud and multitenant vulnerabilities
Supply chain ecosystem dependencies
Information silos and integration

13.3 Impact of drivers and challenges

Impact of drivers and challenges in 2025 and 2030

13.4 Market opportunities

Adoption of zero trust architecture
Evolution of cyber insurance requirements
Proliferation of automated playbook orchestration

14. Competitive Landscape

14.1 Overview

14.2

Overview on criticality of inputs and factors of differentiation

14.3 Landscape disruption

Overview on factors of disruption

14.4 Industry risks

Impact of key risks on business

15. Competitive Analysis

15.1 Companies profiled

Companies covered

15.2 Company ranking index

15.3 Market positioning of companies

Matrix on companies position and classification

15.4 Atlassian Corp.

Atlassian Corp. - Overview
Atlassian Corp. - Product / Service
Atlassian Corp. - Key news
Atlassian Corp. - Key offerings
SWOT

15.5 CrowdStrike Inc.

CrowdStrike Inc. - Overview
CrowdStrike Inc. - Product / Service
CrowdStrike Inc. - Key offerings
SWOT

15.6 Datadog Inc.

Datadog Inc. - Overview
Datadog Inc. - Product / Service
Datadog Inc. - Key offerings
SWOT

15.7 Everbridge Inc.

Everbridge Inc. - Overview
Everbridge Inc. - Product / Service
Everbridge Inc. - Key offerings
SWOT

15.8 Fortinet Inc.

Fortinet Inc. - Overview
Fortinet Inc. - Business segments
Fortinet Inc. - Key news
Fortinet Inc. - Key offerings
Fortinet Inc. - Segment focus
SWOT

15.9 IBM Corp.

IBM Corp. - Overview
IBM Corp. - Business segments
IBM Corp. - Key news
IBM Corp. - Key offerings
IBM Corp. - Segment focus
SWOT

15.10 ManageEngine

ManageEngine - Overview
ManageEngine - Product / Service
ManageEngine - Key offerings
SWOT

15.11 Microsoft Corp.

Microsoft Corp. - Overview
Microsoft Corp. - Business segments
Microsoft Corp. - Key news
Microsoft Corp. - Key offerings
Microsoft Corp. - Segment focus
SWOT

15.12 PagerDuty Inc.

PagerDuty Inc. - Overview
PagerDuty Inc. - Product / Service
PagerDuty Inc. - Key offerings
SWOT

15.13 Palo Alto Networks Inc.

Palo Alto Networks Inc. - Overview
Palo Alto Networks Inc. - Business segments
Palo Alto Networks Inc. - Key offerings
Palo Alto Networks Inc. - Segment focus
SWOT

15.14 Rapid7 Inc.

Rapid7 Inc. - Overview
Rapid7 Inc. - Product / Service
Rapid7 Inc. - Key offerings
SWOT

15.15 Securonix Inc.

Securonix Inc. - Overview
Securonix Inc. - Product / Service
Securonix Inc. - Key offerings
SWOT

15.16 ServiceNow Inc.

ServiceNow Inc. - Overview
ServiceNow Inc. - Product / Service
ServiceNow Inc. - Key news
ServiceNow Inc. - Key offerings
SWOT

15.17 Splunk Inc.

Splunk Inc. - Overview
Splunk Inc. - Product / Service
Splunk Inc. - Key offerings
SWOT

15.18 Trellix

Trellix - Overview
Trellix - Product / Service
Trellix - Key offerings
SWOT

16. Appendix

16.1 Scope of the report

Market definition
Objectives
Notes and caveats

16.2 Inclusions and exclusions checklist

Inclusions checklist
Exclusions checklist

16.3 Currency conversion rates for US$

16.4 Research methodology

16.5 Data procurement

Information sources

16.6 Data validation

16.7 Validation techniques employed for market sizing

16.8 Data synthesis

16.9 360 degree market analysis

16.10 List of abbreviations

Research Methodology

Technavio presents a detailed picture of the market by way of study, synthesis, and summation of data from multiple sources. The analysts have presented the various facets of the market with a particular focus on identifying the key industry influencers. The data thus presented is comprehensive, reliable, and the result of extensive research, both primary and secondary.

INFORMATION SOURCES

Primary sources

  • Manufacturers and suppliers
  • Channel partners
  • Industry experts
  • Strategic decision makers

Secondary sources

  • Industry journals and periodicals
  • Government data
  • Financial reports of key industry players
  • Historical data
  • Press releases

DATA ANALYSIS

Data Synthesis

  • Collation of data
  • Estimation of key figures
  • Analysis of derived insights

Data Validation

  • Triangulation with data models
  • Reference against proprietary databases
  • Corroboration with industry experts

REPORT WRITING

Qualitative

  • Market drivers
  • Market challenges
  • Market trends
  • Five forces analysis

Quantitative

  • Market size and forecast
  • Market segmentation
  • Geographical insights
  • Competitive landscape

Interested in this report?

Get your sample now to see our research methodology and insights!

Download Now

Frequently Asked Questions

Incident Response System market growth will increase by USD 158997.6 thousand thousand during 2026-2030.

The Incident Response System market is expected to grow at a CAGR of 19.3% during 2026-2030.

Incident Response System market is segmented by Type (Backup and disaster recovery solutions, Surveillance systems, Geospatial technologies, Threat management systems) Component (Software, Hardware, Services) Deployment (On-premises, Cloud)

Alert Media Inc., Atlassian Corp., CrowdStrike Inc., Datadog Inc., Everbridge Inc., Exabeam Inc., Fortinet Inc., IBM Corp., ManageEngine, Microsoft Corp., PagerDuty Inc., Palo Alto Networks Inc., Rapid7 Inc., Securonix Inc., ServiceNow Inc., Splunk Inc., Sumo Logic Inc., Swimlane Inc., Trellix are a few of the key vendors in the Incident Response System market.

North America will register the highest growth rate of 41.8% among the other regions. Therefore, the Incident Response System market in North America is expected to garner significant business opportunities for the vendors during the forecast period.

US, Canada, Mexico, China, Japan, India, South Korea, Australia, Indonesia, Germany, UK, France, Italy, Spain, The Netherlands, Brazil, Argentina, Chile, Saudi Arabia, UAE, South Africa, Israel, Turkey

  • Rising threat of ransomware extortion is the driving factor this market.

The Incident Response System market vendors should focus on grabbing business opportunities from the Type segment as it accounted for the largest market share in the base year.
RIA - Research AI Assistant
Ask RIA
