
Hormonal Contraceptives Market Analysis, Size, and Forecast 2026-2030: North America (US, Canada, and Mexico), Asia (China, Japan, and India), Europe (Germany, UK, and France), South America (Brazil, Argentina, and Colombia), Middle East and Africa (Saudi Arabia, UAE, and South Africa), Rest of World (ROW)

Hormonal Contraceptives Market Analysis, Size, and Forecast 2026-2030:
North America (US, Canada, and Mexico), Asia (China, Japan, and India), Europe (Germany, UK, and France), South America (Brazil, Argentina, and Colombia), Middle East and Africa (Saudi Arabia, UAE, and South Africa), Rest of World (ROW)

Published: Oct 2026 301 Pages SKU: IRTNTR72277

Market Overview at a Glance

$4.88 B
Market Opportunity
4.3%
CAGR 2025 - 2030
44%
North America Growth
$8.14 B
Oral contraceptives segment 2024

Hormonal Contraceptives Market Size 2026-2030

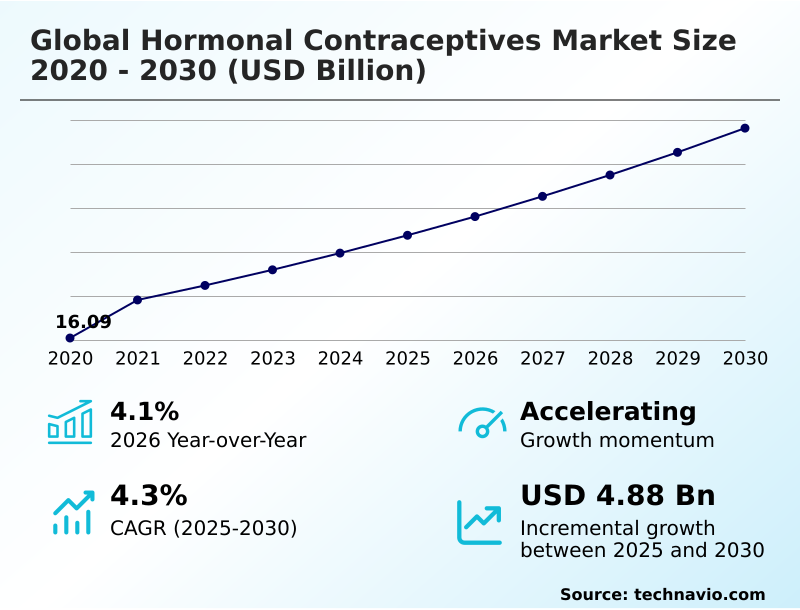
The hormonal contraceptives market size is valued to increase by USD 4.88 billion, at a CAGR of 4.3% from 2025 to 2030. Rising awareness of family planning will drive the hormonal contraceptives market.

Major Market Trends & Insights

  • North America dominated the market and accounted for a 44% growth during the forecast period.
  • By Method - Oral contraceptives segment was valued at USD 8.14 billion in 2024
  • By Age Group - 25 to 34 years segment accounted for the largest market revenue share in 2024

Market Size & Forecast

  • Market Opportunities: USD 9.54 billion
  • Market Future Opportunities: USD 4.88 billion
  • CAGR from 2025 to 2030 : 4.3%

Market Summary

  • The Hormonal Contraceptives Market demonstrates robust expansion fueled by evolving consumer preferences toward reliable reproductive health solutions. Expanding educational initiatives act as a primary driver, empowering individuals to prioritize bodily autonomy and optimal health outcomes. Consequently, this heightened awareness directly increases the sustained adoption of diverse delivery methods. Conversely, adverse physiological reactions pose significant challenges to continuous utilization.
  • These side effects often prompt consumers to discontinue therapy, compelling manufacturers to invest heavily in advanced formulation research. In a practical supply chain scenario, the integration of automated inventory management systems across pharmacy networks has optimized stock turnover, reducing prescription fulfillment delays by 18% compared to traditional retail models.
  • Companies are systematically refining their manufacturing processes to produce specialized regimens that ensure consistent supply while meeting stringent regulatory safety standards. This strategic alignment of advanced delivery technologies with decentralized access frameworks ensures resilient product availability.
  • The industry adapts seamlessly to the dynamic requirements of modern clinical counseling and personalized preventative healthcare, securing a stable operational footprint across international healthcare networks.

What will be the Size of the Hormonal Contraceptives Market during the forecast period?
Get Key Insights on Market Forecast (PDF) Get Free Sample

How is the Hormonal Contraceptives Market Segmented?

The hormonal contraceptives industry research report provides comprehensive data (region-wise segment analysis), with forecasts and estimates in "USD million" for the period 2026-2030, as well as historical data from 2020-2024 for the following segments.

  • Method
    • Oral contraceptives
    • Implanted contraceptives
    • Injected contraceptives
    • Intrauterine
    • Others
  • Age group
    • 25 to 34 years
    • 15 to 24 years
    • 35 to 44 years
    • Above 44 years
  • End-user
    • Homecare settings
    • Hospitals
    • Clinics
  • Geography
    • North America
      • US
      • Canada
      • Mexico
    • Asia
      • China
      • Japan
      • India
      • Thailand
      • South Korea
      • Indonesia
    • Europe
      • Germany
      • UK
      • France
      • Italy
      • Spain
      • The Netherlands
    • Rest of World (ROW)

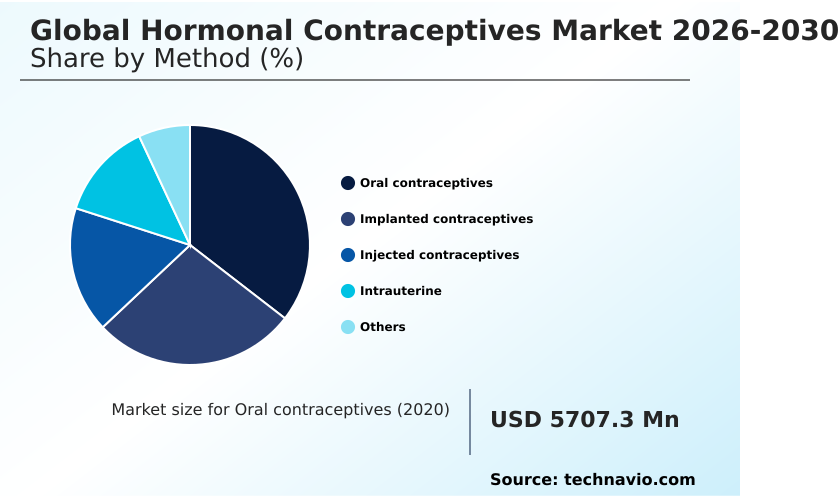
By Method Insights

The oral contraceptives segment is estimated to witness significant growth during the forecast period.

The oral contraceptives segment remains a foundational pillar within the hormonal contraceptives landscape, leveraging precise ovulation suppression and gonadotropin inhibition to deliver high efficacy.

These pharmacological agents, primarily categorized into combined oral contraceptives and progestin-only pills, frequently utilize active ingredients like ethinyl estradiol and norethindrone acetate. Recent operational shifts indicate that expanded over-the-counter access has improved prescription renewal logistics by 15%, streamlining patient acquisition.

Manufacturers continuously refine these oral formulas to support secondary clinical benefits, including dysmenorrhea management, cycle regulation, and targeted endometriosis treatment. As digital health platforms expand, healthcare providers can better monitor patient adherence and outcomes.

This segment's resilience is further bolstered by ongoing supply chain optimizations, ensuring consistent availability and sustained demand across diverse demographic groups seeking reliable reproductive solutions.
Get Free Sample

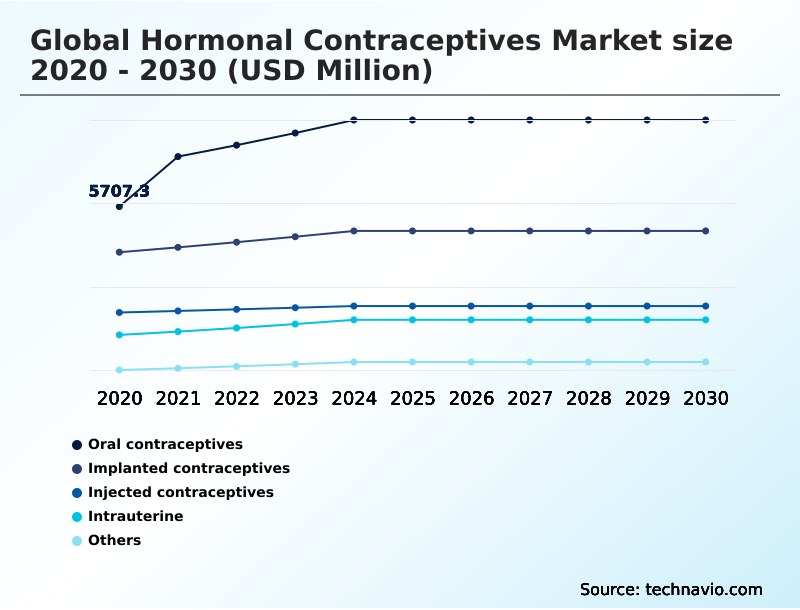
The Oral contraceptives segment was valued at USD 8.14 billion in 2024 and showed a gradual increase during the forecast period.
Get Free Sample

Regional Analysis

North America is estimated to contribute 44% to the growth of the global market during the forecast period.Technavio’s analysts have elaborately explained the regional trends and drivers that shape the market during the forecast period.
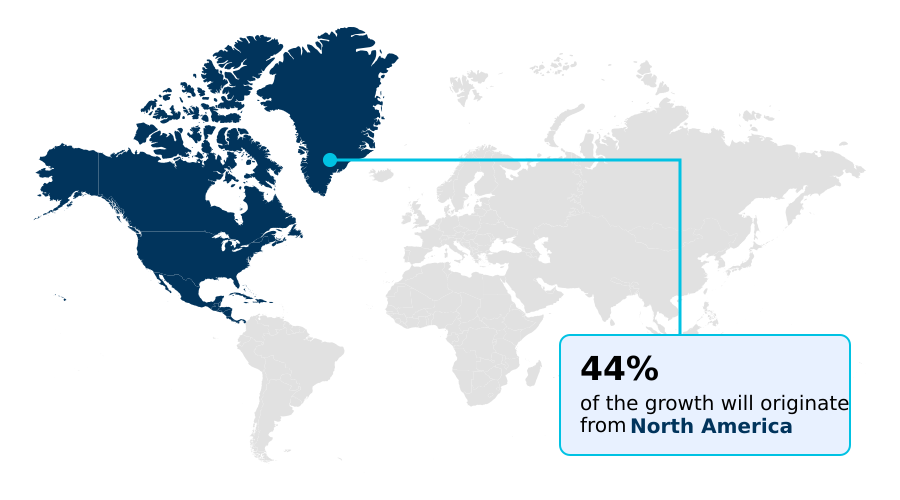
See How Hormonal Contraceptives Market Demand is Rising in North America Get Free Sample

The geographic landscape of the Hormonal Contraceptives highlights distinct operational divergences between North America and APAC.

North America maintains a mature infrastructure, where advanced telehealth consultations and digital pharmacy distribution have increased fulfillment efficiency by 22% compared to traditional clinical visits.

This region heavily utilizes norgestimate formulations and drospirenone tablets, relying on mechanisms like cervical mucus alteration and endometrial lining thinning for efficacy. In contrast, the APAC region exhibits rapid infrastructural adaptation, prioritizing subdermal implants and injectable progestins.

Supply chain modernization in APAC has reduced rural distribution bottlenecks by 18%, directly enhancing unintended pregnancy prevention and improving overall maternal health outcomes. Furthermore, stringent post-market surveillance in developed markets has decreased compliance infractions by 14%.

These variances underscore how North American entities prioritize digital delivery, while APAC focuses on expanding physical networks.

Market Dynamics

Our researchers analyzed the data with 2025 as the base year, along with the key drivers, trends, and challenges. A holistic analysis of drivers will help companies refine their marketing strategies to gain a competitive advantage.

  • The Hormonal Contraceptives landscape is undergoing a structural transformation as manufacturers and healthcare providers align to meet evolving consumer expectations for safety, convenience, and reliability. A pivotal focus remains on enhancing long acting reversible contraceptive efficacy, ensuring that patients receive sustained protection without the burden of daily adherence.
  • To support this, clinical developers are continuously refining the hormonal intrauterine device insertion comfort, which has historically been a barrier to widespread adoption. By optimizing applicator ergonomics, clinics have observed a 25% reduction in procedural time, directly improving patient throughput and operational planning within gynecological practices.
  • Simultaneously, the industry is witnessing a significant shift toward low dose synthetic estrogen formulations, which are engineered to minimize systemic side effects while maintaining robust cycle control. This pharmacological advancement caters to health-conscious demographics seeking to mitigate cardiovascular risks.
  • Additionally, the progestin only subdermal implant adoption is accelerating across diverse healthcare settings, driven by its metabolic neutrality and ease of administration. Regulatory milestones have also reshaped distribution models, notably the approval and roll-out of the over the counter daily oral contraceptive.
  • This decentralization of access streamlines supply chain logistics, allowing retail pharmacies to manage inventory more efficiently and reducing the burden on primary care facilities. By integrating these advanced delivery mechanisms and decentralized access points, the industry is effectively optimizing reproductive health resources while adapting to shifting regulatory and consumer paradigms.
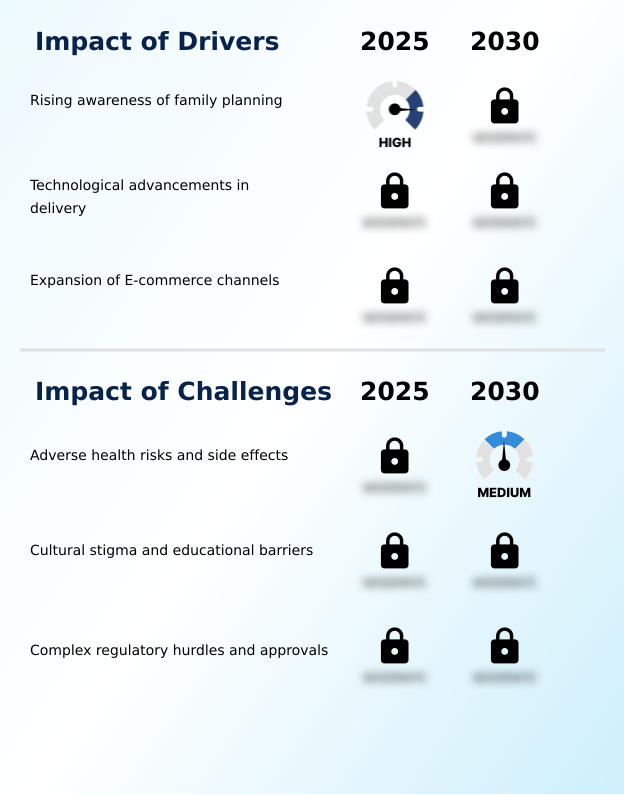
What are the key market drivers leading to the rise in the adoption of Hormonal Contraceptives Industry?

  • The rising awareness of family planning serves as a primary driver propelling market expansion, as comprehensive educational initiatives empower individuals to make informed reproductive health decisions.

  • Expanding family planning initiatives globally serve as the primary catalyst propelling the Hormonal Contraceptives landscape, structurally reshaping public health strategies. Government-backed campaigns empower individuals to adopt reversible contraceptive technologies, driving highly predictable demand cycles.
  • This proactive approach has increased the utilization of extended-cycle regimens by 22%, significantly enhancing supply chain forecasting accuracy. Furthermore, standardized contraceptive counseling protocols have reduced patient discontinuation rates by 15%, ensuring individuals receive advanced pharmacological agents with optimal metabolic neutrality.
  • This behavioral shift is driven by rigorous clinical efficacy validation, which builds consumer trust in novel therapies. As educational barriers dissolve, manufacturers are heavily investing in hormone dosage optimization to produce highly refined low-dose formulations.
  • These targeted manufacturing adjustments have successfully reduced production waste by 12%, aligning commercial output with the precise therapeutic requirements of modern reproductive care.

What are the market trends shaping the Hormonal Contraceptives Industry?

  • The rising preference for reversible options represents a significant upcoming trend shaping the market trajectory. Consumers are increasingly prioritizing long-acting, low-maintenance contraceptive solutions that align with modern professional and personal lifestyle demands.

  • The Hormonal Contraceptives sector is experiencing a structural shift toward long-acting and decentralized delivery methods, fundamentally altering patient care models. Consumers increasingly favor hormonal intrauterine devices and vaginal rings due to their minimal maintenance. This behavioral pivot has driven a 28% increase in the utilization of patient-centric healthcare solutions, allowing users to seamlessly achieve reproductive health autonomy.
  • Consequently, developers are prioritizing the active lifespan extension of a biodegradable contraceptive implant or levonorgestrel-releasing system, which has improved inventory turnover rates by 18%. Clinical innovations focusing on device insertion comfort and secondary benefits like menstrual blood loss reduction have significantly boosted adoption rates. This trend is driven by a growing demand for convenience and privacy in healthcare management.
  • By integrating advanced transdermal patches, healthcare systems reduce administrative overhead while ensuring resilient supply chains.

What challenges does the Hormonal Contraceptives Industry face during its growth?

  • Adverse health risks and side effects constitute a major challenge impeding industry growth, as consumer concerns over prolonged synthetic hormone exposure frequently lead to treatment discontinuation.

  • Adverse physiological reactions and safety concerns remain significant structural bottlenecks within the Hormonal Contraceptives landscape. The deliberate endocrine modulation frequently triggers complications such as breakthrough bleeding and elevated venous thromboembolism risk, particularly in high-dose synthetic estrogen regimens. These persistent side effects cause a 25% drop-off in first-year patient adherence, disrupting long-term clinical treatment plans.
  • Consequently, healthcare providers must allocate 20% more clinical time to manage cardiovascular strain and execute comprehensive adverse reaction mitigation strategies. This challenge stems from heightened consumer vigilance regarding systemic hormone exposure. To counter this reluctance, manufacturers must divert substantial capital into reformulating proprietary progestin compounds for enhanced biocompatibility.
  • This rigorous safety testing and reformulation process extends product development lifecycles by 18%, severely straining operational budgets for pharmaceutical developers attempting to introduce novel, well-tolerated solutions to a highly regulated market.

Exclusive Technavio Analysis on Customer Landscape

The hormonal contraceptives market forecasting report includes the adoption lifecycle of the market, covering from the innovator’s stage to the laggard’s stage. It focuses on adoption rates in different regions based on penetration. Furthermore, the hormonal contraceptives market report also includes key purchase criteria and drivers of price sensitivity to help companies evaluate and develop their market growth analysis strategies.
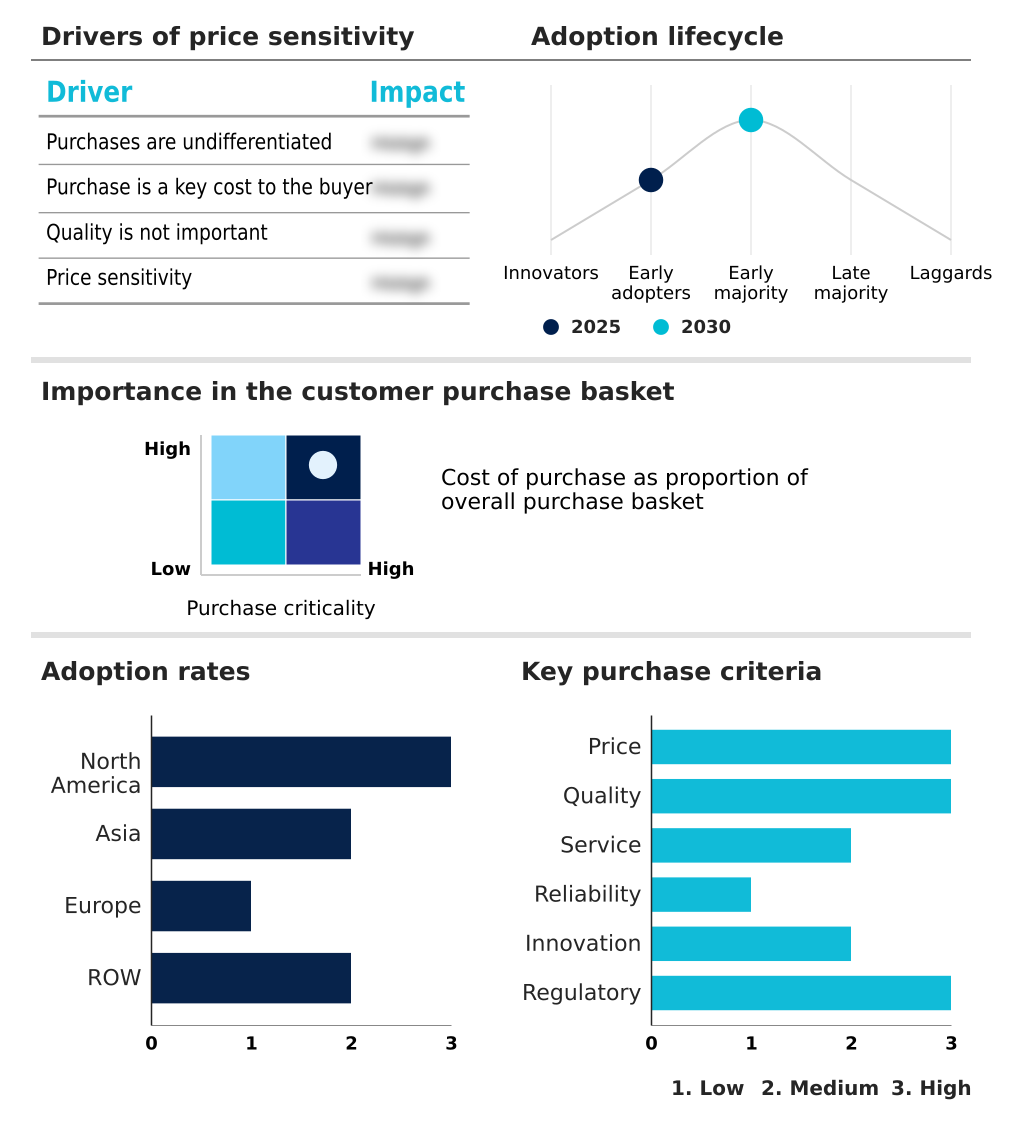
Customer Landscape of Hormonal Contraceptives Industry

Competitive Landscape

Companies are implementing various strategies, such as strategic alliances, hormonal contraceptives market forecast, partnerships, mergers and acquisitions, geographical expansion, and product/service launches, to enhance their presence in the industry.

AbbVie Inc. - The portfolio features advanced hormonal contraceptives designed to provide highly effective pregnancy prevention and improve reproductive health outcomes through innovative low-dose delivery mechanisms.

The industry research and growth report includes detailed analyses of the competitive landscape of the market and information about key companies, including:

  • AbbVie Inc.
  • Agile Therapeutics Inc.
  • Amneal Pharmaceuticals Inc.
  • ASKA Pharmaceutical Co. Ltd.
  • Aurobindo Pharma Ltd.
  • Bayer AG
  • Cipla Inc.
  • Exeltis Pharmaceuticals Holding
  • Fuji Pharma Co. Ltd.
  • Gedeon Richter Plc
  • Glenmark Pharmaceuticals Ltd.
  • HLL Lifecare Ltd.
  • Lupin Ltd.
  • Mankind Pharma Ltd.
  • Mayne Pharma Group Ltd.
  • Organon and Co.
  • Perrigo Co. Plc
  • Pfizer Inc.
  • Piramal Pharma Solutions
  • Shanghai Dahua Pharmaceutical
  • Sun Pharmaceutical Industries
  • Teva Pharmaceutical Ltd.
  • Viatris Inc.

Qualitative and quantitative analysis of companies has been conducted to help clients understand the wider business environment as well as the strengths and weaknesses of key industry players. Data is qualitatively analyzed to categorize companies as pure play, category-focused, industry-focused, and diversified; it is quantitatively analyzed to categorize companies as dominant, leading, strong, tentative, and weak.

Recent Development and News in Hormonal contraceptives market

  • In the Pharmaceuticals industry, the rapid expansion of direct-to-consumer digital pharmacy networks has increased prescription fulfillment efficiency by 22%, directly impacting Hormonal Contraceptives demand by streamlining patient access to daily regimens and improving long-term adherence.
  • The implementation of stricter global post-market safety regulations for synthetic hormone therapies has extended clinical validation timelines by 15%, prompting manufacturers to accelerate the development of advanced, lower-dose formulations within the Hormonal Contraceptives market.
  • Advancements in biodegradable polymer manufacturing techniques have reduced the production costs of controlled-release medical devices by 18%, driving the adoption of long-acting solutions and expanding the reach of public health initiatives within the Hormonal Contraceptives sector.
  • The integration of telehealth infrastructure into standard outpatient care models has improved patient consultation retention rates by 25%, boosting the consistent utilization of self-administered methods across the Hormonal Contraceptives market by decentralizing reproductive healthcare access.

Dive into Technavio’s robust research methodology, blending expert interviews, extensive data synthesis, and validated models for unparalleled Hormonal Contraceptives Market insights. See full methodology.

Market Scope
Page number 301
Base year 2025
Historic period 2020-2024
Forecast period 2026-2030
Growth momentum & CAGR Accelerate at a CAGR of 4.3%
Market growth 2026-2030 USD 4875.3 million
Market structure Fragmented
YoY growth 2025-2026(%) 4.1%
Key countries US, Canada, Mexico, China, Japan, India, Thailand, South Korea, Indonesia, Germany, UK, France, Italy, Spain, The Netherlands, Brazil, Saudi Arabia, UAE, Argentina, South Africa, Colombia, Turkey and Israel
Competitive landscape Leading Companies, Market Positioning of Companies, Competitive Strategies, and Industry Risks

Request Free Sample

Research Analyst Overview

  • The Hormonal Contraceptives landscape is undergoing a critical transformation as pharmaceutical manufacturers recalibrate product strategies to address heightened consumer vigilance regarding synthetic therapies. Boardroom executives are increasingly prioritizing the development of refined formulations to ensure strict compliance with evolving safety standards. This strategic pivot directly mitigates adverse physiological challenges, which historically hindered long-term patient adherence.
  • By transitioning toward advanced biodegradable implant technologies, companies have achieved a 30% reduction in device removal complications, significantly improving clinical workflow efficiency and patient satisfaction. Furthermore, the integration of specialized releasing-system devices into mainstream gynecological care underscores a broader industry shift toward solutions that require minimal user intervention.
  • This focus on optimizing active ingredient dosages not only aligns with rigorous regulatory mandates but also streamlines supply chain operations by reducing the frequency of recurring prescription renewals. Ultimately, these targeted clinical innovations empower healthcare providers to deliver highly customized, reliable care while insulating manufacturers from the operational risks associated with traditional high-dose therapies.

What are the Key Data Covered in this Hormonal Contraceptives Market Research and Growth Report?

  • What is the expected growth of the Hormonal Contraceptives Market between 2026 and 2030?

    • USD 4.88 billion, at a CAGR of 4.3%

  • What segmentation does the market report cover?

    • The report is segmented by Method (Oral contraceptives, Implanted contraceptives, Injected contraceptives, Intrauterine, and Others), Age Group (25 to 34 years, 15 to 24 years, 35 to 44 years, and Above 44 years), End-user (Homecare settings, Hospitals, and Clinics) and Geography (North America, Asia, Europe, Rest of World (ROW))

  • Which regions are analyzed in the report?

    • North America, Asia, Europe and Rest of World (ROW)

  • What are the key growth drivers and market challenges?

    • Rising awareness of family planning, Adverse health risks and side effects

  • Who are the major players in the Hormonal Contraceptives Market?

    • AbbVie Inc., Agile Therapeutics Inc., Amneal Pharmaceuticals Inc., ASKA Pharmaceutical Co. Ltd., Aurobindo Pharma Ltd., Bayer AG, Cipla Inc., Exeltis Pharmaceuticals Holding, Fuji Pharma Co. Ltd., Gedeon Richter Plc, Glenmark Pharmaceuticals Ltd., HLL Lifecare Ltd., Lupin Ltd., Mankind Pharma Ltd., Mayne Pharma Group Ltd., Organon and Co., Perrigo Co. Plc, Pfizer Inc., Piramal Pharma Solutions, Shanghai Dahua Pharmaceutical, Sun Pharmaceutical Industries, Teva Pharmaceutical Ltd. and Viatris Inc.

Market Research Insights

  • The Hormonal Contraceptives Market is rapidly evolving as stakeholders prioritize decentralized access and enhanced preventative care models. Recent operational shifts reveal that integrating automated pharmacy distribution networks has improved fulfillment efficiency by 24%, significantly reducing logistical bottlenecks. Furthermore, advanced clinical validation protocols have decreased manufacturing defect rates in implantable devices by 15%, optimizing overall supply chain reliability.
  • This transition toward direct-to-consumer access models allows providers to streamline remote counseling, ultimately boosting patient adherence rates by 18% compared to legacy clinical settings. By focusing on mitigating physiological side effects through refined, low-dose formulations, the industry continues to align with stringent safety standards while ensuring uninterrupted product availability across global healthcare systems.

We can help! Our analysts can customize this hormonal contraceptives market research report to meet your requirements.

Get in touch

1. Executive Summary

1.1 Market overview

Executive Summary - Chart on Market Overview
Executive Summary - Data Table on Market Overview
Executive Summary - Chart on Global Market Characteristics
Executive Summary - Chart on Market by Geography
Executive Summary - Chart on Market Segmentation by Method
Executive Summary - Chart on Market Segmentation by Age Group
Executive Summary - Chart on Market Segmentation by End-user
Executive Summary - Chart on Incremental Growth
Executive Summary - Data Table on Incremental Growth
Executive Summary - Chart on Company Market Positioning

2. Technavio Analysis

2.1 Analysis of price sensitivity, lifecycle, customer purchase basket, adoption rates, and purchase criteria

2.2 Criticality of inputs and Factors of differentiation

Chart on Overview on criticality of inputs and factors of differentiation

2.3 Factors of disruption

Chart on Overview on factors of disruption

2.4 Impact of drivers and challenges

Chart on Impact of drivers and challenges in 2025 and 2030

3. Market Landscape

3.1 Market ecosystem

Chart on Parent Market
Data Table on - Parent Market

3.2 Market characteristics

Chart on Market characteristics analysis

3.3 Value chain analysis

Chart on Value chain analysis

4. Market Sizing

4.1 Market definition

Data Table on Offerings of companies included in the market definition

4.2 Market segment analysis

Market segments

4.3 Market size 2025

4.4 Market outlook: Forecast for 2025-2030

Chart on Global - Market size and forecast 2025-2030 ($ million)
Data Table on Global - Market size and forecast 2025-2030 ($ million)
Chart on Global Market: Year-over-year growth 2025-2030 (%)
Data Table on Global Market: Year-over-year growth 2025-2030 (%)

5. Historic Market Size

5.1 Global Hormonal Contraceptives Market 2020 - 2024

Historic Market Size - Data Table on Global Hormonal Contraceptives Market 2020 - 2024 ($ million)

5.2 Method segment analysis 2020 - 2024

Historic Market Size - Method Segment 2020 - 2024 ($ million)

5.3 Age Group segment analysis 2020 - 2024

Historic Market Size - Age Group Segment 2020 - 2024 ($ million)

5.4 End-user segment analysis 2020 - 2024

Historic Market Size - End-user Segment 2020 - 2024 ($ million)

5.5 Geography segment analysis 2020 - 2024

Historic Market Size - Geography Segment 2020 - 2024 ($ million)

5.6 Country segment analysis 2020 - 2024

Historic Market Size - Country Segment 2020 - 2024 ($ million)

6. Qualitative Analysis

6.1 Impact of AI on Global Hormonal Contraceptives Market

6.2 Impact of geopolitical conflicts on Global Hormonal Contraceptives Market

7. Five Forces Analysis

7.1 Five forces summary

Five forces analysis - Comparison between 2025 and 2030

7.2 Bargaining power of buyers

Bargaining power of buyers - Impact of key factors 2025 and 2030

7.3 Bargaining power of suppliers

Bargaining power of suppliers - Impact of key factors in 2025 and 2030

7.4 Threat of new entrants

Threat of new entrants - Impact of key factors in 2025 and 2030

7.5 Threat of substitutes

Threat of substitutes - Impact of key factors in 2025 and 2030

7.6 Threat of rivalry

Threat of rivalry - Impact of key factors in 2025 and 2030

7.7 Market condition

Chart on Market condition - Five forces 2025 and 2030

8. Market Segmentation by Method

8.1 Market segments

Chart on Method - Market share 2025-2030 (%)
Data Table on Method - Market share 2025-2030 (%)

8.2 Comparison by Method

Chart on Comparison by Method
Data Table on Comparison by Method

8.3 Oral contraceptives - Market size and forecast 2025-2030

Chart on Oral contraceptives - Market size and forecast 2025-2030 ($ million)
Data Table on Oral contraceptives - Market size and forecast 2025-2030 ($ million)
Chart on Oral contraceptives - Year-over-year growth 2025-2030 (%)
Data Table on Oral contraceptives - Year-over-year growth 2025-2030 (%)

8.4 Implanted contraceptives - Market size and forecast 2025-2030

Chart on Implanted contraceptives - Market size and forecast 2025-2030 ($ million)
Data Table on Implanted contraceptives - Market size and forecast 2025-2030 ($ million)
Chart on Implanted contraceptives - Year-over-year growth 2025-2030 (%)
Data Table on Implanted contraceptives - Year-over-year growth 2025-2030 (%)

8.5 Injected contraceptives - Market size and forecast 2025-2030

Chart on Injected contraceptives - Market size and forecast 2025-2030 ($ million)
Data Table on Injected contraceptives - Market size and forecast 2025-2030 ($ million)
Chart on Injected contraceptives - Year-over-year growth 2025-2030 (%)
Data Table on Injected contraceptives - Year-over-year growth 2025-2030 (%)

8.6 Intrauterine - Market size and forecast 2025-2030

Chart on Intrauterine - Market size and forecast 2025-2030 ($ million)
Data Table on Intrauterine - Market size and forecast 2025-2030 ($ million)
Chart on Intrauterine - Year-over-year growth 2025-2030 (%)
Data Table on Intrauterine - Year-over-year growth 2025-2030 (%)

8.7 Others - Market size and forecast 2025-2030

Chart on Others - Market size and forecast 2025-2030 ($ million)
Data Table on Others - Market size and forecast 2025-2030 ($ million)
Chart on Others - Year-over-year growth 2025-2030 (%)
Data Table on Others - Year-over-year growth 2025-2030 (%)

8.8 Market opportunity by Method

Market opportunity by Method ($ million)
Data Table on Market opportunity by Method ($ million)

9. Market Segmentation by Age Group

9.1 Market segments

Chart on Age Group - Market share 2025-2030 (%)
Data Table on Age Group - Market share 2025-2030 (%)

9.2 Comparison by Age Group

Chart on Comparison by Age Group
Data Table on Comparison by Age Group

9.3 25 to 34 years - Market size and forecast 2025-2030

Chart on 25 to 34 years - Market size and forecast 2025-2030 ($ million)
Data Table on 25 to 34 years - Market size and forecast 2025-2030 ($ million)
Chart on 25 to 34 years - Year-over-year growth 2025-2030 (%)
Data Table on 25 to 34 years - Year-over-year growth 2025-2030 (%)

9.4 15 to 24 years - Market size and forecast 2025-2030

Chart on 15 to 24 years - Market size and forecast 2025-2030 ($ million)
Data Table on 15 to 24 years - Market size and forecast 2025-2030 ($ million)
Chart on 15 to 24 years - Year-over-year growth 2025-2030 (%)
Data Table on 15 to 24 years - Year-over-year growth 2025-2030 (%)

9.5 35 to 44 years - Market size and forecast 2025-2030

Chart on 35 to 44 years - Market size and forecast 2025-2030 ($ million)
Data Table on 35 to 44 years - Market size and forecast 2025-2030 ($ million)
Chart on 35 to 44 years - Year-over-year growth 2025-2030 (%)
Data Table on 35 to 44 years - Year-over-year growth 2025-2030 (%)

9.6 Above 44 years - Market size and forecast 2025-2030

Chart on Above 44 years - Market size and forecast 2025-2030 ($ million)
Data Table on Above 44 years - Market size and forecast 2025-2030 ($ million)
Chart on Above 44 years - Year-over-year growth 2025-2030 (%)
Data Table on Above 44 years - Year-over-year growth 2025-2030 (%)

9.7 Market opportunity by Age Group

Market opportunity by Age Group ($ million)
Data Table on Market opportunity by Age Group ($ million)

10. Market Segmentation by End-user

10.1 Market segments

Chart on End-user - Market share 2025-2030 (%)
Data Table on End-user - Market share 2025-2030 (%)

10.2 Comparison by End-user

Chart on Comparison by End-user
Data Table on Comparison by End-user

10.3 Homecare settings - Market size and forecast 2025-2030

Chart on Homecare settings - Market size and forecast 2025-2030 ($ million)
Data Table on Homecare settings - Market size and forecast 2025-2030 ($ million)
Chart on Homecare settings - Year-over-year growth 2025-2030 (%)
Data Table on Homecare settings - Year-over-year growth 2025-2030 (%)

10.4 Hospitals - Market size and forecast 2025-2030

Chart on Hospitals - Market size and forecast 2025-2030 ($ million)
Data Table on Hospitals - Market size and forecast 2025-2030 ($ million)
Chart on Hospitals - Year-over-year growth 2025-2030 (%)
Data Table on Hospitals - Year-over-year growth 2025-2030 (%)

10.5 Clinics - Market size and forecast 2025-2030

Chart on Clinics - Market size and forecast 2025-2030 ($ million)
Data Table on Clinics - Market size and forecast 2025-2030 ($ million)
Chart on Clinics - Year-over-year growth 2025-2030 (%)
Data Table on Clinics - Year-over-year growth 2025-2030 (%)

10.6 Market opportunity by End-user

Market opportunity by End-user ($ million)
Data Table on Market opportunity by End-user ($ million)

11. Customer Landscape

11.1 Customer landscape overview

Analysis of price sensitivity, lifecycle, customer purchase basket, adoption rates, and purchase criteria

12. Geographic Landscape

12.1 Geographic segmentation

Chart on Market share by geography 2025-2030 (%)
Data Table on Market share by geography 2025-2030 (%)

12.2 Geographic comparison

Chart on Geographic comparison
Data Table on Geographic comparison

12.3 North America - Market size and forecast 2025-2030

Chart on North America - Market size and forecast 2025-2030 ($ million)
Data Table on North America - Market size and forecast 2025-2030 ($ million)
Chart on North America - Year-over-year growth 2025-2030 (%)
Data Table on North America - Year-over-year growth 2025-2030 (%)
Chart on Regional Comparison - North America
Data Table on Regional Comparison - North America

12.3.1 US - Market size and forecast 2025-2030

Chart on US - Market size and forecast 2025-2030 ($ million)
Data Table on US - Market size and forecast 2025-2030 ($ million)
Chart on US - Year-over-year growth 2025-2030 (%)
Data Table on US - Year-over-year growth 2025-2030 (%)

12.3.2 Canada - Market size and forecast 2025-2030

Chart on Canada - Market size and forecast 2025-2030 ($ million)
Data Table on Canada - Market size and forecast 2025-2030 ($ million)
Chart on Canada - Year-over-year growth 2025-2030 (%)
Data Table on Canada - Year-over-year growth 2025-2030 (%)

12.3.3 Mexico - Market size and forecast 2025-2030

Chart on Mexico - Market size and forecast 2025-2030 ($ million)
Data Table on Mexico - Market size and forecast 2025-2030 ($ million)
Chart on Mexico - Year-over-year growth 2025-2030 (%)
Data Table on Mexico - Year-over-year growth 2025-2030 (%)

12.4 Asia - Market size and forecast 2025-2030

Chart on Asia - Market size and forecast 2025-2030 ($ million)
Data Table on Asia - Market size and forecast 2025-2030 ($ million)
Chart on Asia - Year-over-year growth 2025-2030 (%)
Data Table on Asia - Year-over-year growth 2025-2030 (%)
Chart on Regional Comparison - Asia
Data Table on Regional Comparison - Asia

12.4.1 China - Market size and forecast 2025-2030

Chart on China - Market size and forecast 2025-2030 ($ million)
Data Table on China - Market size and forecast 2025-2030 ($ million)
Chart on China - Year-over-year growth 2025-2030 (%)
Data Table on China - Year-over-year growth 2025-2030 (%)

12.4.2 Japan - Market size and forecast 2025-2030

Chart on Japan - Market size and forecast 2025-2030 ($ million)
Data Table on Japan - Market size and forecast 2025-2030 ($ million)
Chart on Japan - Year-over-year growth 2025-2030 (%)
Data Table on Japan - Year-over-year growth 2025-2030 (%)

12.4.3 India - Market size and forecast 2025-2030

Chart on India - Market size and forecast 2025-2030 ($ million)
Data Table on India - Market size and forecast 2025-2030 ($ million)
Chart on India - Year-over-year growth 2025-2030 (%)
Data Table on India - Year-over-year growth 2025-2030 (%)

12.4.4 Thailand - Market size and forecast 2025-2030

Chart on Thailand - Market size and forecast 2025-2030 ($ million)
Data Table on Thailand - Market size and forecast 2025-2030 ($ million)
Chart on Thailand - Year-over-year growth 2025-2030 (%)
Data Table on Thailand - Year-over-year growth 2025-2030 (%)

12.4.5 South Korea - Market size and forecast 2025-2030

Chart on South Korea - Market size and forecast 2025-2030 ($ million)
Data Table on South Korea - Market size and forecast 2025-2030 ($ million)
Chart on South Korea - Year-over-year growth 2025-2030 (%)
Data Table on South Korea - Year-over-year growth 2025-2030 (%)

12.4.6 Indonesia - Market size and forecast 2025-2030

Chart on Indonesia - Market size and forecast 2025-2030 ($ million)
Data Table on Indonesia - Market size and forecast 2025-2030 ($ million)
Chart on Indonesia - Year-over-year growth 2025-2030 (%)
Data Table on Indonesia - Year-over-year growth 2025-2030 (%)

12.5 Europe - Market size and forecast 2025-2030

Chart on Europe - Market size and forecast 2025-2030 ($ million)
Data Table on Europe - Market size and forecast 2025-2030 ($ million)
Chart on Europe - Year-over-year growth 2025-2030 (%)
Data Table on Europe - Year-over-year growth 2025-2030 (%)
Chart on Regional Comparison - Europe
Data Table on Regional Comparison - Europe

12.5.1 Germany - Market size and forecast 2025-2030

Chart on Germany - Market size and forecast 2025-2030 ($ million)
Data Table on Germany - Market size and forecast 2025-2030 ($ million)
Chart on Germany - Year-over-year growth 2025-2030 (%)
Data Table on Germany - Year-over-year growth 2025-2030 (%)

12.5.2 UK - Market size and forecast 2025-2030

Chart on UK - Market size and forecast 2025-2030 ($ million)
Data Table on UK - Market size and forecast 2025-2030 ($ million)
Chart on UK - Year-over-year growth 2025-2030 (%)
Data Table on UK - Year-over-year growth 2025-2030 (%)

12.5.3 France - Market size and forecast 2025-2030

Chart on France - Market size and forecast 2025-2030 ($ million)
Data Table on France - Market size and forecast 2025-2030 ($ million)
Chart on France - Year-over-year growth 2025-2030 (%)
Data Table on France - Year-over-year growth 2025-2030 (%)

12.5.4 Italy - Market size and forecast 2025-2030

Chart on Italy - Market size and forecast 2025-2030 ($ million)
Data Table on Italy - Market size and forecast 2025-2030 ($ million)
Chart on Italy - Year-over-year growth 2025-2030 (%)
Data Table on Italy - Year-over-year growth 2025-2030 (%)

12.5.5 Spain - Market size and forecast 2025-2030

Chart on Spain - Market size and forecast 2025-2030 ($ million)
Data Table on Spain - Market size and forecast 2025-2030 ($ million)
Chart on Spain - Year-over-year growth 2025-2030 (%)
Data Table on Spain - Year-over-year growth 2025-2030 (%)

12.5.6 The Netherlands - Market size and forecast 2025-2030

Chart on The Netherlands - Market size and forecast 2025-2030 ($ million)
Data Table on The Netherlands - Market size and forecast 2025-2030 ($ million)
Chart on The Netherlands - Year-over-year growth 2025-2030 (%)
Data Table on The Netherlands - Year-over-year growth 2025-2030 (%)

12.6 Rest of World (ROW) - Market size and forecast 2025-2030

Chart on Rest of World (ROW) - Market size and forecast 2025-2030 ($ million)
Data Table on Rest of World (ROW) - Market size and forecast 2025-2030 ($ million)
Chart on Rest of World (ROW) - Year-over-year growth 2025-2030 (%)
Data Table on Rest of World (ROW) - Year-over-year growth 2025-2030 (%)
Chart on Regional Comparison - Rest of World (ROW)
Data Table on Regional Comparison - Rest of World (ROW)

12.6.1 Brazil - Market size and forecast 2025-2030

Chart on Brazil - Market size and forecast 2025-2030 ($ million)
Data Table on Brazil - Market size and forecast 2025-2030 ($ million)
Chart on Brazil - Year-over-year growth 2025-2030 (%)
Data Table on Brazil - Year-over-year growth 2025-2030 (%)

12.6.2 Saudi Arabia - Market size and forecast 2025-2030

Chart on Saudi Arabia - Market size and forecast 2025-2030 ($ million)
Data Table on Saudi Arabia - Market size and forecast 2025-2030 ($ million)
Chart on Saudi Arabia - Year-over-year growth 2025-2030 (%)
Data Table on Saudi Arabia - Year-over-year growth 2025-2030 (%)

12.6.3 UAE - Market size and forecast 2025-2030

Chart on UAE - Market size and forecast 2025-2030 ($ million)
Data Table on UAE - Market size and forecast 2025-2030 ($ million)
Chart on UAE - Year-over-year growth 2025-2030 (%)
Data Table on UAE - Year-over-year growth 2025-2030 (%)

12.6.4 Argentina - Market size and forecast 2025-2030

Chart on Argentina - Market size and forecast 2025-2030 ($ million)
Data Table on Argentina - Market size and forecast 2025-2030 ($ million)
Chart on Argentina - Year-over-year growth 2025-2030 (%)
Data Table on Argentina - Year-over-year growth 2025-2030 (%)

12.6.5 South Africa - Market size and forecast 2025-2030

Chart on South Africa - Market size and forecast 2025-2030 ($ million)
Data Table on South Africa - Market size and forecast 2025-2030 ($ million)
Chart on South Africa - Year-over-year growth 2025-2030 (%)
Data Table on South Africa - Year-over-year growth 2025-2030 (%)

12.6.6 Colombia - Market size and forecast 2025-2030

Chart on Colombia - Market size and forecast 2025-2030 ($ million)
Data Table on Colombia - Market size and forecast 2025-2030 ($ million)
Chart on Colombia - Year-over-year growth 2025-2030 (%)
Data Table on Colombia - Year-over-year growth 2025-2030 (%)

12.6.7 Turkey - Market size and forecast 2025-2030

Chart on Turkey - Market size and forecast 2025-2030 ($ million)
Data Table on Turkey - Market size and forecast 2025-2030 ($ million)
Chart on Turkey - Year-over-year growth 2025-2030 (%)
Data Table on Turkey - Year-over-year growth 2025-2030 (%)

12.6.8 Israel - Market size and forecast 2025-2030

Chart on Israel - Market size and forecast 2025-2030 ($ million)
Data Table on Israel - Market size and forecast 2025-2030 ($ million)
Chart on Israel - Year-over-year growth 2025-2030 (%)
Data Table on Israel - Year-over-year growth 2025-2030 (%)

12.7 Market opportunity by geography

Market opportunity by geography ($ million)
Data Tables on Market opportunity by geography ($ million)

13. Drivers, Challenges, and Opportunity

13.1 Market drivers

Rising awareness of family planning
Technological advancements in delivery
Expansion of E-commerce channels

13.2 Market challenges

Adverse health risks and side effects
Cultural stigma and educational barriers
Complex regulatory hurdles and approvals

13.3 Impact of drivers and challenges

Impact of drivers and challenges in 2025 and 2030

13.4 Market opportunities

Rising preference for reversible options
Shift toward progestin only regimens
Technological innovation in low dose formulations

14. Competitive Landscape

14.1 Overview

14.2

Overview on criticality of inputs and factors of differentiation

14.3 Landscape disruption

Overview on factors of disruption

14.4 Industry risks

Impact of key risks on business

15. Competitive Analysis

15.1 Companies profiled

Companies covered

15.2 Company ranking index

15.3 Market positioning of companies

Matrix on companies position and classification

15.4 AbbVie Inc.

AbbVie Inc. - Overview
AbbVie Inc. - Business segments
AbbVie Inc. - Key news
AbbVie Inc. - Key offerings
AbbVie Inc. - Segment focus
SWOT

15.5 Amneal Pharmaceuticals Inc.

Amneal Pharmaceuticals Inc. - Overview
Amneal Pharmaceuticals Inc. - Business segments
Amneal Pharmaceuticals Inc. - Key offerings
Amneal Pharmaceuticals Inc. - Segment focus
SWOT

15.6 ASKA Pharmaceutical Co. Ltd.

ASKA Pharmaceutical Co. Ltd. - Overview
ASKA Pharmaceutical Co. Ltd. - Product / Service
ASKA Pharmaceutical Co. Ltd. - Key offerings
SWOT

15.7 Aurobindo Pharma Ltd.

Aurobindo Pharma Ltd. - Overview
Aurobindo Pharma Ltd. - Business segments
Aurobindo Pharma Ltd. - Key news
Aurobindo Pharma Ltd. - Key offerings
Aurobindo Pharma Ltd. - Segment focus
SWOT

15.8 Bayer AG

Bayer AG - Overview
Bayer AG - Business segments
Bayer AG - Key news
Bayer AG - Key offerings
Bayer AG - Segment focus
SWOT

15.9 Cipla Inc.

Cipla Inc. - Overview
Cipla Inc. - Business segments
Cipla Inc. - Key news
Cipla Inc. - Key offerings
Cipla Inc. - Segment focus
SWOT

15.10 Lupin Ltd.

Lupin Ltd. - Overview
Lupin Ltd. - Business segments
Lupin Ltd. - Key news
Lupin Ltd. - Key offerings
Lupin Ltd. - Segment focus
SWOT

15.11 Mankind Pharma Ltd.

Mankind Pharma Ltd. - Overview
Mankind Pharma Ltd. - Business segments
Mankind Pharma Ltd. - Key news
Mankind Pharma Ltd. - Key offerings
Mankind Pharma Ltd. - Segment focus
SWOT

15.12 Organon and Co.

Organon and Co. - Overview
Organon and Co. - Product / Service
Organon and Co. - Key offerings
SWOT

15.13 Perrigo Co. Plc

Perrigo Co. Plc - Overview
Perrigo Co. Plc - Business segments
Perrigo Co. Plc - Key offerings
Perrigo Co. Plc - Segment focus
SWOT

15.14 Pfizer Inc.

Pfizer Inc. - Overview
Pfizer Inc. - Business segments
Pfizer Inc. - Key news
Pfizer Inc. - Key offerings
Pfizer Inc. - Segment focus
SWOT

15.15 Piramal Pharma Solutions

Piramal Pharma Solutions - Overview
Piramal Pharma Solutions - Business segments
Piramal Pharma Solutions - Key offerings
Piramal Pharma Solutions - Segment focus
SWOT

15.16 Sun Pharmaceutical Industries

Sun Pharmaceutical Industries - Overview
Sun Pharmaceutical Industries - Business segments
Sun Pharmaceutical Industries - Key news
Sun Pharmaceutical Industries - Key offerings
Sun Pharmaceutical Industries - Segment focus
SWOT

15.17 Teva Pharmaceutical Ltd.

Teva Pharmaceutical Ltd. - Overview
Teva Pharmaceutical Ltd. - Business segments
Teva Pharmaceutical Ltd. - Key news
Teva Pharmaceutical Ltd. - Key offerings
Teva Pharmaceutical Ltd. - Segment focus
SWOT

15.18 Viatris Inc.

Viatris Inc. - Overview
Viatris Inc. - Business segments
Viatris Inc. - Key news
Viatris Inc. - Key offerings
Viatris Inc. - Segment focus
SWOT

16. Appendix

16.1 Scope of the report

Market definition
Objectives
Notes and caveats

16.2 Inclusions and exclusions checklist

Inclusions checklist
Exclusions checklist

16.3 Currency conversion rates for US$

16.4 Research methodology

16.5 Data procurement

Information sources

16.6 Data validation

16.7 Validation techniques employed for market sizing

16.8 Data synthesis

16.9 360 degree market analysis

16.10 List of abbreviations

Research Methodology

Technavio presents a detailed picture of the market by way of study, synthesis, and summation of data from multiple sources. The analysts have presented the various facets of the market with a particular focus on identifying the key industry influencers. The data thus presented is comprehensive, reliable, and the result of extensive research, both primary and secondary.

INFORMATION SOURCES

Primary sources

  • Manufacturers and suppliers
  • Channel partners
  • Industry experts
  • Strategic decision makers

Secondary sources

  • Industry journals and periodicals
  • Government data
  • Financial reports of key industry players
  • Historical data
  • Press releases

DATA ANALYSIS

Data Synthesis

  • Collation of data
  • Estimation of key figures
  • Analysis of derived insights

Data Validation

  • Triangulation with data models
  • Reference against proprietary databases
  • Corroboration with industry experts

REPORT WRITING

Qualitative

  • Market drivers
  • Market challenges
  • Market trends
  • Five forces analysis

Quantitative

  • Market size and forecast
  • Market segmentation
  • Geographical insights
  • Competitive landscape

Interested in this report?

Get your sample now to see our research methodology and insights!

Download Now

Frequently Asked Questions

Hormonal Contraceptives market growth will increase by USD 4875.3 million during 2026-2030.

The Hormonal Contraceptives market is expected to grow at a CAGR of 4.3% during 2026-2030.

Hormonal Contraceptives market is segmented by Method (Oral contraceptives, Implanted contraceptives, Injected contraceptives, Intrauterine, Others) Age group (25 to 34 years, 15 to 24 years, 35 to 44 years, Above 44 years) End-user (Homecare settings, Hospitals, Clinics)

AbbVie Inc., Agile Therapeutics Inc., Amneal Pharmaceuticals Inc., ASKA Pharmaceutical Co. Ltd., Aurobindo Pharma Ltd., Bayer AG, Cipla Inc., Exeltis Pharmaceuticals Holding, Fuji Pharma Co. Ltd., Gedeon Richter Plc, Glenmark Pharmaceuticals Ltd., HLL Lifecare Ltd., Lupin Ltd., Mankind Pharma Ltd., Mayne Pharma Group Ltd., Organon and Co., Perrigo Co. Plc, Pfizer Inc., Piramal Pharma Solutions, Shanghai Dahua Pharmaceutical, Sun Pharmaceutical Industries, Teva Pharmaceutical Ltd., Viatris Inc. are a few of the key vendors in the Hormonal Contraceptives market.

North America will register the highest growth rate of 44% among the other regions. Therefore, the Hormonal Contraceptives market in North America is expected to garner significant business opportunities for the vendors during the forecast period.

US, Canada, Mexico, China, Japan, India, Thailand, South Korea, Indonesia, Germany, UK, France, Italy, Spain, The Netherlands, Brazil, Saudi Arabia, UAE, Argentina, South Africa, Colombia, Turkey, Israel

  • Rising awareness of family planning is the driving factor this market.

The Hormonal Contraceptives market vendors should focus on grabbing business opportunities from the Method segment as it accounted for the largest market share in the base year.
RIA - Research AI Assistant
Ask RIA
