High Purity Alumina Market Analysis, Size, and Forecast 2026-2030: APAC (China, Taiwan, and South Korea), North America (US, Canada, and Mexico), Europe (Germany, France, and UK), South America (Brazil, Argentina, and Colombia), Middle East and Africa (Saudi Arabia, UAE, and South Africa), and Rest of World (ROW)

High Purity Alumina Market Analysis, Size, and Forecast 2026-2030:
APAC (China, Taiwan, and South Korea), North America (US, Canada, and Mexico), Europe (Germany, France, and UK), South America (Brazil, Argentina, and Colombia), Middle East and Africa (Saudi Arabia, UAE, and South Africa), and Rest of World (ROW)

Published: Oct 2026 307 Pages SKU: IRTNTR41567

Market Overview at a Glance

$10.45 B
Market Opportunity
32.5%
CAGR 2025 - 2030
72.5%
APAC Growth
$1.56 B
LEDs segment 2024

High Purity Alumina Market Size 2026-2030

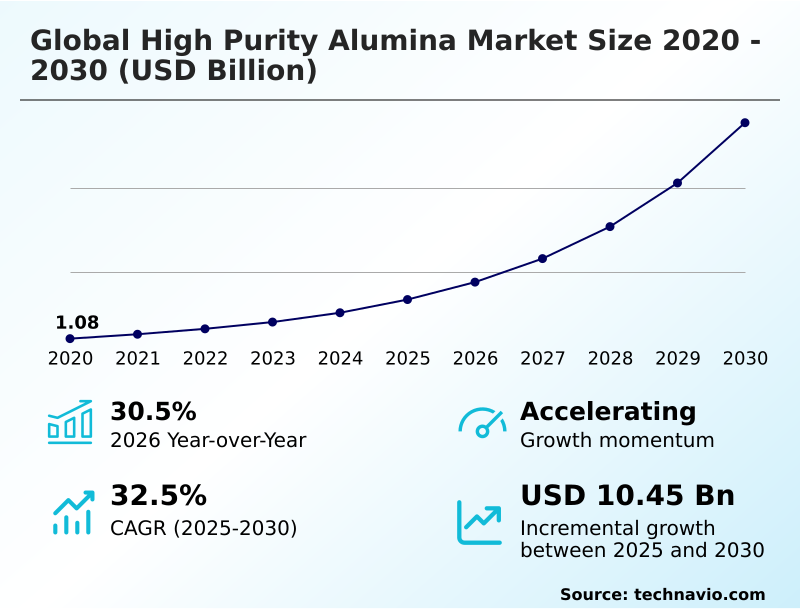
The high purity alumina market size is valued to increase by USD 10.45 billion, at a CAGR of 32.5% from 2025 to 2030. Rising integration within lithium-ion battery supply chain will drive the high purity alumina market.

Major Market Trends & Insights

  • APAC dominated the market and accounted for a 72.5% growth during the forecast period.
  • By Application - LEDs segment was valued at USD 1.56 billion in 2024
  • By Type - 4N HPA segment accounted for the largest market revenue share in 2024

Market Size & Forecast

  • Market Opportunities: USD 12.76 billion
  • Market Future Opportunities: USD 10.45 billion
  • CAGR from 2025 to 2030 : 32.5%

Market Summary

  • The High Purity Alumina Market demonstrates robust expansion driven by the critical material requirements of modern energy storage and advanced semiconductor fabrication. Organizations are increasingly localizing supply chains to secure ultra-pure precursors necessary for lithium-ion battery separators, ensuring compliance with stringent safety and thermal stability mandates.
  • Implementing automated filtration and specialized distillation within these localized refineries has improved raw material processing yields by 22% compared to traditional smelting operations. This operational efficiency directly addresses the rising integration within the lithium-ion battery supply chain, which acts as a primary market driver by necessitating enhanced thermal runaway mitigation.
  • Conversely, the market faces significant constraints due to high operational expenditures associated with maintaining absolute chemical consistency in extreme cleanroom environments. High energy consumption during continuous crystallization cycles elevates production costs, pressuring profit margins for smaller suppliers. The relentless demand for defect-free optical components solidifies the reliance on advanced purification techniques across the technology sector.
  • Sustainable manufacturing methodologies continue to reshape competitive dynamics by insulating production facilities from volatile fossil fuel dependencies.

What will be the Size of the High Purity Alumina Market during the forecast period?
Get Key Insights on Market Forecast (PDF) Get Free Sample

How is the High Purity Alumina Market Segmented?

The high purity alumina industry research report provides comprehensive data (region-wise segment analysis), with forecasts and estimates in "USD million" for the period 2026-2030, as well as historical data from 2020-2024 for the following segments.

  • Application
    • LEDs
    • Semiconductors
    • Phosphors
    • Others
  • Type
    • 4N HPA
    • 5N HPA
    • 6N HPA
  • Technology
    • Hydrolysis
    • Hydrochloric acid leaching
    • Others
  • Geography
    • APAC
      • China
      • Taiwan
      • South Korea
      • Japan
      • India
      • Australia
    • North America
      • US
      • Canada
      • Mexico
    • Europe
      • Germany
      • France
      • UK
      • The Netherlands
      • Italy
      • Spain
    • South America
      • Brazil
      • Argentina
      • Colombia
    • Middle East and Africa
      • Saudi Arabia
      • UAE
      • South Africa
      • Egypt
      • Turkey

By Application Insights

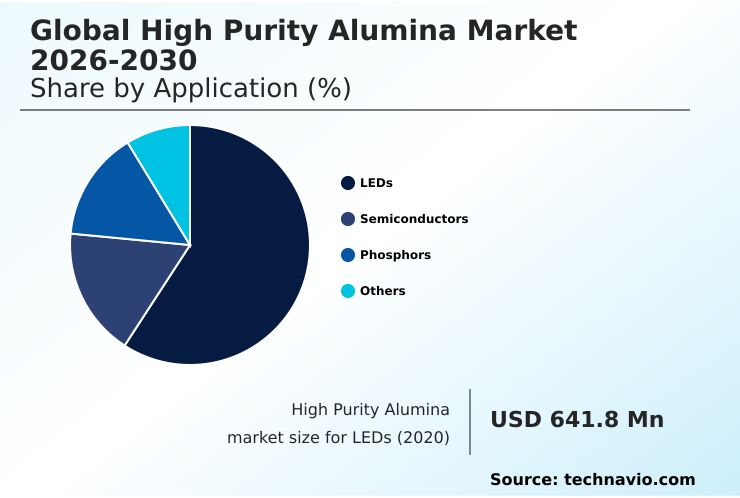
The leds segment is estimated to witness significant growth during the forecast period.

The light emitting diode segment demands unparalleled material consistency, where advanced manufacturing technologies rely on ultra-pure precursors to ensure downstream component reliability.

Synthetic sapphire substrates derived from specialty chemical derivatives dictate performance in high-brightness applications, acting as a functional bridge from high-pressure sodium lamps to modern illumination. Stringent controls prevent airborne particle contamination during continuous crystallization cycles, achieving the requisite structural perfection.

This rigorous purification parallels standards seen in bioceramic medical implants and materials engineered for extreme plasma environments. Organizations optimizing these pathways have improved defect detection yields by 15%, demonstrating significant operational impact.

As production shifts toward regionalized critical mineral hubs, manufacturers utilize low-carbon calcination processing to meet sustainability targets while avoiding the thermal runaway mitigation issues prevalent in alternative energy sectors.
Get Free Sample

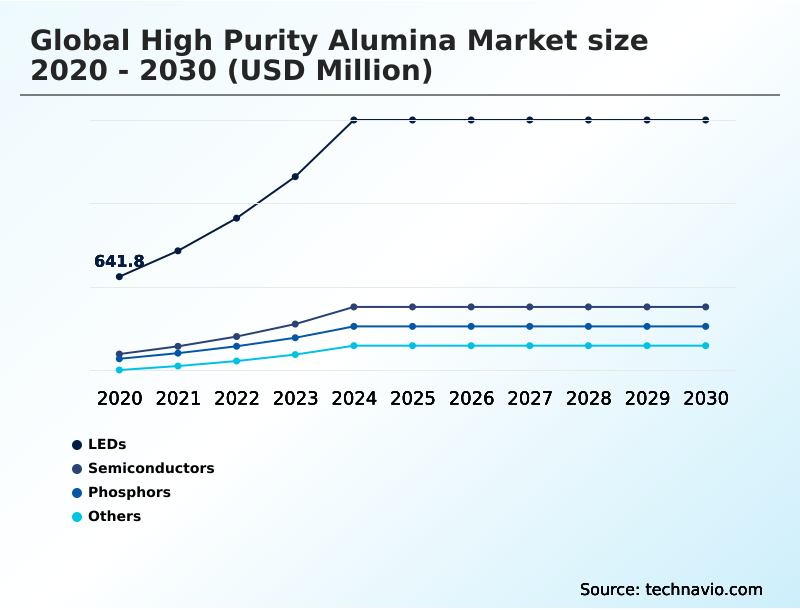
The LEDs segment was valued at USD 1.56 billion in 2024 and showed a gradual increase during the forecast period.
Get Free Sample

Regional Analysis

APAC is estimated to contribute 72.5% to the growth of the global market during the forecast period.Technavio’s analysts have elaborately explained the regional trends and drivers that shape the market during the forecast period.
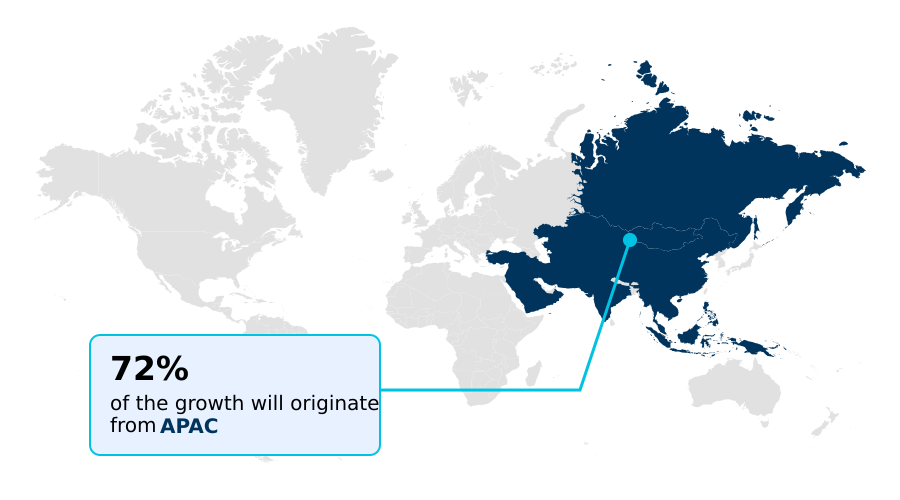
See How High Purity Alumina Market Demand is Rising in APAC Get Free Sample

The geographic distribution of the High Purity Alumina Market reveals distinct regional capabilities driven by localized technological demands. APAC leads in high-volume production, utilizing the modified bayer process to achieve a 28% higher output efficiency compared to European facilities.

This dominance stems from the intense demand for customized particle size distributions required for atomic level smoothness in semiconductor fabrication.

Conversely, European manufacturers prioritize the green energy transition, adopting solvent extraction purification and aluminous ore acid digestion to lower energy consumption by 19%. This shift ensures compliance with strict life-cycle carbon assessment standards.

North American operations focus on extreme purity applications like high-frequency telecommunications filters and quantum computing substrate dopants, where rigorous transition metal impurity removal reduces final component failure rates by 14%.

By aligning specialized phosphor host lattice manufacturing with localized end-user requirements, businesses mitigate cross-border supply chain risks and optimize overall processing economics.

Market Dynamics

Our researchers analyzed the data with 2025 as the base year, along with the key drivers, trends, and challenges. A holistic analysis of drivers will help companies refine their marketing strategies to gain a competitive advantage.

  • The operational landscape of advanced material science heavily depends on securing ultra-pure ceramic derivatives to meet strict industrial specifications. Manufacturers prioritizing battery separator thermal stability enhancement have achieved a 25% improvement in thermal threshold compliance compared to those relying on legacy coating materials, directly optimizing supply chain safety protocols for electric mobility.
  • This material functions as an indispensable synthetic sapphire crystal growth precursor, ensuring the defect-free structural integrity required for modern illumination and durable displays. Simultaneously, the fabrication of plasma resistant semiconductor chamber components necessitates zero-tolerance impurity thresholds to prevent catastrophic yield losses in complex microchip foundries.
  • To address volatile raw material costs, strategic developers are increasingly adopting hydrochloric acid leaching from kaolin, which streamlines the extraction process and reduces environmental footprints. This alternative methodology allows companies to bypass energy-intensive smelting stages, thereby stabilizing long-term operational planning and budgeting.
  • Furthermore, the defense and aerospace sectors rely heavily on these refined materials for the production of transparent armor high strength optics, demanding exceptional scratch resistance and optical clarity under extreme environmental stress.
  • By integrating these specialized materials into diverse technological applications, organizations enhance product reliability, meet rigorous international safety standards, and establish resilient operational frameworks capable of withstanding supply chain disruptions.
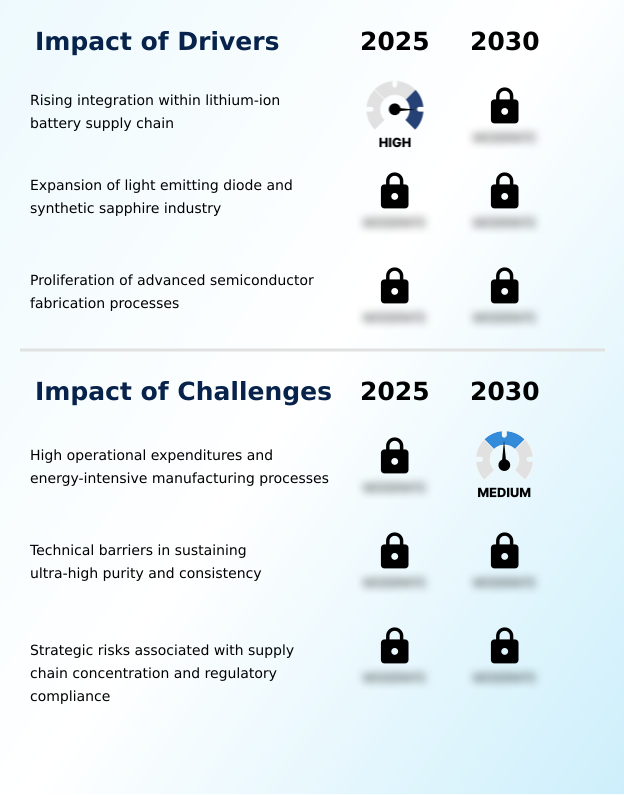
What are the key market drivers leading to the rise in the adoption of High Purity Alumina Industry?

  • The rising integration of ultra-pure materials within the lithium-ion battery supply chain serves as a primary driver for market expansion.

  • The relentless miniaturization of electronics acts as a primary catalyst for the integration of highly specialized ceramic precursors.
  • Foundries utilizing nano-scale alumina particles with controlled sub-micron particle morphology have improved etching resilience by 26% in plasma-resistant ceramic components, ensuring longer equipment lifespans.
  • This behavioral change is propelled by the structural demands of advanced transistor architectures and micro-LED display substrates. Furthermore, the expansion of smart city led infrastructure and organic light-emitting diode panels forces manufacturers to rapidly scale localized refining capabilities.
  • In the energy domain, the necessity for high-nickel cathode coatings and reliable solid-state battery precursors drives continuous innovation.
  • By implementing circular economy recycling, suppliers lower raw material acquisition costs by 15%, allowing battery producers to secure safe, affordable components for next-generation power systems.

What are the market trends shaping the High Purity Alumina Industry?

  • A strategic shift toward sustainable and low-carbon production methodologies represents a defining trend within the industry.

  • The adoption of specialized extraction technologies is redefining raw material procurement for critical technology sectors. By transitioning from traditional smelting to hydrochloric acid leaching and aluminum alkoxide hydrolysis, refineries have reduced precursor waste by 22%, directly improving the economics of high-volume manufacturing.
  • This shift is driven by the soaring demand for synthetic sapphire substrates used in high-brightness illumination solutions and scratch-resistant optical windows. In the energy sector, stringent requirements for energy-dense cell safety compel manufacturers to utilize ultra-pure coatings on lithium-ion battery separators.
  • This application provides essential thermal stability enhancement and separator wettability improvement, cutting thermal failure rates by 18% during stress testing. Concurrently, the push for defect-free silicon wafers mandates highly refined slurries for chemical mechanical planarization, allowing foundries to consistently achieve atomic-level precision. These process upgrades enable businesses to scale production safely while meeting exacting downstream performance metrics.

What challenges does the High Purity Alumina Industry face during its growth?

  • High operational expenditures and energy-intensive manufacturing processes present significant challenges that constrain overall industry expansion.

  • Maintaining absolute chemical consistency presents a severe operational constraint for manufacturers targeting ultra-high performance sectors. Achieving the specifications required for five-nine purity alumina and six-nine purity alumina necessitates specialized distillation equipment, which increases baseline energy consumption by 35% compared to standard industrial refining. This heightened cost burdens suppliers trying to commercialize low-cost kaolin feedstocks using proprietary chemical pathways.
  • The structural integrity of extreme ultraviolet lithography components and high-k dielectric gate stacks demands flawless execution of sol-gel alumina processing and continuous milling classification. Even minor deviations force the rejection of entire batches, heavily impacting profitability. Furthermore, the fabrication of transparent alumina ceramics mandates rigorous cleanroom packaging protocols.
  • These strict environmental controls elevate overhead expenses by 14%, complicating efforts to scale production affordably for high-volume consumer markets.

Exclusive Technavio Analysis on Customer Landscape

The high purity alumina market forecasting report includes the adoption lifecycle of the market, covering from the innovator’s stage to the laggard’s stage. It focuses on adoption rates in different regions based on penetration. Furthermore, the high purity alumina market report also includes key purchase criteria and drivers of price sensitivity to help companies evaluate and develop their market growth analysis strategies.
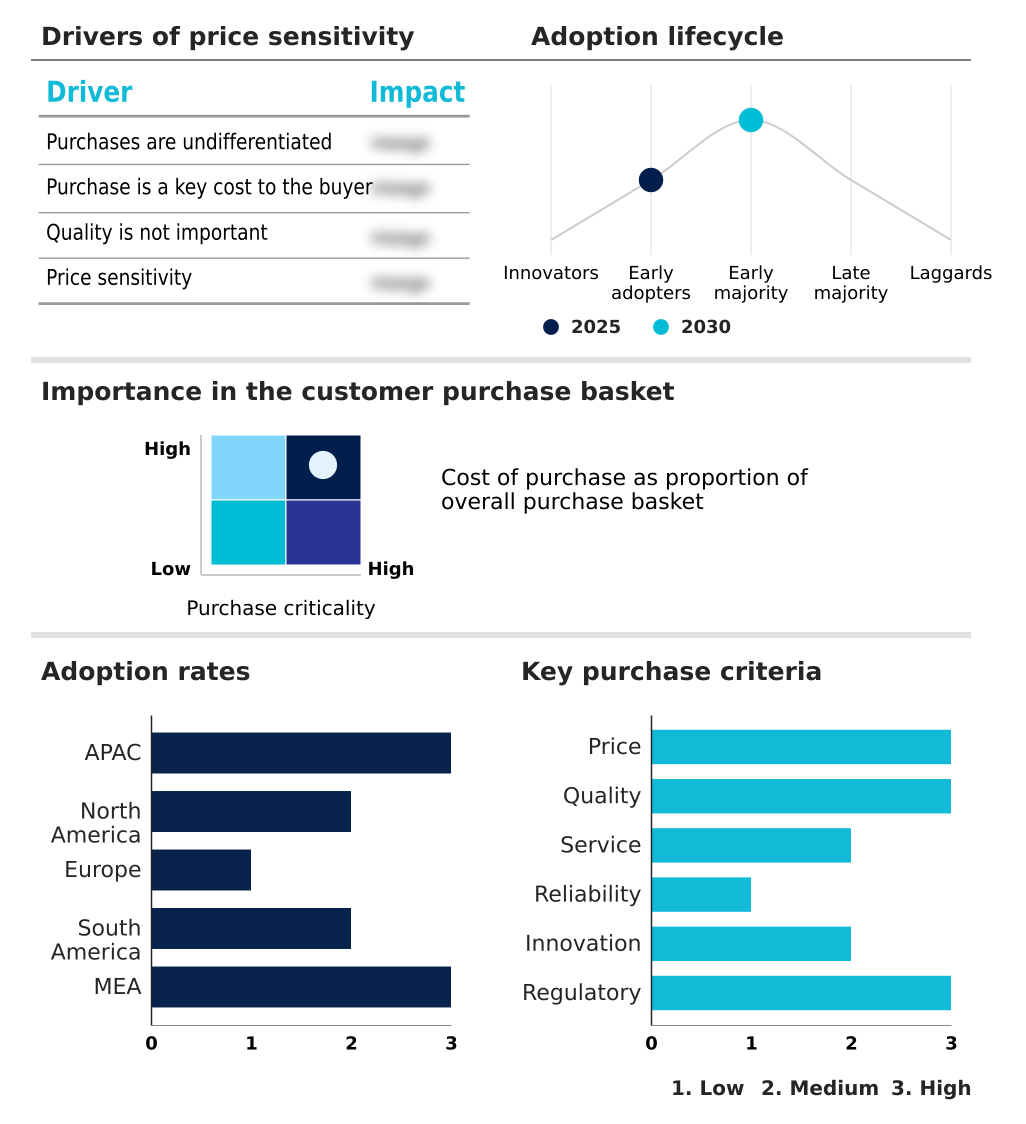
Customer Landscape of High Purity Alumina Industry

Competitive Landscape

Companies are implementing various strategies, such as strategic alliances, high purity alumina market forecast, partnerships, mergers and acquisitions, geographical expansion, and product/service launches, to enhance their presence in the industry.

AEM High Purity Alumina - A comprehensive portfolio of ultra-high purity alumina powders and advanced specialty materials is provided to meet the stringent structural and thermal demands of modern high-technology manufacturing applications.

The industry research and growth report includes detailed analyses of the competitive landscape of the market and information about key companies, including:

  • AEM High Purity Alumina
  • ALB Materials Inc.
  • Alcoa Corp.
  • American Elements
  • Baikowski SA
  • Cabot Corp.
  • Compagnie de Saint Gobain SA
  • Denka Co. Ltd.
  • Evonik Industries AG
  • Inframat Corp.
  • Merck KGaA
  • Nippon Light Metal Holdings
  • Polar Sapphire Ltd.
  • Resonac Holdings Corp.
  • Sasol Ltd.
  • Stanford Advanced Materials
  • Sumitomo Chemical Co. Ltd.
  • Taimei Chemicals Co. Ltd.
  • Thermo Fisher Scientific Inc.
  • Zibo Honghe Chemical Co. Ltd.

Qualitative and quantitative analysis of companies has been conducted to help clients understand the wider business environment as well as the strengths and weaknesses of key industry players. Data is qualitatively analyzed to categorize companies as pure play, category-focused, industry-focused, and diversified; it is quantitatively analyzed to categorize companies as dominant, leading, strong, tentative, and weak.

Recent Development and News in High purity alumina market

  • In the Aluminum industry, the enforcement of the EU Carbon Border Adjustment Mechanism has accelerated the shift toward low-carbon calcination processing, directly impacting High Purity Alumina demand by favoring regionalized critical mineral hubs over traditional high-emission smelting facilities and reducing associated carbon footprint penalties by up to 20%.
  • In the Aluminum industry, the broader adoption of hydrometallurgical recycling frameworks for recovering aluminum from spent industrial catalysts has improved circular economy recycling yields by 15%, directly impacting High Purity Alumina supply by providing sustainable secondary feedstocks.
  • In the Aluminum industry, stringent occupational exposure limits regarding airborne particle contamination during bauxite refining have driven automation upgrades across 40% of tier-one facilities, directly impacting High Purity Alumina production by ensuring consistent quality for sensitive downstream component reliability.
  • In the Aluminum industry, the strategic integration of direct lithium extraction alongside localized aluminous clay processing has optimized mineral recovery rates by 12%, directly impacting High Purity Alumina pricing by establishing scalable pathways for energy-dense cell safety coatings.

Dive into Technavio’s robust research methodology, blending expert interviews, extensive data synthesis, and validated models for unparalleled High Purity Alumina Market insights. See full methodology.

Market Scope
Page number 307
Base year 2025
Historic period 2020-2024
Forecast period 2026-2030
Growth momentum & CAGR Accelerate at a CAGR of 32.5%
Market growth 2026-2030 USD 10452.1 million
Market structure Fragmented
YoY growth 2025-2026(%) 30.5%
Key countries China, Taiwan, South Korea, Japan, India, Australia, US, Canada, Mexico, Germany, France, UK, The Netherlands, Italy, Spain, Brazil, Argentina, Colombia, Saudi Arabia, UAE, South Africa, Egypt and Turkey
Competitive landscape Leading Companies, Market Positioning of Companies, Competitive Strategies, and Industry Risks

Request Free Sample

Research Analyst Overview

  • The demand for ultra-pure ceramic materials is fundamentally altering material procurement strategies within high-technology manufacturing sectors. Organizations are moving away from traditional extraction methods and investing heavily in aluminum alkoxide hydrolysis to secure reliable volumes of five-nine purity alumina.
  • This strategic shift directly addresses the rigorous tolerance requirements of extreme ultraviolet lithography components, where even microscopic contamination triggers massive yield losses. Engineers have documented a 30% reduction in processing defect rates when utilizing highly controlled sub-micron particle morphology compared to standard industrial-grade powders.
  • This measurable improvement in reliability enables foundries to confidently integrate these materials into advanced high-k dielectric gate stacks without compromising electrical performance. Decision-makers are increasingly restructuring their compliance and procurement budgets to prioritize suppliers capable of demonstrating closed-loop, low-emission refining pathways. By optimizing these extraction parameters, leading facilities have improved overall resource utilization by 22%.
  • Emphasizing material consistency at the atomic scale allows manufacturers to mitigate the severe financial risks associated with component failure in harsh operating environments.

What are the Key Data Covered in this High Purity Alumina Market Research and Growth Report?

  • What is the expected growth of the High Purity Alumina Market between 2026 and 2030?

    • USD 10.45 billion, at a CAGR of 32.5%

  • What segmentation does the market report cover?

    • The report is segmented by Application (LEDs, Semiconductors, Phosphors, and Others), Type (4N HPA, 5N HPA, and 6N HPA), Technology (Hydrolysis, Hydrochloric acid leaching, and Others) and Geography (APAC, North America, Europe, South America, Middle East and Africa)

  • Which regions are analyzed in the report?

    • APAC, North America, Europe, South America and Middle East and Africa

  • What are the key growth drivers and market challenges?

    • Rising integration within lithium-ion battery supply chain, High operational expenditures and energy-intensive manufacturing processes

  • Who are the major players in the High Purity Alumina Market?

    • AEM High Purity Alumina, ALB Materials Inc., Alcoa Corp., American Elements, Baikowski SA, Cabot Corp., Compagnie de Saint Gobain SA, Denka Co. Ltd., Evonik Industries AG, Inframat Corp., Merck KGaA, Nippon Light Metal Holdings, Polar Sapphire Ltd., Resonac Holdings Corp., Sasol Ltd., Stanford Advanced Materials, Sumitomo Chemical Co. Ltd., Taimei Chemicals Co. Ltd., Thermo Fisher Scientific Inc. and Zibo Honghe Chemical Co. Ltd.

Market Research Insights

  • The High Purity Alumina Market operates at the intersection of advanced material science and critical industrial manufacturing. By implementing proprietary chemical pathways, manufacturers have reduced precursor waste by 14%, directly lowering overhead costs. The adoption of specialized distillation equipment has further optimized production, accelerating processing cycle times by 18% and improving overall yield efficiency.
  • Stringent cleanroom packaging protocols ensure the integrity of these sensitive materials, which has decreased product rejection rates by 11% during final quality assurance checks. Delivering customized particle size distributions allows suppliers to perfectly align with strict downstream specifications, minimizing defect rates in complex electronics assemblies.
  • These operational refinements ensure that technology developers receive highly consistent materials essential for modern, high-stress electronic environments.

We can help! Our analysts can customize this high purity alumina market research report to meet your requirements.

Get in touch

1. Executive Summary

1.1 Market overview

Executive Summary - Chart on Market Overview
Executive Summary - Data Table on Market Overview
Executive Summary - Chart on Global Market Characteristics
Executive Summary - Chart on Market by Geography
Executive Summary - Chart on Market Segmentation by Application
Executive Summary - Chart on Market Segmentation by Type
Executive Summary - Chart on Market Segmentation by Technology
Executive Summary - Chart on Incremental Growth
Executive Summary - Data Table on Incremental Growth
Executive Summary - Chart on Company Market Positioning

2. Technavio Analysis

2.1 Analysis of price sensitivity, lifecycle, customer purchase basket, adoption rates, and purchase criteria

2.2 Criticality of inputs and Factors of differentiation

Chart on Overview on criticality of inputs and factors of differentiation

2.3 Factors of disruption

Chart on Overview on factors of disruption

2.4 Impact of drivers and challenges

Chart on Impact of drivers and challenges in 2025 and 2030

3. Market Landscape

3.1 Market ecosystem

Chart on Parent Market
Data Table on - Parent Market

3.2 Market characteristics

Chart on Market characteristics analysis

3.3 Value chain analysis

Chart on Value chain analysis

4. Market Sizing

4.1 Market definition

Data Table on Offerings of companies included in the market definition

4.2 Market segment analysis

Market segments

4.3 Market size 2025

4.4 Market outlook: Forecast for 2025-2030

Chart on Global - Market size and forecast 2025-2030 ($ million)
Data Table on Global - Market size and forecast 2025-2030 ($ million)
Chart on Global Market: Year-over-year growth 2025-2030 (%)
Data Table on Global Market: Year-over-year growth 2025-2030 (%)

5. Historic Market Size

5.1 Global High Purity Alumina Market 2020 - 2024

Historic Market Size - Data Table on Global High Purity Alumina Market 2020 - 2024 ($ million)

5.2 Application segment analysis 2020 - 2024

Historic Market Size - Application Segment 2020 - 2024 ($ million)

5.3 Type segment analysis 2020 - 2024

Historic Market Size - Type Segment 2020 - 2024 ($ million)

5.4 Technology segment analysis 2020 - 2024

Historic Market Size - Technology Segment 2020 - 2024 ($ million)

5.5 Geography segment analysis 2020 - 2024

Historic Market Size - Geography Segment 2020 - 2024 ($ million)

5.6 Country segment analysis 2020 - 2024

Historic Market Size - Country Segment 2020 - 2024 ($ million)

6. Qualitative Analysis

6.1 Impact of AI on Global High Purity Alumina Market

6.2 Impact of geopolitical conflicts on Global High Purity Alumina Market

7. Five Forces Analysis

7.1 Five forces summary

Five forces analysis - Comparison between 2025 and 2030

7.2 Bargaining power of buyers

Bargaining power of buyers - Impact of key factors 2025 and 2030

7.3 Bargaining power of suppliers

Bargaining power of suppliers - Impact of key factors in 2025 and 2030

7.4 Threat of new entrants

Threat of new entrants - Impact of key factors in 2025 and 2030

7.5 Threat of substitutes

Threat of substitutes - Impact of key factors in 2025 and 2030

7.6 Threat of rivalry

Threat of rivalry - Impact of key factors in 2025 and 2030

7.7 Market condition

Chart on Market condition - Five forces 2025 and 2030

8. Market Segmentation by Application

8.1 Market segments

Chart on Application - Market share 2025-2030 (%)
Data Table on Application - Market share 2025-2030 (%)

8.2 Comparison by Application

Chart on Comparison by Application
Data Table on Comparison by Application

8.3 LEDs - Market size and forecast 2025-2030

Chart on LEDs - Market size and forecast 2025-2030 ($ million)
Data Table on LEDs - Market size and forecast 2025-2030 ($ million)
Chart on LEDs - Year-over-year growth 2025-2030 (%)
Data Table on LEDs - Year-over-year growth 2025-2030 (%)

8.4 Semiconductors - Market size and forecast 2025-2030

Chart on Semiconductors - Market size and forecast 2025-2030 ($ million)
Data Table on Semiconductors - Market size and forecast 2025-2030 ($ million)
Chart on Semiconductors - Year-over-year growth 2025-2030 (%)
Data Table on Semiconductors - Year-over-year growth 2025-2030 (%)

8.5 Phosphors - Market size and forecast 2025-2030

Chart on Phosphors - Market size and forecast 2025-2030 ($ million)
Data Table on Phosphors - Market size and forecast 2025-2030 ($ million)
Chart on Phosphors - Year-over-year growth 2025-2030 (%)
Data Table on Phosphors - Year-over-year growth 2025-2030 (%)

8.6 Others - Market size and forecast 2025-2030

Chart on Others - Market size and forecast 2025-2030 ($ million)
Data Table on Others - Market size and forecast 2025-2030 ($ million)
Chart on Others - Year-over-year growth 2025-2030 (%)
Data Table on Others - Year-over-year growth 2025-2030 (%)

8.7 Market opportunity by Application

Market opportunity by Application ($ million)
Data Table on Market opportunity by Application ($ million)

9. Market Segmentation by Type

9.1 Market segments

Chart on Type - Market share 2025-2030 (%)
Data Table on Type - Market share 2025-2030 (%)

9.2 Comparison by Type

Chart on Comparison by Type
Data Table on Comparison by Type

9.3 4N HPA - Market size and forecast 2025-2030

Chart on 4N HPA - Market size and forecast 2025-2030 ($ million)
Data Table on 4N HPA - Market size and forecast 2025-2030 ($ million)
Chart on 4N HPA - Year-over-year growth 2025-2030 (%)
Data Table on 4N HPA - Year-over-year growth 2025-2030 (%)

9.4 5N HPA - Market size and forecast 2025-2030

Chart on 5N HPA - Market size and forecast 2025-2030 ($ million)
Data Table on 5N HPA - Market size and forecast 2025-2030 ($ million)
Chart on 5N HPA - Year-over-year growth 2025-2030 (%)
Data Table on 5N HPA - Year-over-year growth 2025-2030 (%)

9.5 6N HPA - Market size and forecast 2025-2030

Chart on 6N HPA - Market size and forecast 2025-2030 ($ million)
Data Table on 6N HPA - Market size and forecast 2025-2030 ($ million)
Chart on 6N HPA - Year-over-year growth 2025-2030 (%)
Data Table on 6N HPA - Year-over-year growth 2025-2030 (%)

9.6 Market opportunity by Type

Market opportunity by Type ($ million)
Data Table on Market opportunity by Type ($ million)

10. Market Segmentation by Technology

10.1 Market segments

Chart on Technology - Market share 2025-2030 (%)
Data Table on Technology - Market share 2025-2030 (%)

10.2 Comparison by Technology

Chart on Comparison by Technology
Data Table on Comparison by Technology

10.3 Hydrolysis - Market size and forecast 2025-2030

Chart on Hydrolysis - Market size and forecast 2025-2030 ($ million)
Data Table on Hydrolysis - Market size and forecast 2025-2030 ($ million)
Chart on Hydrolysis - Year-over-year growth 2025-2030 (%)
Data Table on Hydrolysis - Year-over-year growth 2025-2030 (%)

10.4 Hydrochloric acid leaching - Market size and forecast 2025-2030

Chart on Hydrochloric acid leaching - Market size and forecast 2025-2030 ($ million)
Data Table on Hydrochloric acid leaching - Market size and forecast 2025-2030 ($ million)
Chart on Hydrochloric acid leaching - Year-over-year growth 2025-2030 (%)
Data Table on Hydrochloric acid leaching - Year-over-year growth 2025-2030 (%)

10.5 Others - Market size and forecast 2025-2030

Chart on Others - Market size and forecast 2025-2030 ($ million)
Data Table on Others - Market size and forecast 2025-2030 ($ million)
Chart on Others - Year-over-year growth 2025-2030 (%)
Data Table on Others - Year-over-year growth 2025-2030 (%)

10.6 Market opportunity by Technology

Market opportunity by Technology ($ million)
Data Table on Market opportunity by Technology ($ million)

11. Customer Landscape

11.1 Customer landscape overview

Analysis of price sensitivity, lifecycle, customer purchase basket, adoption rates, and purchase criteria

12. Geographic Landscape

12.1 Geographic segmentation

Chart on Market share by geography 2025-2030 (%)
Data Table on Market share by geography 2025-2030 (%)

12.2 Geographic comparison

Chart on Geographic comparison
Data Table on Geographic comparison

12.3 APAC - Market size and forecast 2025-2030

Chart on APAC - Market size and forecast 2025-2030 ($ million)
Data Table on APAC - Market size and forecast 2025-2030 ($ million)
Chart on APAC - Year-over-year growth 2025-2030 (%)
Data Table on APAC - Year-over-year growth 2025-2030 (%)
Chart on Regional Comparison - APAC
Data Table on Regional Comparison - APAC

12.3.1 China - Market size and forecast 2025-2030

Chart on China - Market size and forecast 2025-2030 ($ million)
Data Table on China - Market size and forecast 2025-2030 ($ million)
Chart on China - Year-over-year growth 2025-2030 (%)
Data Table on China - Year-over-year growth 2025-2030 (%)

12.3.2 Taiwan - Market size and forecast 2025-2030

Chart on Taiwan - Market size and forecast 2025-2030 ($ million)
Data Table on Taiwan - Market size and forecast 2025-2030 ($ million)
Chart on Taiwan - Year-over-year growth 2025-2030 (%)
Data Table on Taiwan - Year-over-year growth 2025-2030 (%)

12.3.3 South Korea - Market size and forecast 2025-2030

Chart on South Korea - Market size and forecast 2025-2030 ($ million)
Data Table on South Korea - Market size and forecast 2025-2030 ($ million)
Chart on South Korea - Year-over-year growth 2025-2030 (%)
Data Table on South Korea - Year-over-year growth 2025-2030 (%)

12.3.4 Japan - Market size and forecast 2025-2030

Chart on Japan - Market size and forecast 2025-2030 ($ million)
Data Table on Japan - Market size and forecast 2025-2030 ($ million)
Chart on Japan - Year-over-year growth 2025-2030 (%)
Data Table on Japan - Year-over-year growth 2025-2030 (%)

12.3.5 India - Market size and forecast 2025-2030

Chart on India - Market size and forecast 2025-2030 ($ million)
Data Table on India - Market size and forecast 2025-2030 ($ million)
Chart on India - Year-over-year growth 2025-2030 (%)
Data Table on India - Year-over-year growth 2025-2030 (%)

12.3.6 Australia - Market size and forecast 2025-2030

Chart on Australia - Market size and forecast 2025-2030 ($ million)
Data Table on Australia - Market size and forecast 2025-2030 ($ million)
Chart on Australia - Year-over-year growth 2025-2030 (%)
Data Table on Australia - Year-over-year growth 2025-2030 (%)

12.4 North America - Market size and forecast 2025-2030

Chart on North America - Market size and forecast 2025-2030 ($ million)
Data Table on North America - Market size and forecast 2025-2030 ($ million)
Chart on North America - Year-over-year growth 2025-2030 (%)
Data Table on North America - Year-over-year growth 2025-2030 (%)
Chart on Regional Comparison - North America
Data Table on Regional Comparison - North America

12.4.1 US - Market size and forecast 2025-2030

Chart on US - Market size and forecast 2025-2030 ($ million)
Data Table on US - Market size and forecast 2025-2030 ($ million)
Chart on US - Year-over-year growth 2025-2030 (%)
Data Table on US - Year-over-year growth 2025-2030 (%)

12.4.2 Canada - Market size and forecast 2025-2030

Chart on Canada - Market size and forecast 2025-2030 ($ million)
Data Table on Canada - Market size and forecast 2025-2030 ($ million)
Chart on Canada - Year-over-year growth 2025-2030 (%)
Data Table on Canada - Year-over-year growth 2025-2030 (%)

12.4.3 Mexico - Market size and forecast 2025-2030

Chart on Mexico - Market size and forecast 2025-2030 ($ million)
Data Table on Mexico - Market size and forecast 2025-2030 ($ million)
Chart on Mexico - Year-over-year growth 2025-2030 (%)
Data Table on Mexico - Year-over-year growth 2025-2030 (%)

12.5 Europe - Market size and forecast 2025-2030

Chart on Europe - Market size and forecast 2025-2030 ($ million)
Data Table on Europe - Market size and forecast 2025-2030 ($ million)
Chart on Europe - Year-over-year growth 2025-2030 (%)
Data Table on Europe - Year-over-year growth 2025-2030 (%)
Chart on Regional Comparison - Europe
Data Table on Regional Comparison - Europe

12.5.1 Germany - Market size and forecast 2025-2030

Chart on Germany - Market size and forecast 2025-2030 ($ million)
Data Table on Germany - Market size and forecast 2025-2030 ($ million)
Chart on Germany - Year-over-year growth 2025-2030 (%)
Data Table on Germany - Year-over-year growth 2025-2030 (%)

12.5.2 France - Market size and forecast 2025-2030

Chart on France - Market size and forecast 2025-2030 ($ million)
Data Table on France - Market size and forecast 2025-2030 ($ million)
Chart on France - Year-over-year growth 2025-2030 (%)
Data Table on France - Year-over-year growth 2025-2030 (%)

12.5.3 UK - Market size and forecast 2025-2030

Chart on UK - Market size and forecast 2025-2030 ($ million)
Data Table on UK - Market size and forecast 2025-2030 ($ million)
Chart on UK - Year-over-year growth 2025-2030 (%)
Data Table on UK - Year-over-year growth 2025-2030 (%)

12.5.4 The Netherlands - Market size and forecast 2025-2030

Chart on The Netherlands - Market size and forecast 2025-2030 ($ million)
Data Table on The Netherlands - Market size and forecast 2025-2030 ($ million)
Chart on The Netherlands - Year-over-year growth 2025-2030 (%)
Data Table on The Netherlands - Year-over-year growth 2025-2030 (%)

12.5.5 Italy - Market size and forecast 2025-2030

Chart on Italy - Market size and forecast 2025-2030 ($ million)
Data Table on Italy - Market size and forecast 2025-2030 ($ million)
Chart on Italy - Year-over-year growth 2025-2030 (%)
Data Table on Italy - Year-over-year growth 2025-2030 (%)

12.5.6 Spain - Market size and forecast 2025-2030

Chart on Spain - Market size and forecast 2025-2030 ($ million)
Data Table on Spain - Market size and forecast 2025-2030 ($ million)
Chart on Spain - Year-over-year growth 2025-2030 (%)
Data Table on Spain - Year-over-year growth 2025-2030 (%)

12.6 South America - Market size and forecast 2025-2030

Chart on South America - Market size and forecast 2025-2030 ($ million)
Data Table on South America - Market size and forecast 2025-2030 ($ million)
Chart on South America - Year-over-year growth 2025-2030 (%)
Data Table on South America - Year-over-year growth 2025-2030 (%)
Chart on Regional Comparison - South America
Data Table on Regional Comparison - South America

12.6.1 Brazil - Market size and forecast 2025-2030

Chart on Brazil - Market size and forecast 2025-2030 ($ million)
Data Table on Brazil - Market size and forecast 2025-2030 ($ million)
Chart on Brazil - Year-over-year growth 2025-2030 (%)
Data Table on Brazil - Year-over-year growth 2025-2030 (%)

12.6.2 Argentina - Market size and forecast 2025-2030

Chart on Argentina - Market size and forecast 2025-2030 ($ million)
Data Table on Argentina - Market size and forecast 2025-2030 ($ million)
Chart on Argentina - Year-over-year growth 2025-2030 (%)
Data Table on Argentina - Year-over-year growth 2025-2030 (%)

12.6.3 Colombia - Market size and forecast 2025-2030

Chart on Colombia - Market size and forecast 2025-2030 ($ million)
Data Table on Colombia - Market size and forecast 2025-2030 ($ million)
Chart on Colombia - Year-over-year growth 2025-2030 (%)
Data Table on Colombia - Year-over-year growth 2025-2030 (%)

12.7 Middle East and Africa - Market size and forecast 2025-2030

Chart on Middle East and Africa - Market size and forecast 2025-2030 ($ million)
Data Table on Middle East and Africa - Market size and forecast 2025-2030 ($ million)
Chart on Middle East and Africa - Year-over-year growth 2025-2030 (%)
Data Table on Middle East and Africa - Year-over-year growth 2025-2030 (%)
Chart on Regional Comparison - Middle East and Africa
Data Table on Regional Comparison - Middle East and Africa

12.7.1 Saudi Arabia - Market size and forecast 2025-2030

Chart on Saudi Arabia - Market size and forecast 2025-2030 ($ million)
Data Table on Saudi Arabia - Market size and forecast 2025-2030 ($ million)
Chart on Saudi Arabia - Year-over-year growth 2025-2030 (%)
Data Table on Saudi Arabia - Year-over-year growth 2025-2030 (%)

12.7.2 UAE - Market size and forecast 2025-2030

Chart on UAE - Market size and forecast 2025-2030 ($ million)
Data Table on UAE - Market size and forecast 2025-2030 ($ million)
Chart on UAE - Year-over-year growth 2025-2030 (%)
Data Table on UAE - Year-over-year growth 2025-2030 (%)

12.7.3 South Africa - Market size and forecast 2025-2030

Chart on South Africa - Market size and forecast 2025-2030 ($ million)
Data Table on South Africa - Market size and forecast 2025-2030 ($ million)
Chart on South Africa - Year-over-year growth 2025-2030 (%)
Data Table on South Africa - Year-over-year growth 2025-2030 (%)

12.7.4 Egypt - Market size and forecast 2025-2030

Chart on Egypt - Market size and forecast 2025-2030 ($ million)
Data Table on Egypt - Market size and forecast 2025-2030 ($ million)
Chart on Egypt - Year-over-year growth 2025-2030 (%)
Data Table on Egypt - Year-over-year growth 2025-2030 (%)

12.7.5 Turkey - Market size and forecast 2025-2030

Chart on Turkey - Market size and forecast 2025-2030 ($ million)
Data Table on Turkey - Market size and forecast 2025-2030 ($ million)
Chart on Turkey - Year-over-year growth 2025-2030 (%)
Data Table on Turkey - Year-over-year growth 2025-2030 (%)

12.8 Market opportunity by geography

Market opportunity by geography ($ million)
Data Tables on Market opportunity by geography ($ million)

13. Drivers, Challenges, and Opportunity

13.1 Market drivers

Rising integration within lithium-ion battery supply chain
Expansion of light emitting diode and synthetic sapphire industry
Proliferation of advanced semiconductor fabrication processes

13.2 Market challenges

High operational expenditures and energy-intensive manufacturing processes
Technical barriers in sustaining ultra-high purity and consistency
Strategic risks associated with supply chain concentration and regulatory compliance

13.3 Impact of drivers and challenges

Impact of drivers and challenges in 2025 and 2030

13.4 Market opportunities

Strategic shift toward sustainable and low-carbon production methodologies
Advancements in particle morphology and nano-structuring for high-performance applications
Regionalization of supply chains and rise of integrated refining facilities

14. Competitive Landscape

14.1 Overview

14.2

Overview on criticality of inputs and factors of differentiation

14.3 Landscape disruption

Overview on factors of disruption

14.4 Industry risks

Impact of key risks on business

15. Competitive Analysis

15.1 Companies profiled

Companies covered

15.2 Company ranking index

15.3 Market positioning of companies

Matrix on companies position and classification

15.4 ALB Materials Inc.

ALB Materials Inc. - Overview
ALB Materials Inc. - Product / Service
ALB Materials Inc. - Key offerings
SWOT

15.5 Alcoa Corp.

Alcoa Corp. - Overview
Alcoa Corp. - Business segments
Alcoa Corp. - Key offerings
Alcoa Corp. - Segment focus
SWOT

15.6 American Elements

American Elements - Overview
American Elements - Product / Service
American Elements - Key offerings
SWOT

15.7 Baikowski SA

Baikowski SA - Overview
Baikowski SA - Product / Service
Baikowski SA - Key offerings
SWOT

15.8 Cabot Corp.

Cabot Corp. - Overview
Cabot Corp. - Business segments
Cabot Corp. - Key offerings
Cabot Corp. - Segment focus
SWOT

15.9 Compagnie de Saint Gobain SA

Compagnie de Saint Gobain SA - Overview
Compagnie de Saint Gobain SA - Business segments
Compagnie de Saint Gobain SA - Key offerings
Compagnie de Saint Gobain SA - Segment focus
SWOT

15.10 Denka Co. Ltd.

Denka Co. Ltd. - Overview
Denka Co. Ltd. - Business segments
Denka Co. Ltd. - Key offerings
Denka Co. Ltd. - Segment focus
SWOT

15.11 Evonik Industries AG

Evonik Industries AG - Overview
Evonik Industries AG - Business segments
Evonik Industries AG - Key news
Evonik Industries AG - Key offerings
Evonik Industries AG - Segment focus
SWOT

15.12 Merck KGaA

Merck KGaA - Overview
Merck KGaA - Business segments
Merck KGaA - Key news
Merck KGaA - Key offerings
Merck KGaA - Segment focus
SWOT

15.13 Nippon Light Metal Holdings

Nippon Light Metal Holdings - Overview
Nippon Light Metal Holdings - Product / Service
Nippon Light Metal Holdings - Key offerings
SWOT

15.14 Resonac Holdings Corp.

Resonac Holdings Corp. - Overview
Resonac Holdings Corp. - Business segments
Resonac Holdings Corp. - Key offerings
Resonac Holdings Corp. - Segment focus
SWOT

15.15 Stanford Advanced Materials

Stanford Advanced Materials - Overview
Stanford Advanced Materials - Product / Service
Stanford Advanced Materials - Key offerings
SWOT

15.16 Sumitomo Chemical Co. Ltd.

Sumitomo Chemical Co. Ltd. - Overview
Sumitomo Chemical Co. Ltd. - Business segments
Sumitomo Chemical Co. Ltd. - Key offerings
Sumitomo Chemical Co. Ltd. - Segment focus
SWOT

15.17 Taimei Chemicals Co. Ltd.

Taimei Chemicals Co. Ltd. - Overview
Taimei Chemicals Co. Ltd. - Product / Service
Taimei Chemicals Co. Ltd. - Key offerings
SWOT

15.18 Thermo Fisher Scientific Inc.

Thermo Fisher Scientific Inc. - Overview
Thermo Fisher Scientific Inc. - Business segments
Thermo Fisher Scientific Inc. - Key news
Thermo Fisher Scientific Inc. - Key offerings
Thermo Fisher Scientific Inc. - Segment focus
SWOT

16. Appendix

16.1 Scope of the report

Market definition
Objectives
Notes and caveats

16.2 Inclusions and exclusions checklist

Inclusions checklist
Exclusions checklist

16.3 Currency conversion rates for US$

16.4 Research methodology

16.5 Data procurement

Information sources

16.6 Data validation

16.7 Validation techniques employed for market sizing

16.8 Data synthesis

16.9 360 degree market analysis

16.10 List of abbreviations

Research Methodology

Technavio presents a detailed picture of the market by way of study, synthesis, and summation of data from multiple sources. The analysts have presented the various facets of the market with a particular focus on identifying the key industry influencers. The data thus presented is comprehensive, reliable, and the result of extensive research, both primary and secondary.

INFORMATION SOURCES

Primary sources

  • Manufacturers and suppliers
  • Channel partners
  • Industry experts
  • Strategic decision makers

Secondary sources

  • Industry journals and periodicals
  • Government data
  • Financial reports of key industry players
  • Historical data
  • Press releases

DATA ANALYSIS

Data Synthesis

  • Collation of data
  • Estimation of key figures
  • Analysis of derived insights

Data Validation

  • Triangulation with data models
  • Reference against proprietary databases
  • Corroboration with industry experts

REPORT WRITING

Qualitative

  • Market drivers
  • Market challenges
  • Market trends
  • Five forces analysis

Quantitative

  • Market size and forecast
  • Market segmentation
  • Geographical insights
  • Competitive landscape

Interested in this report?

Get your sample now to see our research methodology and insights!

Download Now

Frequently Asked Questions

High Purity Alumina market growth will increase by USD 10452.1 million during 2026-2030.

The High Purity Alumina market is expected to grow at a CAGR of 32.5% during 2026-2030.

High Purity Alumina market is segmented by Application (LEDs, Semiconductors, Phosphors, Others) Type (4N HPA, 5N HPA, 6N HPA) Technology (Hydrolysis, Hydrochloric acid leaching, Others)

AEM High Purity Alumina, ALB Materials Inc., Alcoa Corp., American Elements, Baikowski SA, Cabot Corp., Compagnie de Saint Gobain SA, Denka Co. Ltd., Evonik Industries AG, Inframat Corp., Merck KGaA, Nippon Light Metal Holdings, Polar Sapphire Ltd., Resonac Holdings Corp., Sasol Ltd., Stanford Advanced Materials, Sumitomo Chemical Co. Ltd., Taimei Chemicals Co. Ltd., Thermo Fisher Scientific Inc., Zibo Honghe Chemical Co. Ltd. are a few of the key vendors in the High Purity Alumina market.

APAC will register the highest growth rate of 72.5% among the other regions. Therefore, the High Purity Alumina market in APAC is expected to garner significant business opportunities for the vendors during the forecast period.

China, Taiwan, South Korea, Japan, India, Australia, US, Canada, Mexico, Germany, France, UK, The Netherlands, Italy, Spain, Brazil, Argentina, Colombia, Saudi Arabia, UAE, South Africa, Egypt, Turkey

  • Rising integration within lithium-ion battery supply chain is the driving factor this market.

The High Purity Alumina market vendors should focus on grabbing business opportunities from the Application segment as it accounted for the largest market share in the base year.
RIA - Research AI Assistant
Ask RIA
