
Gummy Vitamin Market Analysis, Size, and Forecast 2026-2030: APAC (China, Japan, and India), North America (US, Canada, and Mexico), South America (Brazil, Argentina, and Chile), Europe (Germany, UK, and France), Middle East and Africa (Saudi Arabia, UAE, and South Africa), and Rest of World (ROW)

Gummy Vitamin Market Analysis, Size, and Forecast 2026-2030:
APAC (China, Japan, and India), North America (US, Canada, and Mexico), South America (Brazil, Argentina, and Chile), Europe (Germany, UK, and France), Middle East and Africa (Saudi Arabia, UAE, and South Africa), and Rest of World (ROW)

Published: Oct 2026 276 Pages SKU: IRTNTR72227

Market Overview at a Glance

$6.38 B
Market Opportunity
13%
CAGR 2025 - 2030
34.3%
APAC Growth
$4.37 B
Online segment 2024

Gummy Vitamin Market Size 2026-2030

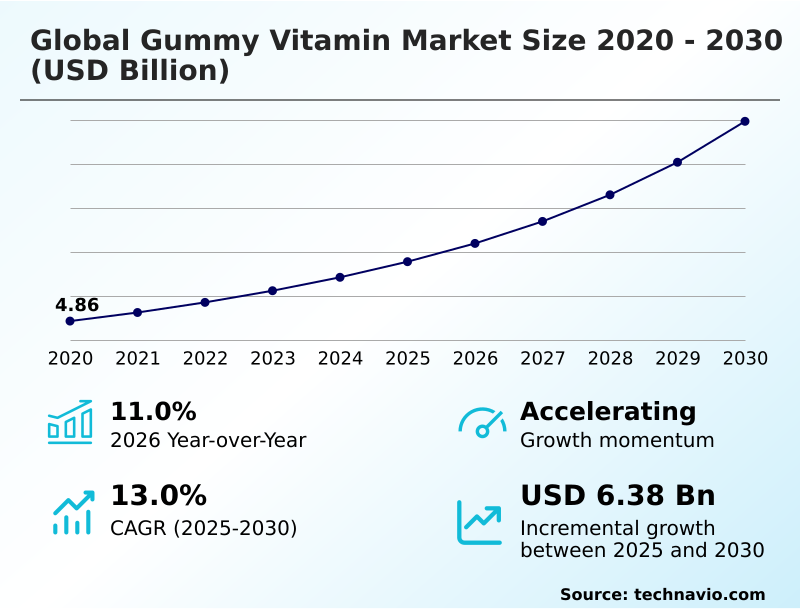
The gummy vitamin market size is valued to increase by USD 6.38 billion, at a CAGR of 13% from 2025 to 2030. Surging demand for palatable and convenient supplement formats will drive the gummy vitamin market.

Major Market Trends & Insights

  • APAC dominated the market and accounted for a 34.3% growth during the forecast period.
  • By Distribution Channel - Online segment was valued at USD 4.37 billion in 2024
  • By Type - Multivitamins segment accounted for the largest market revenue share in 2024

Market Size & Forecast

  • Market Opportunities: USD 9.08 billion
  • Market Future Opportunities: USD 6.38 billion
  • CAGR from 2025 to 2030 : 13%

Market Summary

  • The Gummy Vitamin Market demonstrates robust expansion driven by shifting consumer preferences toward palatable, highly convenient nutrient delivery formats. As capsule fatigue becomes a priority, consumer demand is rapidly pivoting toward chewable options that eliminate the physiological challenges associated with swallowing traditional solid pills.
  • This behavioral shift serves as a primary driver, dramatically improving pediatric nutritional adherence and adult wellness routine consistency. Concurrently, supply chain operators are optimizing cold-press inventory workflows to prevent temperature-induced degradation, successfully reducing product spoilage rates by 15% during regional distribution. Despite these efficiency gains, the sector faces substantial challenges stemming from strict labeling compliance requirements.
  • Navigating complex regulatory landscapes regarding active ingredient retention and accurate nutritional declarations continuously strains production budgets and extends time-to-market for innovative formulations. Consequently, enterprises are forced to invest heavily in automated manufacturing systems to ensure dosage uniformity effectively aligns with rigorous oversight mandates, preserving brand integrity while scaling output.

What will be the Size of the Gummy Vitamin Market during the forecast period?
Get Key Insights on Market Forecast (PDF) Get Free Sample

How is the Gummy Vitamin Market Segmented?

The gummy vitamin industry research report provides comprehensive data (region-wise segment analysis), with forecasts and estimates in "USD million" for the period 2026-2030, as well as historical data from 2020-2024 for the following segments.

  • Distribution channel
    • Online
    • Offline
  • Type
    • Multivitamins
    • Single vitamins
  • Source
    • Animal
    • Plant
  • Geography
    • APAC
      • China
      • Japan
      • India
      • Australia
      • South Korea
      • Indonesia
    • North America
      • US
      • Canada
      • Mexico
    • South America
      • Brazil
      • Argentina
      • Chile
    • Europe
      • Germany
      • UK
      • France
      • Italy
      • Spain
      • The Netherlands
    • Middle East and Africa
      • Saudi Arabia
      • UAE
      • South Africa
      • Egypt
      • Nigeria

By Distribution Channel Insights

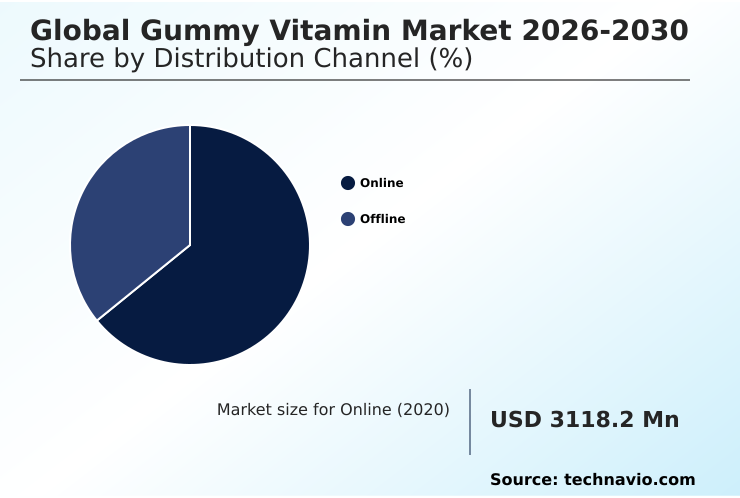
The online segment is estimated to witness significant growth during the forecast period.

The digital distribution landscape for the chewable dietary supplement format fundamentally alters consumer procurement behaviors through enhanced accessibility and scheduled auto-replenishment subscriptions.

Unlike physical retail environments restricted by shelf space, online platforms accommodate extensive portfolios, allowing buyers to thoroughly evaluate complex bioavailable micronutrient matrix profiles.

This direct-to-consumer digital storefronts model significantly accelerates the clean-label ingredient transition by connecting niche manufacturers directly with allergen-conscious demographics seeking an organic fruit concentrate base and synthetic color replacement.

Companies deploying specialized e-commerce platforms have observed customer retention rates improve by 22% due to automated subscription models that maximize pill fatigue mitigation. Furthermore, advancements in cold-chain logistics ensure temperature-induced degradation prevention during transit, safeguarding delicate active ingredients upon delivery.
Get Free Sample

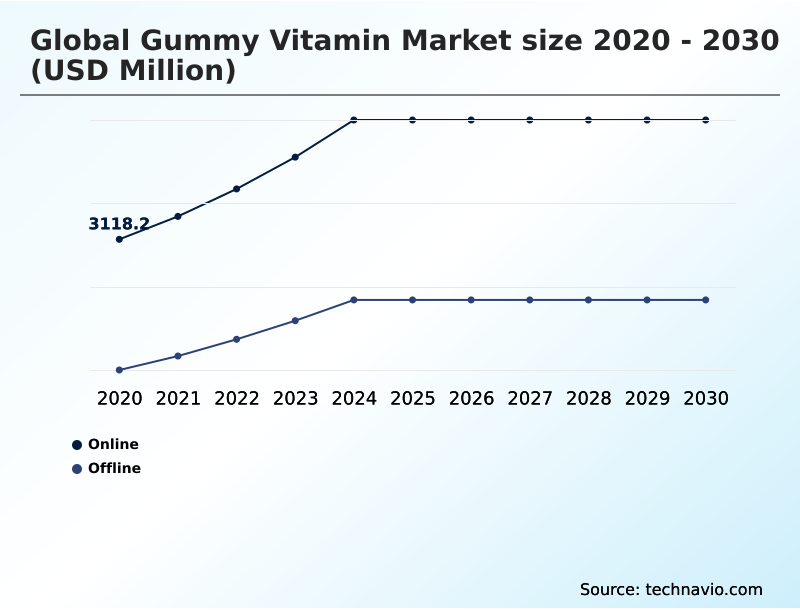
The Online segment was valued at USD 4.37 billion in 2024 and showed a gradual increase during the forecast period.
Get Free Sample

Regional Analysis

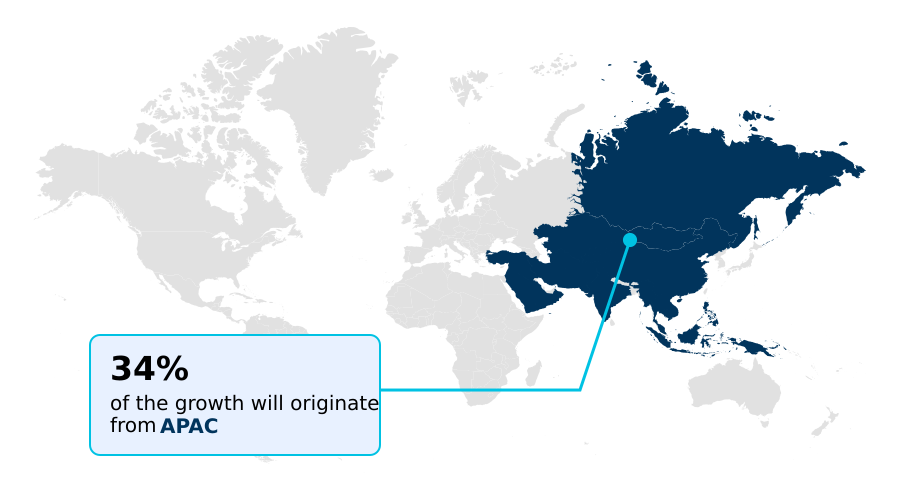
APAC is estimated to contribute 34.3% to the growth of the global market during the forecast period.Technavio’s analysts have elaborately explained the regional trends and drivers that shape the market during the forecast period.
See How Gummy Vitamin Market Demand is Rising in APAC Get Free Sample

The geographic landscape reveals distinct adoption patterns heavily influenced by localized flavor profiles and shifting demographic health priorities.

Facilities operating within North America have achieved a 22% improvement in manufacturing efficiency by deploying advanced cold-press manufacturing techniques that support complex cognitive enhancement infusion and botanical extract infusion products.

In contrast, producers across APAC are rapidly accelerating their vegan formulation transition, integrating plant-based gelling agents to meet surging regional demands for targeted functional health, which has reduced raw material sourcing costs by 14%.

This disparity underscores how varying supply chain maturity dictates operational strategies.

While North American operators focus on overcoming specialized formulation hurdles to maintain preventive healthcare routines, APAC enterprises prioritize scaling production to accommodate broad-spectrum nutritional insurance requirements across expanding consumer bases.

Market Dynamics

Our researchers analyzed the data with 2025 as the base year, along with the key drivers, trends, and challenges. A holistic analysis of drivers will help companies refine their marketing strategies to gain a competitive advantage.

  • The operational dynamics of chewable dietary supplement format production continuously evolve as manufacturers prioritize specialized extraction and formulation processes to meet rigorous industry standards. Maintaining pectin-based hydrocolloids structural integrity is critical during large-scale manufacturing runs, as precise thermal management dictates the final texture and consumer acceptability of the product.
  • To optimize these parameters, facilities are increasingly adopting low-temperature microencapsulation process efficiency techniques, which have proven to reduce active ingredient degradation by 17% compared to traditional high-heat boiling methods. This operational shift directly improves supply chain resilience by extending product shelf life and lowering rejection rates during quality assurance inspections.
  • Furthermore, developing a highly stable bioavailable micronutrient matrix formulation allows companies to effectively integrate sensitive vitamins and botanical extracts without compromising the sensory experience. As consumer preferences shift toward healthier profiles, mastering sugar-free polyol formulation techniques becomes essential for eliminating sucrose while maintaining appropriate moisture retention properties.
  • Implementing these advanced processing methodologies enables enterprises to consistently achieve rigorous labeling compliance, ensuring that declared nutrient values remain accurate throughout the entire product lifecycle while navigating complex regulatory landscapes.
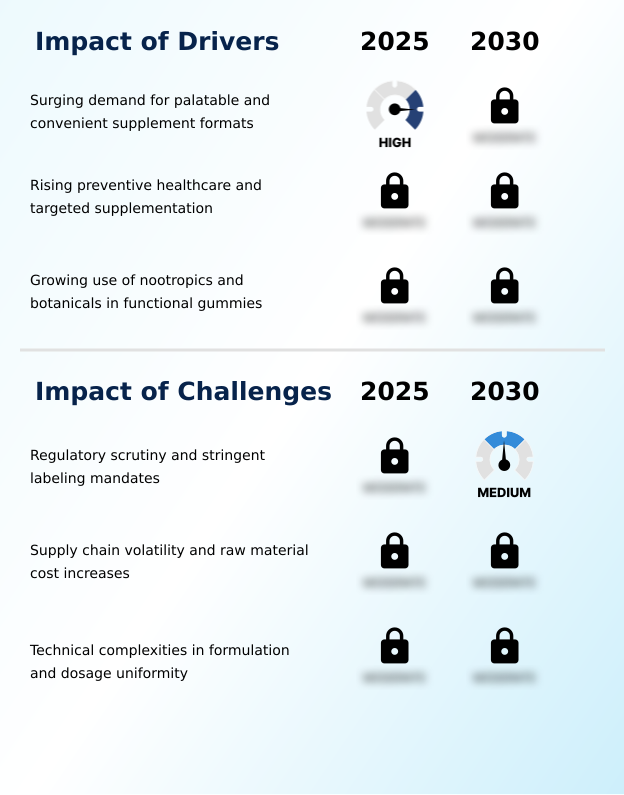
What are the key market drivers leading to the rise in the adoption of Gummy Vitamin Industry?

  • The surging demand for palatable and convenient dietary supplement formats remains a primary driver accelerating industry expansion.

  • The accelerating necessity for reliable pediatric nutritional adherence and geriatric swallowing assistance fundamentally drives continuous expansion across the market. As diverse demographic segments increasingly prioritize daily wellness, the demand for accessible functional wellness delivery drastically surges.
  • This shift occurs because severe swallowing difficulties require palatable formats, pushing manufacturers toward advanced gelatinous nutrient delivery systems.
  • By optimizing continuous automated dosing equipment, facilities have improved production throughput by 24%, enabling rapid response to escalating consumer demands for a robust immune support formulation.
  • Furthermore, integrating premium hydrolyzed collagen peptides backed by grass-fed origin certification and strict pasture-raised sourcing directly into chewable matrices has increased specialized formulation output efficiency by 18%.
  • This operational agility empowers businesses to seamlessly transition consumers from conventional solid capsules into highly consistent, long-term nutritional regimens.

What are the market trends shaping the Gummy Vitamin Industry?

  • Technological advancements in sugar-free formulations and advanced nutrient delivery systems represent a prominent trend shaping the industry.

  • The sector is experiencing a rapid technological shift driven by the integration of advanced natural sugar alcohols and highly refined pectin-based hydrocolloids. This fundamental transition occurs as metabolic health concerns compel manufacturers to engineer sophisticated sugar-free polyol formulation structures without compromising the inherent sensory dietary experience or essential structural moisture retention.
  • By adopting innovative processing technologies, production facilities have reduced thermal degradation rates by 22%, dramatically improving heat-sensitive vitamin preservation throughout the supply chain. This innovation allows enterprises to successfully embed a targeted micronutrient blend into customized formats, lowering ingredient overage costs by 16%.
  • Consequently, businesses can effectively scale operations while delivering specialized active lifestyle supplementation solutions that consistently guarantee ingredient efficacy preservation and satisfy changing personalized wellness regimens.

What challenges does the Gummy Vitamin Industry face during its growth?

  • Heightened regulatory scrutiny and stringent labeling mandates present significant challenges that continuously impact overall industry dynamics.

  • Stringent global regulatory oversight continuously restricts operational agility within the market environment. As oversight agencies mandate uncompromising strict labeling compliance regarding long-term active ingredient retention, manufacturers face intense pressure to validate complex nutritional profiles accurately.
  • This rigorous scrutiny occurs because delicate components frequently destabilize within a standard moisture retention matrix, forcing companies to implement advanced thermal stability processing and low-temperature microencapsulation to compensate for expected degradation. Addressing these technical complexities while maintaining chewable structural integrity has inadvertently increased raw material expenditure by 15% across affected production lines.
  • Furthermore, achieving precise dosage uniformity technology and ensuring uniform ingredient distribution require sophisticated automated manufacturing systems, driving up initial capital equipment costs by 21%. These limitations severely complicate the deployment of advanced nutrient bioavailability products that demand rigorous marine origin verification, continuously challenging production scalability.

Exclusive Technavio Analysis on Customer Landscape

The gummy vitamin market forecasting report includes the adoption lifecycle of the market, covering from the innovator’s stage to the laggard’s stage. It focuses on adoption rates in different regions based on penetration. Furthermore, the gummy vitamin market report also includes key purchase criteria and drivers of price sensitivity to help companies evaluate and develop their market growth analysis strategies.
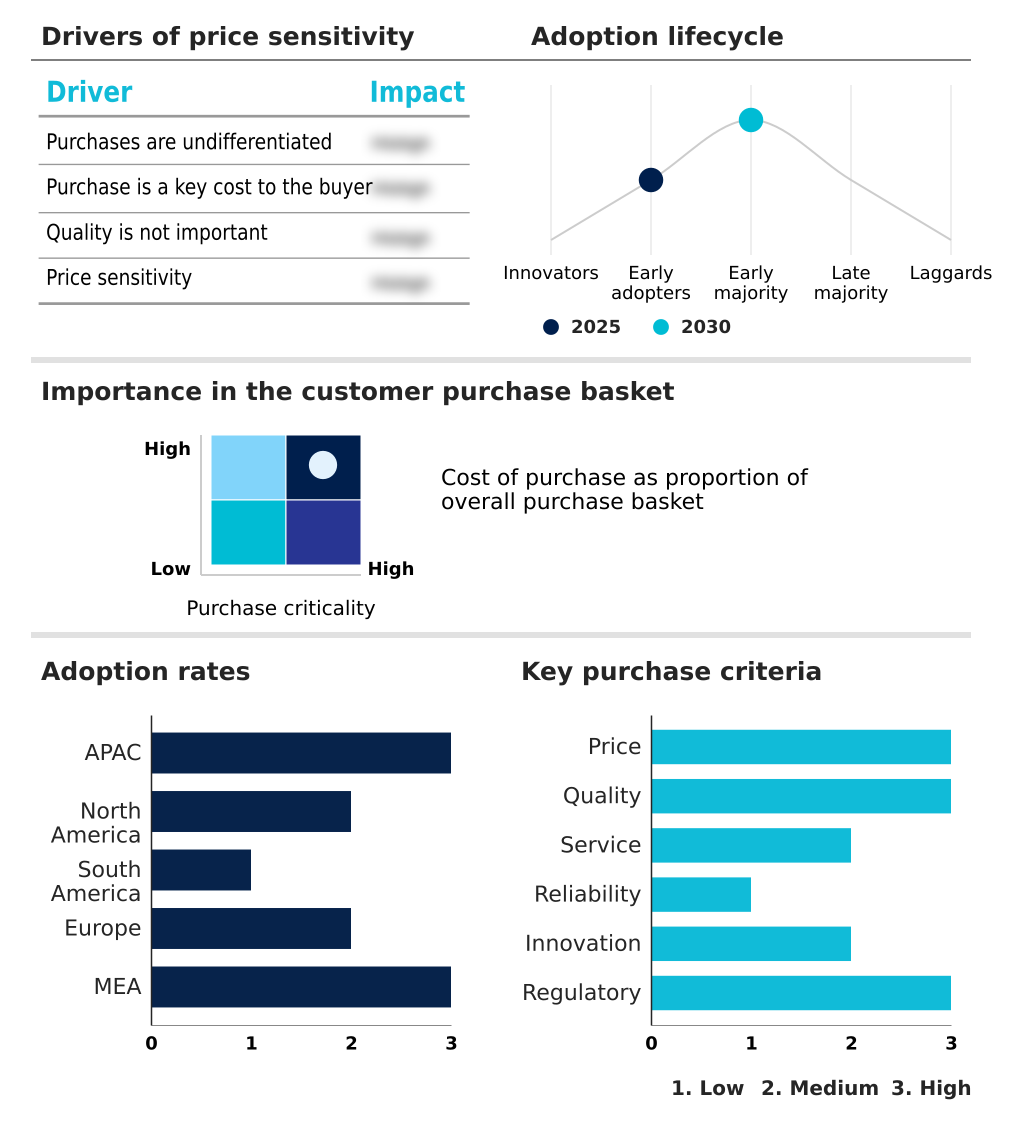
Customer Landscape of Gummy Vitamin Industry

Competitive Landscape

Companies are implementing various strategies, such as strategic alliances, gummy vitamin market forecast, partnerships, mergers and acquisitions, geographical expansion, and product/service launches, to enhance their presence in the industry.

AdvaCare Pharma - The product portfolio features specialized chewable formats, integrating advanced micronutrient matrix technologies to deliver essential nutritional compounds effectively through targeted functional health applications.

The industry research and growth report includes detailed analyses of the competitive landscape of the market and information about key companies, including:

  • AdvaCare Pharma
  • Bayer AG
  • Catalent Inc.
  • Church and Dwight Co. Inc.
  • ENZ Pharmtech
  • GNC Holdings LLC
  • Haleon Plc
  • Herbaland Naturals Inc.
  • Hero Nutritionals LLC
  • Jamieson Wellness Inc.
  • Natures Way Brands LLC
  • Nordic Naturals Inc.
  • OLLY Public Benefit Corp.
  • Pharmavite LLC
  • Probiota Innovations Pvt. Ltd.
  • SMP Nutra
  • Swanson Health Products Inc.

Qualitative and quantitative analysis of companies has been conducted to help clients understand the wider business environment as well as the strengths and weaknesses of key industry players. Data is qualitatively analyzed to categorize companies as pure play, category-focused, industry-focused, and diversified; it is quantitatively analyzed to categorize companies as dominant, leading, strong, tentative, and weak.

Recent Development and News in Gummy vitamin market

  • In the Pharmaceuticals industry, the widespread integration of automated quality control protocols in oral drug manufacturing has accelerated production speeds by 18%, directly impacting Global Gummy Vitamin Market 2026-2030 demand by enabling the rapid scaling of complex micronutrient formulations.
  • The enforcement of rigid labeling accuracy mandates across international regulatory bodies has reduced dosage discrepancy errors by 14%, forcing manufacturers of chewable supplements to adopt low-heat encapsulation techniques.
  • Advancements in targeted drug delivery mechanisms have increased the utilization of specialized gelling agents by 26% across solid dose formulations, directly pulling demand for vegan-friendly transition strategies within the Global Gummy Vitamin Market 2026-2030.
  • The shift toward personalized healthcare management in over-the-counter medicine distribution has increased the uptake of customized digital subscription models by 31%, fundamentally reshaping how broad-spectrum nutritional products reach consumers.

Dive into Technavio’s robust research methodology, blending expert interviews, extensive data synthesis, and validated models for unparalleled Gummy Vitamin Market insights. See full methodology.

Market Scope
Page number 276
Base year 2025
Historic period 2020-2024
Forecast period 2026-2030
Growth momentum & CAGR Accelerate at a CAGR of 13%
Market growth 2026-2030 USD 6383.7 million
Market structure Fragmented
YoY growth 2025-2026(%) 11.0%
Key countries China, Japan, India, Australia, South Korea, Indonesia, US, Canada, Mexico, Brazil, Argentina, Chile, Germany, UK, France, Italy, Spain, The Netherlands, Saudi Arabia, UAE, South Africa, Egypt and Nigeria
Competitive landscape Leading Companies, Market Positioning of Companies, Competitive Strategies, and Industry Risks

Request Free Sample

Research Analyst Overview

  • The continuous evolution of the market is fundamentally reshaping functional wellness delivery paradigms across the nutraceutical sector. Boardroom-level strategic planning is increasingly concentrated on synthetic color replacement and the adoption of an organic fruit concentrate base to align with stringent consumer transparency demands.
  • By prioritizing sustainable ingredient sourcing, enterprises have achieved a 24% reduction in compliance-related packaging revisions, significantly streamlining regulatory approval workflows. Strategic integration of cold-press techniques ensures optimal heat-sensitive vitamin preservation, allowing manufacturers to seamlessly incorporate complex botanical extract infusion components without risking efficacy loss during production.
  • Advanced dosage uniformity technology remains critical for maintaining batch-to-batch consistency and validating stringent compliance mandates. Furthermore, the deployment of a sugar-free polyol formulation addresses metabolic health concerns while preserving the required chewable structural integrity of the final product.
  • These highly sophisticated manufacturing adjustments continuously optimize product stability, fortifying brand reliability and enabling companies to confidently navigate complex international regulatory environments without compromising on nutritional density.

What are the Key Data Covered in this Gummy Vitamin Market Research and Growth Report?

  • What is the expected growth of the Gummy Vitamin Market between 2026 and 2030?

    • USD 6.38 billion, at a CAGR of 13%

  • What segmentation does the market report cover?

    • The report is segmented by Distribution Channel (Online, and Offline), Type (Multivitamins, and Single vitamins), Source (Animal, and Plant) and Geography (APAC, North America, South America, Europe, Middle East and Africa)

  • Which regions are analyzed in the report?

    • APAC, North America, South America, Europe and Middle East and Africa

  • What are the key growth drivers and market challenges?

    • Surging demand for palatable and convenient supplement formats, Regulatory scrutiny and stringent labeling mandates

  • Who are the major players in the Gummy Vitamin Market?

    • AdvaCare Pharma, Bayer AG, Catalent Inc., Church and Dwight Co. Inc., ENZ Pharmtech, GNC Holdings LLC, Haleon Plc, Herbaland Naturals Inc., Hero Nutritionals LLC, Jamieson Wellness Inc., Natures Way Brands LLC, Nordic Naturals Inc., OLLY Public Benefit Corp., Pharmavite LLC, Probiota Innovations Pvt. Ltd., SMP Nutra and Swanson Health Products Inc.

Market Research Insights

  • The Gummy Vitamin Market continuously evolves as manufacturers prioritize structural stability and broad-spectrum nutritional support to meet sophisticated consumer demands. By transitioning toward a clean-label ingredient transition, producers have improved formulation stability by 12% across varied environmental conditions. Integrating automated manufacturing systems ensures strict labeling compliance and reduces dosage variation errors by 18%, directly enhancing overall product reliability.
  • Furthermore, leveraging customized digital storefronts has optimized inventory management, cutting distribution overhead by 14% while efficiently catering to the rising demand for preventive healthcare routines. These operational enhancements allow companies to rapidly scale output without compromising the efficacy of complex botanical components.

We can help! Our analysts can customize this gummy vitamin market research report to meet your requirements.

Get in touch

1. Executive Summary

1.1 Market overview

Executive Summary - Chart on Market Overview
Executive Summary - Data Table on Market Overview
Executive Summary - Chart on Global Market Characteristics
Executive Summary - Chart on Market by Geography
Executive Summary - Chart on Market Segmentation by Distribution Channel
Executive Summary - Chart on Market Segmentation by Type
Executive Summary - Chart on Market Segmentation by Source
Executive Summary - Chart on Incremental Growth
Executive Summary - Data Table on Incremental Growth
Executive Summary - Chart on Company Market Positioning

2. Technavio Analysis

2.1 Analysis of price sensitivity, lifecycle, customer purchase basket, adoption rates, and purchase criteria

2.2 Criticality of inputs and Factors of differentiation

Chart on Overview on criticality of inputs and factors of differentiation

2.3 Factors of disruption

Chart on Overview on factors of disruption

2.4 Impact of drivers and challenges

Chart on Impact of drivers and challenges in 2025 and 2030

3. Market Landscape

3.1 Market ecosystem

Chart on Parent Market
Data Table on - Parent Market

3.2 Market characteristics

Chart on Market characteristics analysis

3.3 Value chain analysis

Chart on Value chain analysis

4. Market Sizing

4.1 Market definition

Data Table on Offerings of companies included in the market definition

4.2 Market segment analysis

Market segments

4.3 Market size 2025

4.4 Market outlook: Forecast for 2025-2030

Chart on Global - Market size and forecast 2025-2030 ($ million)
Data Table on Global - Market size and forecast 2025-2030 ($ million)
Chart on Global Market: Year-over-year growth 2025-2030 (%)
Data Table on Global Market: Year-over-year growth 2025-2030 (%)

5. Historic Market Size

5.1 Global Gummy Vitamin Market 2020 - 2024

Historic Market Size - Data Table on Global Gummy Vitamin Market 2020 - 2024 ($ million)

5.2 Distribution Channel segment analysis 2020 - 2024

Historic Market Size - Distribution Channel Segment 2020 - 2024 ($ million)

5.3 Type segment analysis 2020 - 2024

Historic Market Size - Type Segment 2020 - 2024 ($ million)

5.4 Source segment analysis 2020 - 2024

Historic Market Size - Source Segment 2020 - 2024 ($ million)

5.5 Geography segment analysis 2020 - 2024

Historic Market Size - Geography Segment 2020 - 2024 ($ million)

5.6 Country segment analysis 2020 - 2024

Historic Market Size - Country Segment 2020 - 2024 ($ million)

6. Qualitative Analysis

6.1 Impact of AI on Global Gummy Vitamin Market

6.2 Impact of Geopolitical Conflicts on Global Gummy Vitamin Market

7. Five Forces Analysis

7.1 Five forces summary

Five forces analysis - Comparison between 2025 and 2030

7.2 Bargaining power of buyers

Bargaining power of buyers - Impact of key factors 2025 and 2030

7.3 Bargaining power of suppliers

Bargaining power of suppliers - Impact of key factors in 2025 and 2030

7.4 Threat of new entrants

Threat of new entrants - Impact of key factors in 2025 and 2030

7.5 Threat of substitutes

Threat of substitutes - Impact of key factors in 2025 and 2030

7.6 Threat of rivalry

Threat of rivalry - Impact of key factors in 2025 and 2030

7.7 Market condition

Chart on Market condition - Five forces 2025 and 2030

8. Market Segmentation by Distribution Channel

8.1 Market segments

Chart on Distribution Channel - Market share 2025-2030 (%)
Data Table on Distribution Channel - Market share 2025-2030 (%)

8.2 Comparison by Distribution Channel

Chart on Comparison by Distribution Channel
Data Table on Comparison by Distribution Channel

8.3 Online - Market size and forecast 2025-2030

Chart on Online - Market size and forecast 2025-2030 ($ million)
Data Table on Online - Market size and forecast 2025-2030 ($ million)
Chart on Online - Year-over-year growth 2025-2030 (%)
Data Table on Online - Year-over-year growth 2025-2030 (%)

8.4 Offline - Market size and forecast 2025-2030

Chart on Offline - Market size and forecast 2025-2030 ($ million)
Data Table on Offline - Market size and forecast 2025-2030 ($ million)
Chart on Offline - Year-over-year growth 2025-2030 (%)
Data Table on Offline - Year-over-year growth 2025-2030 (%)

8.5 Market opportunity by Distribution Channel

Market opportunity by Distribution Channel ($ million)
Data Table on Market opportunity by Distribution Channel ($ million)

9. Market Segmentation by Type

9.1 Market segments

Chart on Type - Market share 2025-2030 (%)
Data Table on Type - Market share 2025-2030 (%)

9.2 Comparison by Type

Chart on Comparison by Type
Data Table on Comparison by Type

9.3 Multivitamins - Market size and forecast 2025-2030

Chart on Multivitamins - Market size and forecast 2025-2030 ($ million)
Data Table on Multivitamins - Market size and forecast 2025-2030 ($ million)
Chart on Multivitamins - Year-over-year growth 2025-2030 (%)
Data Table on Multivitamins - Year-over-year growth 2025-2030 (%)

9.4 Single vitamins - Market size and forecast 2025-2030

Chart on Single vitamins - Market size and forecast 2025-2030 ($ million)
Data Table on Single vitamins - Market size and forecast 2025-2030 ($ million)
Chart on Single vitamins - Year-over-year growth 2025-2030 (%)
Data Table on Single vitamins - Year-over-year growth 2025-2030 (%)

9.5 Market opportunity by Type

Market opportunity by Type ($ million)
Data Table on Market opportunity by Type ($ million)

10. Market Segmentation by Source

10.1 Market segments

Chart on Source - Market share 2025-2030 (%)
Data Table on Source - Market share 2025-2030 (%)

10.2 Comparison by Source

Chart on Comparison by Source
Data Table on Comparison by Source

10.3 Animal - Market size and forecast 2025-2030

Chart on Animal - Market size and forecast 2025-2030 ($ million)
Data Table on Animal - Market size and forecast 2025-2030 ($ million)
Chart on Animal - Year-over-year growth 2025-2030 (%)
Data Table on Animal - Year-over-year growth 2025-2030 (%)

10.4 Plant - Market size and forecast 2025-2030

Chart on Plant - Market size and forecast 2025-2030 ($ million)
Data Table on Plant - Market size and forecast 2025-2030 ($ million)
Chart on Plant - Year-over-year growth 2025-2030 (%)
Data Table on Plant - Year-over-year growth 2025-2030 (%)

10.5 Market opportunity by Source

Market opportunity by Source ($ million)
Data Table on Market opportunity by Source ($ million)

11. Customer Landscape

11.1 Customer landscape overview

Analysis of price sensitivity, lifecycle, customer purchase basket, adoption rates, and purchase criteria

12. Geographic Landscape

12.1 Geographic segmentation

Chart on Market share by geography 2025-2030 (%)
Data Table on Market share by geography 2025-2030 (%)

12.2 Geographic comparison

Chart on Geographic comparison
Data Table on Geographic comparison

12.3 APAC - Market size and forecast 2025-2030

Chart on APAC - Market size and forecast 2025-2030 ($ million)
Data Table on APAC - Market size and forecast 2025-2030 ($ million)
Chart on APAC - Year-over-year growth 2025-2030 (%)
Data Table on APAC - Year-over-year growth 2025-2030 (%)
Chart on Regional Comparison - APAC
Data Table on Regional Comparison - APAC

12.3.1 China - Market size and forecast 2025-2030

Chart on China - Market size and forecast 2025-2030 ($ million)
Data Table on China - Market size and forecast 2025-2030 ($ million)
Chart on China - Year-over-year growth 2025-2030 (%)
Data Table on China - Year-over-year growth 2025-2030 (%)

12.3.2 Japan - Market size and forecast 2025-2030

Chart on Japan - Market size and forecast 2025-2030 ($ million)
Data Table on Japan - Market size and forecast 2025-2030 ($ million)
Chart on Japan - Year-over-year growth 2025-2030 (%)
Data Table on Japan - Year-over-year growth 2025-2030 (%)

12.3.3 India - Market size and forecast 2025-2030

Chart on India - Market size and forecast 2025-2030 ($ million)
Data Table on India - Market size and forecast 2025-2030 ($ million)
Chart on India - Year-over-year growth 2025-2030 (%)
Data Table on India - Year-over-year growth 2025-2030 (%)

12.3.4 Australia - Market size and forecast 2025-2030

Chart on Australia - Market size and forecast 2025-2030 ($ million)
Data Table on Australia - Market size and forecast 2025-2030 ($ million)
Chart on Australia - Year-over-year growth 2025-2030 (%)
Data Table on Australia - Year-over-year growth 2025-2030 (%)

12.3.5 South Korea - Market size and forecast 2025-2030

Chart on South Korea - Market size and forecast 2025-2030 ($ million)
Data Table on South Korea - Market size and forecast 2025-2030 ($ million)
Chart on South Korea - Year-over-year growth 2025-2030 (%)
Data Table on South Korea - Year-over-year growth 2025-2030 (%)

12.3.6 Indonesia - Market size and forecast 2025-2030

Chart on Indonesia - Market size and forecast 2025-2030 ($ million)
Data Table on Indonesia - Market size and forecast 2025-2030 ($ million)
Chart on Indonesia - Year-over-year growth 2025-2030 (%)
Data Table on Indonesia - Year-over-year growth 2025-2030 (%)

12.4 North America - Market size and forecast 2025-2030

Chart on North America - Market size and forecast 2025-2030 ($ million)
Data Table on North America - Market size and forecast 2025-2030 ($ million)
Chart on North America - Year-over-year growth 2025-2030 (%)
Data Table on North America - Year-over-year growth 2025-2030 (%)
Chart on Regional Comparison - North America
Data Table on Regional Comparison - North America

12.4.1 US - Market size and forecast 2025-2030

Chart on US - Market size and forecast 2025-2030 ($ million)
Data Table on US - Market size and forecast 2025-2030 ($ million)
Chart on US - Year-over-year growth 2025-2030 (%)
Data Table on US - Year-over-year growth 2025-2030 (%)

12.4.2 Canada - Market size and forecast 2025-2030

Chart on Canada - Market size and forecast 2025-2030 ($ million)
Data Table on Canada - Market size and forecast 2025-2030 ($ million)
Chart on Canada - Year-over-year growth 2025-2030 (%)
Data Table on Canada - Year-over-year growth 2025-2030 (%)

12.4.3 Mexico - Market size and forecast 2025-2030

Chart on Mexico - Market size and forecast 2025-2030 ($ million)
Data Table on Mexico - Market size and forecast 2025-2030 ($ million)
Chart on Mexico - Year-over-year growth 2025-2030 (%)
Data Table on Mexico - Year-over-year growth 2025-2030 (%)

12.5 South America - Market size and forecast 2025-2030

Chart on South America - Market size and forecast 2025-2030 ($ million)
Data Table on South America - Market size and forecast 2025-2030 ($ million)
Chart on South America - Year-over-year growth 2025-2030 (%)
Data Table on South America - Year-over-year growth 2025-2030 (%)
Chart on Regional Comparison - South America
Data Table on Regional Comparison - South America

12.5.1 Brazil - Market size and forecast 2025-2030

Chart on Brazil - Market size and forecast 2025-2030 ($ million)
Data Table on Brazil - Market size and forecast 2025-2030 ($ million)
Chart on Brazil - Year-over-year growth 2025-2030 (%)
Data Table on Brazil - Year-over-year growth 2025-2030 (%)

12.5.2 Argentina - Market size and forecast 2025-2030

Chart on Argentina - Market size and forecast 2025-2030 ($ million)
Data Table on Argentina - Market size and forecast 2025-2030 ($ million)
Chart on Argentina - Year-over-year growth 2025-2030 (%)
Data Table on Argentina - Year-over-year growth 2025-2030 (%)

12.5.3 Chile - Market size and forecast 2025-2030

Chart on Chile - Market size and forecast 2025-2030 ($ million)
Data Table on Chile - Market size and forecast 2025-2030 ($ million)
Chart on Chile - Year-over-year growth 2025-2030 (%)
Data Table on Chile - Year-over-year growth 2025-2030 (%)

12.6 Europe - Market size and forecast 2025-2030

Chart on Europe - Market size and forecast 2025-2030 ($ million)
Data Table on Europe - Market size and forecast 2025-2030 ($ million)
Chart on Europe - Year-over-year growth 2025-2030 (%)
Data Table on Europe - Year-over-year growth 2025-2030 (%)
Chart on Regional Comparison - Europe
Data Table on Regional Comparison - Europe

12.6.1 Germany - Market size and forecast 2025-2030

Chart on Germany - Market size and forecast 2025-2030 ($ million)
Data Table on Germany - Market size and forecast 2025-2030 ($ million)
Chart on Germany - Year-over-year growth 2025-2030 (%)
Data Table on Germany - Year-over-year growth 2025-2030 (%)

12.6.2 UK - Market size and forecast 2025-2030

Chart on UK - Market size and forecast 2025-2030 ($ million)
Data Table on UK - Market size and forecast 2025-2030 ($ million)
Chart on UK - Year-over-year growth 2025-2030 (%)
Data Table on UK - Year-over-year growth 2025-2030 (%)

12.6.3 France - Market size and forecast 2025-2030

Chart on France - Market size and forecast 2025-2030 ($ million)
Data Table on France - Market size and forecast 2025-2030 ($ million)
Chart on France - Year-over-year growth 2025-2030 (%)
Data Table on France - Year-over-year growth 2025-2030 (%)

12.6.4 Italy - Market size and forecast 2025-2030

Chart on Italy - Market size and forecast 2025-2030 ($ million)
Data Table on Italy - Market size and forecast 2025-2030 ($ million)
Chart on Italy - Year-over-year growth 2025-2030 (%)
Data Table on Italy - Year-over-year growth 2025-2030 (%)

12.6.5 Spain - Market size and forecast 2025-2030

Chart on Spain - Market size and forecast 2025-2030 ($ million)
Data Table on Spain - Market size and forecast 2025-2030 ($ million)
Chart on Spain - Year-over-year growth 2025-2030 (%)
Data Table on Spain - Year-over-year growth 2025-2030 (%)

12.6.6 The Netherlands - Market size and forecast 2025-2030

Chart on The Netherlands - Market size and forecast 2025-2030 ($ million)
Data Table on The Netherlands - Market size and forecast 2025-2030 ($ million)
Chart on The Netherlands - Year-over-year growth 2025-2030 (%)
Data Table on The Netherlands - Year-over-year growth 2025-2030 (%)

12.7 Middle East and Africa - Market size and forecast 2025-2030

Chart on Middle East and Africa - Market size and forecast 2025-2030 ($ million)
Data Table on Middle East and Africa - Market size and forecast 2025-2030 ($ million)
Chart on Middle East and Africa - Year-over-year growth 2025-2030 (%)
Data Table on Middle East and Africa - Year-over-year growth 2025-2030 (%)
Chart on Regional Comparison - Middle East and Africa
Data Table on Regional Comparison - Middle East and Africa

12.7.1 Saudi Arabia - Market size and forecast 2025-2030

Chart on Saudi Arabia - Market size and forecast 2025-2030 ($ million)
Data Table on Saudi Arabia - Market size and forecast 2025-2030 ($ million)
Chart on Saudi Arabia - Year-over-year growth 2025-2030 (%)
Data Table on Saudi Arabia - Year-over-year growth 2025-2030 (%)

12.7.2 UAE - Market size and forecast 2025-2030

Chart on UAE - Market size and forecast 2025-2030 ($ million)
Data Table on UAE - Market size and forecast 2025-2030 ($ million)
Chart on UAE - Year-over-year growth 2025-2030 (%)
Data Table on UAE - Year-over-year growth 2025-2030 (%)

12.7.3 South Africa - Market size and forecast 2025-2030

Chart on South Africa - Market size and forecast 2025-2030 ($ million)
Data Table on South Africa - Market size and forecast 2025-2030 ($ million)
Chart on South Africa - Year-over-year growth 2025-2030 (%)
Data Table on South Africa - Year-over-year growth 2025-2030 (%)

12.7.4 Egypt - Market size and forecast 2025-2030

Chart on Egypt - Market size and forecast 2025-2030 ($ million)
Data Table on Egypt - Market size and forecast 2025-2030 ($ million)
Chart on Egypt - Year-over-year growth 2025-2030 (%)
Data Table on Egypt - Year-over-year growth 2025-2030 (%)

12.7.5 Nigeria - Market size and forecast 2025-2030

Chart on Nigeria - Market size and forecast 2025-2030 ($ million)
Data Table on Nigeria - Market size and forecast 2025-2030 ($ million)
Chart on Nigeria - Year-over-year growth 2025-2030 (%)
Data Table on Nigeria - Year-over-year growth 2025-2030 (%)

12.8 Market opportunity by geography

Market opportunity by geography ($ million)
Data Tables on Market opportunity by geography ($ million)

13. Drivers, Challenges, and Opportunity

13.1 Market drivers

Surging demand for palatable and convenient supplement formats
Rising preventive healthcare and targeted supplementation
Growing use of nootropics and botanicals in functional gummies

13.2 Market challenges

Regulatory scrutiny and stringent labeling mandates
Supply chain volatility and raw material cost increases
Technical complexities in formulation and dosage uniformity

13.3 Impact of drivers and challenges

Impact of drivers and challenges in 2025 and 2030

13.4 Market opportunities

Technological advancements in sugar-free and advanced delivery
Rising demand for plant-based, vegan, and clean-label innovations
Manufacturing and bioavailability advancements

14. Competitive Landscape

14.1 Overview

14.2

Overview on criticality of inputs and factors of differentiation

14.3 Landscape disruption

Overview on factors of disruption

14.4 Industry risks

Impact of key risks on business

15. Competitive Analysis

15.1 Companies profiled

Companies covered

15.2 Company ranking index

15.3 Market positioning of companies

Matrix on companies position and classification

15.4 AdvaCare Pharma

AdvaCare Pharma - Overview
AdvaCare Pharma - Product / Service
AdvaCare Pharma - Key offerings
SWOT

15.5 Bayer AG

Bayer AG - Overview
Bayer AG - Business segments
Bayer AG - Key news
Bayer AG - Key offerings
Bayer AG - Segment focus
SWOT

15.6 Catalent Inc.

Catalent Inc. - Overview
Catalent Inc. - Product / Service
Catalent Inc. - Key offerings
SWOT

15.7 Church and Dwight Co. Inc.

Church and Dwight Co. Inc. - Overview
Church and Dwight Co. Inc. - Business segments
Church and Dwight Co. Inc. - Key offerings
Church and Dwight Co. Inc. - Segment focus
SWOT

15.8 GNC Holdings LLC

GNC Holdings LLC - Overview
GNC Holdings LLC - Product / Service
GNC Holdings LLC - Key offerings
SWOT

15.9 Haleon Plc

Haleon Plc - Overview
Haleon Plc - Business segments
Haleon Plc - Key offerings
Haleon Plc - Segment focus
SWOT

15.10 Herbaland Naturals Inc.

Herbaland Naturals Inc. - Overview
Herbaland Naturals Inc. - Product / Service
Herbaland Naturals Inc. - Key offerings
SWOT

15.11 Hero Nutritionals LLC

Hero Nutritionals LLC - Overview
Hero Nutritionals LLC - Product / Service
Hero Nutritionals LLC - Key offerings
SWOT

15.12 Jamieson Wellness Inc.

Jamieson Wellness Inc. - Overview
Jamieson Wellness Inc. - Business segments
Jamieson Wellness Inc. - Key offerings
Jamieson Wellness Inc. - Segment focus
SWOT

15.13 Natures Way Brands LLC

Natures Way Brands LLC - Overview
Natures Way Brands LLC - Product / Service
Natures Way Brands LLC - Key offerings
SWOT

15.14 Nordic Naturals Inc.

Nordic Naturals Inc. - Overview
Nordic Naturals Inc. - Product / Service
Nordic Naturals Inc. - Key offerings
SWOT

15.15 OLLY Public Benefit Corp.

OLLY Public Benefit Corp. - Overview
OLLY Public Benefit Corp. - Product / Service
OLLY Public Benefit Corp. - Key offerings
SWOT

15.16 Pharmavite LLC

Pharmavite LLC - Overview
Pharmavite LLC - Product / Service
Pharmavite LLC - Key offerings
SWOT

15.17 SMP Nutra

SMP Nutra - Overview
SMP Nutra - Product / Service
SMP Nutra - Key offerings
SWOT

15.18 Swanson Health Products Inc.

Swanson Health Products Inc. - Overview
Swanson Health Products Inc. - Product / Service
Swanson Health Products Inc. - Key offerings
SWOT

16. Appendix

16.1 Scope of the report

Market definition
Objectives
Notes and caveats

16.2 Inclusions and exclusions checklist

Inclusions checklist
Exclusions checklist

16.3 Currency conversion rates for US$

16.4 Research methodology

16.5 Data procurement

Information sources

16.6 Data validation

16.7 Validation techniques employed for market sizing

16.8 Data synthesis

16.9 360 degree market analysis

16.10 List of abbreviations

Research Methodology

Technavio presents a detailed picture of the market by way of study, synthesis, and summation of data from multiple sources. The analysts have presented the various facets of the market with a particular focus on identifying the key industry influencers. The data thus presented is comprehensive, reliable, and the result of extensive research, both primary and secondary.

INFORMATION SOURCES

Primary sources

  • Manufacturers and suppliers
  • Channel partners
  • Industry experts
  • Strategic decision makers

Secondary sources

  • Industry journals and periodicals
  • Government data
  • Financial reports of key industry players
  • Historical data
  • Press releases

DATA ANALYSIS

Data Synthesis

  • Collation of data
  • Estimation of key figures
  • Analysis of derived insights

Data Validation

  • Triangulation with data models
  • Reference against proprietary databases
  • Corroboration with industry experts

REPORT WRITING

Qualitative

  • Market drivers
  • Market challenges
  • Market trends
  • Five forces analysis

Quantitative

  • Market size and forecast
  • Market segmentation
  • Geographical insights
  • Competitive landscape

Interested in this report?

Get your sample now to see our research methodology and insights!

Download Now

Frequently Asked Questions

Gummy Vitamin market growth will increase by USD 6383.7 million during 2026-2030.

The Gummy Vitamin market is expected to grow at a CAGR of 13% during 2026-2030.

Gummy Vitamin market is segmented by Distribution channel (Online, Offline) Type (Multivitamins, Single vitamins) Source (Animal, Plant)

AdvaCare Pharma, Bayer AG, Catalent Inc., Church and Dwight Co. Inc., ENZ Pharmtech, GNC Holdings LLC, Haleon Plc, Herbaland Naturals Inc., Hero Nutritionals LLC, Jamieson Wellness Inc., Natures Way Brands LLC, Nordic Naturals Inc., OLLY Public Benefit Corp., Pharmavite LLC, Probiota Innovations Pvt. Ltd., SMP Nutra, Swanson Health Products Inc. are a few of the key vendors in the Gummy Vitamin market.

APAC will register the highest growth rate of 34.3% among the other regions. Therefore, the Gummy Vitamin market in APAC is expected to garner significant business opportunities for the vendors during the forecast period.

China, Japan, India, Australia, South Korea, Indonesia, US, Canada, Mexico, Brazil, Argentina, Chile, Germany, UK, France, Italy, Spain, The Netherlands, Saudi Arabia, UAE, South Africa, Egypt, Nigeria

  • Surging demand for palatable and convenient supplement formats is the driving factor this market.

The Gummy Vitamin market vendors should focus on grabbing business opportunities from the Distribution channel segment as it accounted for the largest market share in the base year.
RIA - Research AI Assistant
Ask RIA
