Grid-interactive Building Solutions Market Analysis, Size, and Forecast 2026-2030: North America (US, Canada, and Mexico), Europe (Germany, UK, and France), APAC (China, Japan, and South Korea), Middle East and Africa (Saudi Arabia, UAE, and South Africa), South America (Brazil, Argentina, and Colombia), and Rest of World (ROW)

Grid-interactive Building Solutions Market Analysis, Size, and Forecast 2026-2030:
North America (US, Canada, and Mexico), Europe (Germany, UK, and France), APAC (China, Japan, and South Korea), Middle East and Africa (Saudi Arabia, UAE, and South Africa), South America (Brazil, Argentina, and Colombia), and Rest of World (ROW)

Published: May 2026 307 Pages SKU: IRTNTR81449

Market Overview at a Glance

$27.09 B
Market Opportunity
19.8%
CAGR 2025 - 2030
39.3%
North America Growth
$8.34 B
Hardware segment 2024

Grid-interactive Building Solutions Market Size 2026-2030

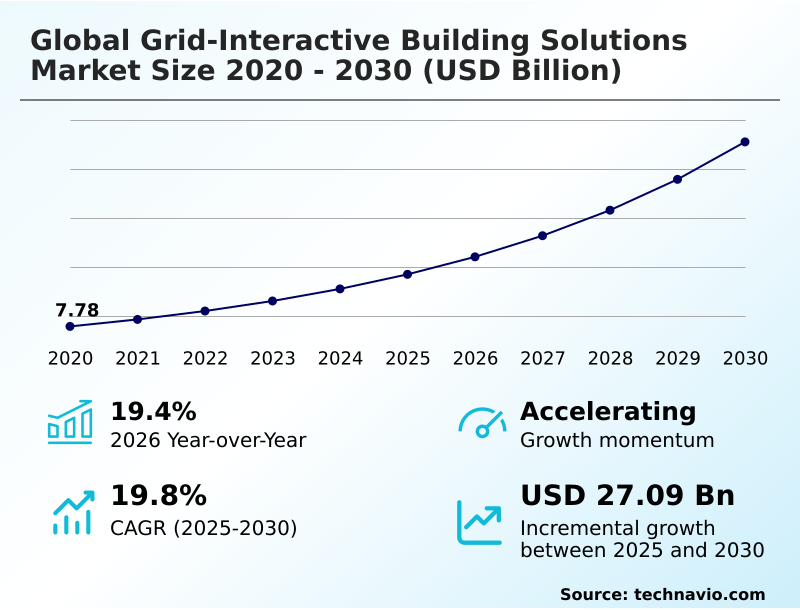
The grid-interactive building solutions market size is valued to increase by USD 27.09 billion, at a CAGR of 19.8% from 2025 to 2030. Global mandates for decarbonization and energy efficiency standards will drive the grid-interactive building solutions market.

Major Market Trends & Insights

  • North America dominated the market and accounted for a 39.3% growth during the forecast period.
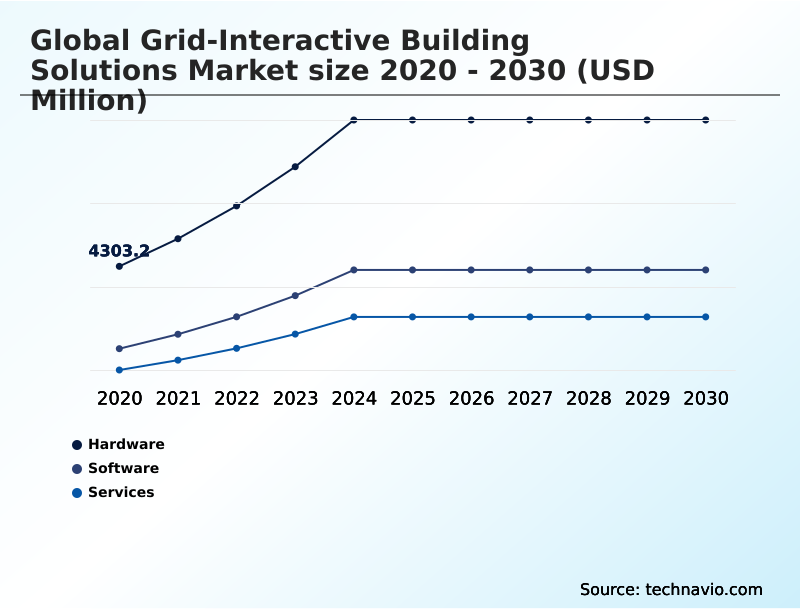
  • By Component - Hardware segment was valued at USD 8.34 billion in 2024
  • By Type - Commercial buildings segment accounted for the largest market revenue share in 2024

Market Size & Forecast

  • Market Opportunities: USD 37.73 billion
  • Market Future Opportunities: USD 27.09 billion
  • CAGR from 2025 to 2030 : 19.8%

Market Summary

  • The grid-interactive building solutions market is defined by a suite of technologies transforming structures into active participants in the electrical power system. These solutions use advanced sensors and machine learning to align building energy demand with grid conditions. Through predictive analytics and automated controls, buildings can perform demand-side management, including load shifting and modulation, based on price signals.
  • Key applications involve HVAC optimization, intelligent lighting, and orchestrating distributed energy resources like solar and battery storage. The innovation lies in bidirectional communication, turning buildings into flexible assets that offer grid services like frequency regulation and peak demand reduction.
  • In one business scenario, a commercial real estate portfolio utilizes an AI-driven building energy management system to analyze occupancy patterns and weather forecasts. The system autonomously adjusts HVAC and lighting across multiple sites, executing real-time load-shifting to avoid peak tariffs and participate in automated demand response programs.
  • This not only lowers operational costs but also generates revenue by selling flexible capacity back to the grid, improving the portfolio's overall financial performance and contributing to grid resilience.

What will be the Size of the Grid-interactive Building Solutions Market during the forecast period?

Get Key Insights on Market Forecast (PDF) Request Free Sample

How is the Grid-interactive Building Solutions Market Segmented?

The grid-interactive building solutions industry research report provides comprehensive data (region-wise segment analysis), with forecasts and estimates in "USD million" for the period 2026-2030, as well as historical data from 2020-2024 for the following segments.

  • Component
    • Hardware
    • Software
    • Services
  • Type
    • Commercial buildings
    • Residential buildings
    • Industrial buildings
  • Application
    • Energy efficiency and optimization
    • Demand flexibility
    • Demand response and peak shaving
    • Others
  • Geography
    • North America
      • US
      • Canada
      • Mexico
    • Europe
      • Germany
      • UK
      • France
    • APAC
      • China
      • Japan
      • South Korea
    • Middle East and Africa
      • Saudi Arabia
      • UAE
      • South Africa
    • South America
      • Brazil
      • Argentina
      • Colombia
    • Rest of World (ROW)

By Component Insights

The hardware segment is estimated to witness significant growth during the forecast period.

The hardware segment serves as the physical foundation of the global grid-interactive building solutions market 2026-2030, encompassing the essential physical assets required to monitor, control, and store energy within the built environment.

This category primarily includes grid-edge infrastructure for demand-side management, advanced metering infrastructure, smart thermostats, and the integration of distributed energy resources. These components facilitate building-to-grid interaction, enabling strategic load shedding to maintain grid stability.

The adoption of software-defined architectures and agentic artificial intelligence is driving the evolution from simple components to systems capable of autonomous energy management.

This allows for the creation of digital twin simulation models within decentralized energy networks, where facility managers have reported a 39.3% improvement in load balancing accuracy by leveraging these advanced hardware-software integrations.

Request Free Sample

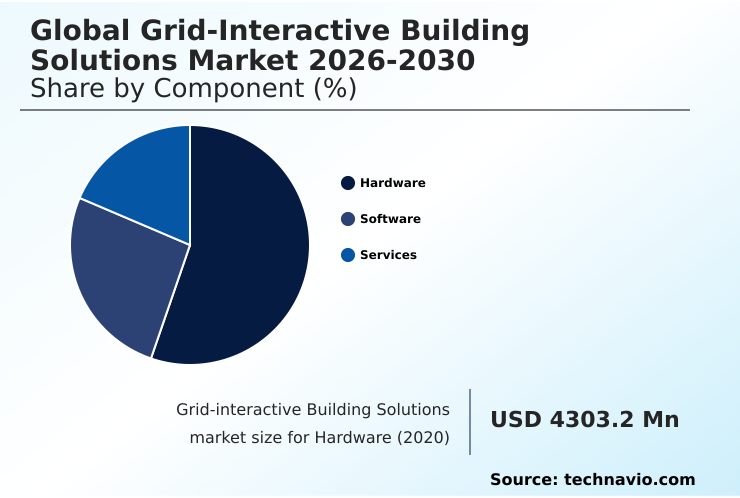
The Hardware segment was valued at USD 8.34 billion in 2024 and showed a gradual increase during the forecast period.

Request Free Sample

Regional Analysis

North America is estimated to contribute 39.3% to the growth of the global market during the forecast period.Technavio’s analysts have elaborately explained the regional trends and drivers that shape the market during the forecast period.

See How Grid-interactive Building Solutions Market Demand is Rising in North America Request Free Sample

North America leads the global grid-interactive building solutions market 2026-2030, accounting for 39.3% of the incremental growth, driven by state-level mandates and federal investment in grid modernization.

The region is seeing large-scale deployment of connected communities that leverage building automation systems for proactive load management. The emphasis on grid resilience and microgrid capabilities is accelerating adoption.

Europe follows, with a strong focus on decarbonization and integrating IoT-enabled smart building technologies. APAC is the fastest-growing region with a CAGR of 20.6%, fueled by smart city initiatives.

The adoption of vehicle-to-grid technology and the establishment of a dynamic energy partnership with utilities are key trends shaping the landscape across developed economies.

Market Dynamics

Our researchers analyzed the data with 2025 as the base year, along with the key drivers, trends, and challenges. A holistic analysis of drivers will help companies refine their marketing strategies to gain a competitive advantage.

  • The global grid-interactive building solutions market 2026-2030 is increasingly shaped by specific, high-value applications that drive both operational efficiency and new revenue streams. Strategic decisions now revolve around integrating hvac systems for demand response and optimizing battery storage for grid services, which have proven to be more than twice as effective at reducing peak charges than simple curtailment.
  • However, the industry grapples with establishing robust cybersecurity protocols for building energy management to protect against vulnerabilities. Key growth areas include implementing vehicle-to-grid in commercial buildings and developing openadr compliant building automation. For stakeholders, the core challenge is quantifying the roi of smart building retrofits for grid interaction, as assessing payback periods for grid-interactive solutions is complex.
  • Success hinges on managing thermal inertia for load shifting and understanding the role of AI in predictive building load management. Achieving energy sovereignty with microgrids has become a strategic goal for critical facilities.
  • The future depends on standardizing communication for building-to-grid, monetizing energy flexibility in wholesale markets, deploying agentic AI for autonomous building control, and retrofitting legacy buildings for grid interactivity, all while using digital twins to validate energy savings.

What are the key market drivers leading to the rise in the adoption of Grid-interactive Building Solutions Industry?

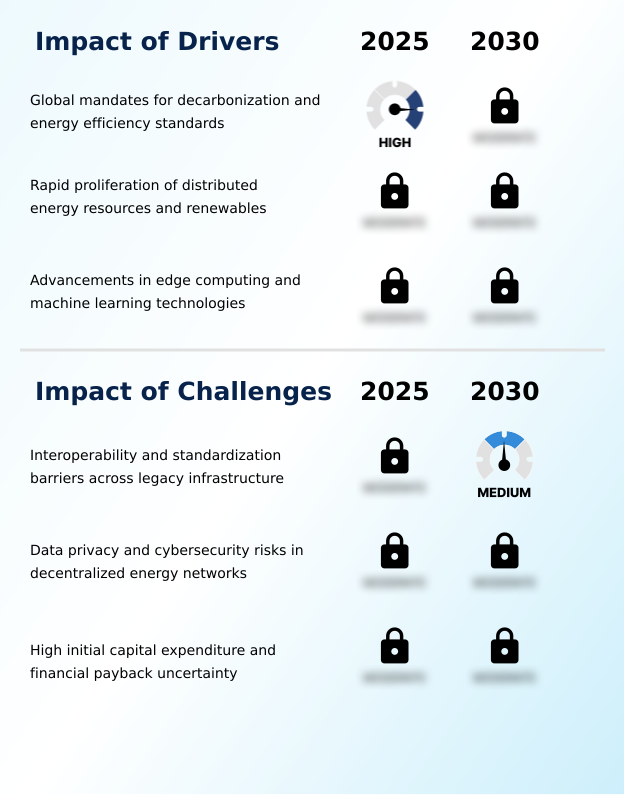
  • The market is primarily driven by global mandates for decarbonization and the implementation of stringent energy efficiency standards.

  • Technological innovation in artificial intelligence is a fundamental driver for grid-interactive solutions. Advanced building energy management systems now enable sub-second automated demand response to grid signals.
  • These systems facilitate smart grid integration and provide essential grid services such as frequency regulation. As energy-as-a-service (EaaS) models become more common, offering grid balancing capabilities, adoption is accelerating.
  • These platforms often manage automated lighting controls and address cybersecurity vulnerabilities through robust design. The push for interoperability standards has improved system reliability by 19.8%, providing a powerful incentive for upgrading portfolios to include self-optimizing energy systems.

What are the market trends shaping the Grid-interactive Building Solutions Industry?

  • A key market trend involves the integration of virtual power plant frameworks within urban environments. This allows for the aggregation of multiple buildings to provide collective capacity to utility companies.

  • A dominant trend is the aggregation of buildings into a virtual power plant, providing collective capacity and enhancing energy flexibility. This model monetizes demand flexibility by enabling participation in wholesale markets, contributing to peak demand reduction. The trend is supported by intelligent building infrastructure and the use of advanced metering infrastructure, which enables bidirectional communication.
  • Deployments of high-performance battery storage have increased by 20.6% in high-density urban areas. Innovative performance-based contracting and the integration of smart thermostats are accelerating adoption, creating a more decentralized and resilient energy landscape where buildings are critical pillars of grid stability.

What challenges does the Grid-interactive Building Solutions Industry face during its growth?

  • A significant industry challenge is the presence of interoperability and standardization barriers across legacy infrastructure.

  • A primary challenge is the high upfront investment for retrofitting assets with sophisticated load shifting technologies and energy storage systems. The financial benefits from ancillary services and energy arbitrage are often dependent on fluctuating utility signals, creating payback uncertainty. Many potential adopters are hesitant to move beyond basic efficiency measures toward full grid-interactivity without clearer incentives for providing flexible capacity.
  • The integration of behind-the-meter resources and participation in demand response aggregation requires advanced predictive analytics and grid-responsive controls, but legacy system fragmentation, which affects over 27% of commercial properties, complicates implementation and increases total cost of ownership.

Exclusive Technavio Analysis on Customer Landscape

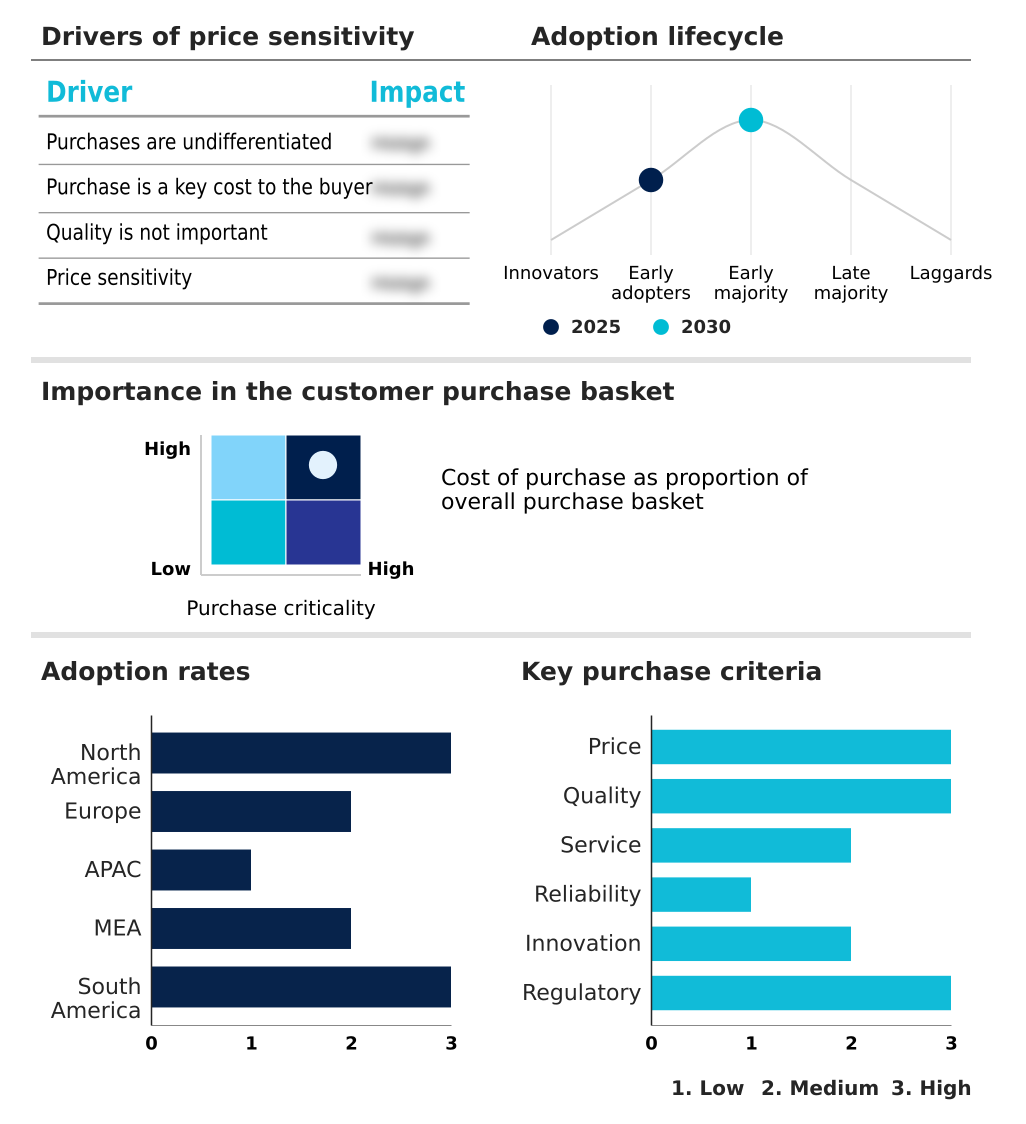
The grid-interactive building solutions market forecasting report includes the adoption lifecycle of the market, covering from the innovator’s stage to the laggard’s stage. It focuses on adoption rates in different regions based on penetration. Furthermore, the grid-interactive building solutions market report also includes key purchase criteria and drivers of price sensitivity to help companies evaluate and develop their market growth analysis strategies.

Customer Landscape of Grid-interactive Building Solutions Industry

Competitive Landscape

Companies are implementing various strategies, such as strategic alliances, grid-interactive building solutions market forecast, partnerships, mergers and acquisitions, geographical expansion, and product/service launches, to enhance their presence in the industry.

ABB Ltd. - Key offerings focus on AI-driven energy management platforms, demand response programs, and distributed energy resource aggregation to optimize building-grid interaction and enhance energy efficiency.

The industry research and growth report includes detailed analyses of the competitive landscape of the market and information about key companies, including:

  • ABB Ltd.
  • C3.ai Inc.
  • Cisco Systems Inc.
  • CPower Energy Management
  • Eaton Corp. Plc
  • Energy Deferral Operations
  • Enel X Italia S.r.l.
  • GridPoint Inc.
  • Honeywell International Inc.
  • IBM Corp.
  • Johnson Controls International
  • Leapfrog Power Inc.
  • Legrand SA
  • Logical Buildings
  • Natures Rapture
  • Schneider Electric SE
  • Siemens AG
  • Slipstream Group Inc.
  • Trane Technologies plc
  • Virtual Peaker

Qualitative and quantitative analysis of companies has been conducted to help clients understand the wider business environment as well as the strengths and weaknesses of key industry players. Data is qualitatively analyzed to categorize companies as pure play, category-focused, industry-focused, and diversified; it is quantitatively analyzed to categorize companies as dominant, leading, strong, tentative, and weak.

Recent Development and News in Grid-interactive building solutions market

  • In May, 2025, Edo launched a significant grid-interactive efficient buildings demonstration project in New York, deploying specialized gateway hardware and AI-driven analytics across commercial structures to deliver flexible capacity and reduce strain on local utility substations.
  • In March, 2025, Johnson Controls enhanced its OpenBlue platform by deploying agentic artificial intelligence, enabling buildings to autonomously manage demand flexibility and transition from static operational insights to integrated decarbonization strategies.
  • In January, 2025, Siemens unveiled its Digital Twin Composer software, integrating comprehensive digital twin technology with real-time engineering data to allow facility operators to virtually simulate and validate investments in grid-interactive infrastructure.
  • In November, 2024, the Forum of Regulators in India introduced the Model Regulations for Grid Interactive Distributed Renewable Energy Sources, establishing a national framework for the interconnection of distributed renewable systems and mandating hybrid inverters for prosumers.

Dive into Technavio’s robust research methodology, blending expert interviews, extensive data synthesis, and validated models for unparalleled Grid-interactive Building Solutions Market insights. See full methodology.

Market Scope
Page number 307
Base year 2025
Historic period 2020-2024
Forecast period 2026-2030
Growth momentum & CAGR Accelerate at a CAGR of 19.8%
Market growth 2026-2030 USD 27094.2 million
Market structure Fragmented
YoY growth 2025-2026(%) 19.4%
Key countries US, Canada, Mexico, Germany, UK, France, Italy, Spain, The Netherlands, China, Japan, South Korea, Australia, India, Singapore, Saudi Arabia, UAE, South Africa, Qatar, Egypt, Brazil, Argentina and Colombia
Competitive landscape Leading Companies, Market Positioning of Companies, Competitive Strategies, and Industry Risks

Request Free Sample

Research Analyst Overview

  • The global grid-interactive building solutions market 2026-2030 is undergoing a structural shift from static consumption to dynamic energy partnership, driven by the need for grid resilience. This evolution centers on deploying smart grid integration technologies that enable bidirectional communication, transforming buildings into flexible assets.
  • Core technologies include building energy management systems and energy storage systems that facilitate demand-side management practices like load shedding and load shifting. The adoption of building automation systems that provide grid services, such as frequency regulation and ancillary services, is becoming standard.
  • For boardroom decisions, the key is leveraging predictive analytics for real-time load-shifting and participating in automated demand response programs. This strategy, which relies on robust microgrid capabilities and vehicle-to-grid technology, has been shown to improve asset utilization by over 27%.
  • The market's maturation reflects a move toward intelligent infrastructures that offer energy flexibility, support peak demand reduction, and enable participation in virtual power plant networks.

What are the Key Data Covered in this Grid-interactive Building Solutions Market Research and Growth Report?

  • What is the expected growth of the Grid-interactive Building Solutions Market between 2026 and 2030?

    • USD 27.09 billion, at a CAGR of 19.8%

  • What segmentation does the market report cover?

    • The report is segmented by Component (Hardware, Software, and Services), Type (Commercial buildings, Residential buildings, and Industrial buildings), Application (Energy efficiency and optimization, Demand flexibility, Demand response and peak shaving, and Others) and Geography (North America, Europe, APAC, Middle East and Africa, South America)

  • Which regions are analyzed in the report?

    • North America, Europe, APAC, Middle East and Africa and South America

  • What are the key growth drivers and market challenges?

    • Global mandates for decarbonization and energy efficiency standards, Interoperability and standardization barriers across legacy infrastructure

  • Who are the major players in the Grid-interactive Building Solutions Market?

    • ABB Ltd., C3.ai Inc., Cisco Systems Inc., CPower Energy Management, Eaton Corp. Plc, Energy Deferral Operations, Enel X Italia S.r.l., GridPoint Inc., Honeywell International Inc., IBM Corp., Johnson Controls International, Leapfrog Power Inc., Legrand SA, Logical Buildings, Natures Rapture, Schneider Electric SE, Siemens AG, Slipstream Group Inc., Trane Technologies plc and Virtual Peaker

Market Research Insights

  • The market dynamics are shifting toward intelligent, self-optimizing infrastructures that prioritize long-term resilience and operational efficiency. The adoption of proactive load management strategies through agentic artificial intelligence has enabled some facilities to reduce peak demand charges by over 30%. This dynamic energy partnership between buildings and utilities is facilitated by decentralized energy networks and intelligent building infrastructure.
  • The move toward autonomous energy management is evident, as systems that utilize digital twin simulation for validation show a 19.4% improvement in forecast accuracy compared to traditional models. This transition is essential for managing the complexity inherent in modern, multi-source energy environments.

We can help! Our analysts can customize this grid-interactive building solutions market research report to meet your requirements.

Get in touch

1. Executive Summary

1.1 Market overview

Executive Summary - Chart on Market Overview
Executive Summary - Data Table on Market Overview
Executive Summary - Chart on Global Market Characteristics
Executive Summary - Chart on Market by Geography
Executive Summary - Chart on Market Segmentation by Component
Executive Summary - Chart on Market Segmentation by Type
Executive Summary - Chart on Market Segmentation by Application
Executive Summary - Chart on Incremental Growth
Executive Summary - Data Table on Incremental Growth
Executive Summary - Chart on Company Market Positioning

2. Technavio Analysis

2.1 Analysis of price sensitivity, lifecycle, customer purchase basket, adoption rates, and purchase criteria

2.2 Criticality of inputs and Factors of differentiation

Chart on Overview on criticality of inputs and factors of differentiation

2.3 Factors of disruption

Chart on Overview on factors of disruption

2.4 Impact of drivers and challenges

Chart on Impact of drivers and challenges in 2025 and 2030

3. Market Landscape

3.1 Market ecosystem

Chart on Parent Market
Data Table on - Parent Market

3.2 Market characteristics

Chart on Market characteristics analysis

3.3 Value chain analysis

Chart on Value chain analysis

4. Market Sizing

4.1 Market definition

Data Table on Offerings of companies included in the market definition

4.2 Market segment analysis

Market segments

4.3 Market size 2025

4.4 Market outlook: Forecast for 2025-2030

Chart on Global - Market size and forecast 2025-2030 ($ million)
Data Table on Global - Market size and forecast 2025-2030 ($ million)
Chart on Global Market: Year-over-year growth 2025-2030 (%)
Data Table on Global Market: Year-over-year growth 2025-2030 (%)

5. Historic Market Size

5.1 Global Grid-Interactive Building Solutions Market 2020 - 2024

Historic Market Size - Data Table on Global Grid-Interactive Building Solutions Market 2020 - 2024 ($ million)

5.2 Component segment analysis 2020 - 2024

Historic Market Size - Component Segment 2020 - 2024 ($ million)

5.3 Type segment analysis 2020 - 2024

Historic Market Size - Type Segment 2020 - 2024 ($ million)

5.4 Application segment analysis 2020 - 2024

Historic Market Size - Application Segment 2020 - 2024 ($ million)

5.5 Geography segment analysis 2020 - 2024

Historic Market Size - Geography Segment 2020 - 2024 ($ million)

5.6 Country segment analysis 2020 - 2024

Historic Market Size - Country Segment 2020 - 2024 ($ million)

6. Qualitative Analysis

6.1 Impact of AI on global grid-interactive building solutions market

6.2 Impact of geopolitical conflicts on global global grid-interactive building solutions market

7. Five Forces Analysis

7.1 Five forces summary

Five forces analysis - Comparison between 2025 and 2030

7.2 Bargaining power of buyers

Bargaining power of buyers - Impact of key factors 2025 and 2030

7.3 Bargaining power of suppliers

Bargaining power of suppliers - Impact of key factors in 2025 and 2030

7.4 Threat of new entrants

Threat of new entrants - Impact of key factors in 2025 and 2030

7.5 Threat of substitutes

Threat of substitutes - Impact of key factors in 2025 and 2030

7.6 Threat of rivalry

Threat of rivalry - Impact of key factors in 2025 and 2030

7.7 Market condition

Chart on Market condition - Five forces 2025 and 2030

8. Market Segmentation by Component

8.1 Market segments

Chart on Component - Market share 2025-2030 (%)
Data Table on Component - Market share 2025-2030 (%)

8.2 Comparison by Component

Chart on Comparison by Component
Data Table on Comparison by Component

8.3 Hardware - Market size and forecast 2025-2030

Chart on Hardware - Market size and forecast 2025-2030 ($ million)
Data Table on Hardware - Market size and forecast 2025-2030 ($ million)
Chart on Hardware - Year-over-year growth 2025-2030 (%)
Data Table on Hardware - Year-over-year growth 2025-2030 (%)

8.4 Software - Market size and forecast 2025-2030

Chart on Software - Market size and forecast 2025-2030 ($ million)
Data Table on Software - Market size and forecast 2025-2030 ($ million)
Chart on Software - Year-over-year growth 2025-2030 (%)
Data Table on Software - Year-over-year growth 2025-2030 (%)

8.5 Services - Market size and forecast 2025-2030

Chart on Services - Market size and forecast 2025-2030 ($ million)
Data Table on Services - Market size and forecast 2025-2030 ($ million)
Chart on Services - Year-over-year growth 2025-2030 (%)
Data Table on Services - Year-over-year growth 2025-2030 (%)

8.6 Market opportunity by Component

Market opportunity by Component ($ million)
Data Table on Market opportunity by Component ($ million)

9. Market Segmentation by Type

9.1 Market segments

Chart on Type - Market share 2025-2030 (%)
Data Table on Type - Market share 2025-2030 (%)

9.2 Comparison by Type

Chart on Comparison by Type
Data Table on Comparison by Type

9.3 Commercial buildings - Market size and forecast 2025-2030

Chart on Commercial buildings - Market size and forecast 2025-2030 ($ million)
Data Table on Commercial buildings - Market size and forecast 2025-2030 ($ million)
Chart on Commercial buildings - Year-over-year growth 2025-2030 (%)
Data Table on Commercial buildings - Year-over-year growth 2025-2030 (%)

9.4 Residential buildings - Market size and forecast 2025-2030

Chart on Residential buildings - Market size and forecast 2025-2030 ($ million)
Data Table on Residential buildings - Market size and forecast 2025-2030 ($ million)
Chart on Residential buildings - Year-over-year growth 2025-2030 (%)
Data Table on Residential buildings - Year-over-year growth 2025-2030 (%)

9.5 Industrial buildings - Market size and forecast 2025-2030

Chart on Industrial buildings - Market size and forecast 2025-2030 ($ million)
Data Table on Industrial buildings - Market size and forecast 2025-2030 ($ million)
Chart on Industrial buildings - Year-over-year growth 2025-2030 (%)
Data Table on Industrial buildings - Year-over-year growth 2025-2030 (%)

9.6 Market opportunity by Type

Market opportunity by Type ($ million)
Data Table on Market opportunity by Type ($ million)

10. Market Segmentation by Application

10.1 Market segments

Chart on Application - Market share 2025-2030 (%)
Data Table on Application - Market share 2025-2030 (%)

10.2 Comparison by Application

Chart on Comparison by Application
Data Table on Comparison by Application

10.3 Energy efficiency and optimization - Market size and forecast 2025-2030

Chart on Energy efficiency and optimization - Market size and forecast 2025-2030 ($ million)
Data Table on Energy efficiency and optimization - Market size and forecast 2025-2030 ($ million)
Chart on Energy efficiency and optimization - Year-over-year growth 2025-2030 (%)
Data Table on Energy efficiency and optimization - Year-over-year growth 2025-2030 (%)

10.4 Demand flexibility - Market size and forecast 2025-2030

Chart on Demand flexibility - Market size and forecast 2025-2030 ($ million)
Data Table on Demand flexibility - Market size and forecast 2025-2030 ($ million)
Chart on Demand flexibility - Year-over-year growth 2025-2030 (%)
Data Table on Demand flexibility - Year-over-year growth 2025-2030 (%)

10.5 Demand response and peak shaving - Market size and forecast 2025-2030

Chart on Demand response and peak shaving - Market size and forecast 2025-2030 ($ million)
Data Table on Demand response and peak shaving - Market size and forecast 2025-2030 ($ million)
Chart on Demand response and peak shaving - Year-over-year growth 2025-2030 (%)
Data Table on Demand response and peak shaving - Year-over-year growth 2025-2030 (%)

10.6 Others - Market size and forecast 2025-2030

Chart on Others - Market size and forecast 2025-2030 ($ million)
Data Table on Others - Market size and forecast 2025-2030 ($ million)
Chart on Others - Year-over-year growth 2025-2030 (%)
Data Table on Others - Year-over-year growth 2025-2030 (%)

10.7 Market opportunity by Application

Market opportunity by Application ($ million)
Data Table on Market opportunity by Application ($ million)

11. Customer Landscape

11.1 Customer landscape overview

Analysis of price sensitivity, lifecycle, customer purchase basket, adoption rates, and purchase criteria

12. Geographic Landscape

12.1 Geographic segmentation

Chart on Market share by geography 2025-2030 (%)
Data Table on Market share by geography 2025-2030 (%)

12.2 Geographic comparison

Chart on Geographic comparison
Data Table on Geographic comparison

12.3 North America - Market size and forecast 2025-2030

Chart on North America - Market size and forecast 2025-2030 ($ million)
Data Table on North America - Market size and forecast 2025-2030 ($ million)
Chart on North America - Year-over-year growth 2025-2030 (%)
Data Table on North America - Year-over-year growth 2025-2030 (%)
Chart on Regional Comparison - North America
Data Table on Regional Comparison - North America

12.3.1 US - Market size and forecast 2025-2030

Chart on US - Market size and forecast 2025-2030 ($ million)
Data Table on US - Market size and forecast 2025-2030 ($ million)
Chart on US - Year-over-year growth 2025-2030 (%)
Data Table on US - Year-over-year growth 2025-2030 (%)

12.3.2 Canada - Market size and forecast 2025-2030

Chart on Canada - Market size and forecast 2025-2030 ($ million)
Data Table on Canada - Market size and forecast 2025-2030 ($ million)
Chart on Canada - Year-over-year growth 2025-2030 (%)
Data Table on Canada - Year-over-year growth 2025-2030 (%)

12.3.3 Mexico - Market size and forecast 2025-2030

Chart on Mexico - Market size and forecast 2025-2030 ($ million)
Data Table on Mexico - Market size and forecast 2025-2030 ($ million)
Chart on Mexico - Year-over-year growth 2025-2030 (%)
Data Table on Mexico - Year-over-year growth 2025-2030 (%)

12.4 Europe - Market size and forecast 2025-2030

Chart on Europe - Market size and forecast 2025-2030 ($ million)
Data Table on Europe - Market size and forecast 2025-2030 ($ million)
Chart on Europe - Year-over-year growth 2025-2030 (%)
Data Table on Europe - Year-over-year growth 2025-2030 (%)
Chart on Regional Comparison - Europe
Data Table on Regional Comparison - Europe

12.4.1 Germany - Market size and forecast 2025-2030

Chart on Germany - Market size and forecast 2025-2030 ($ million)
Data Table on Germany - Market size and forecast 2025-2030 ($ million)
Chart on Germany - Year-over-year growth 2025-2030 (%)
Data Table on Germany - Year-over-year growth 2025-2030 (%)

12.4.2 UK - Market size and forecast 2025-2030

Chart on UK - Market size and forecast 2025-2030 ($ million)
Data Table on UK - Market size and forecast 2025-2030 ($ million)
Chart on UK - Year-over-year growth 2025-2030 (%)
Data Table on UK - Year-over-year growth 2025-2030 (%)

12.4.3 France - Market size and forecast 2025-2030

Chart on France - Market size and forecast 2025-2030 ($ million)
Data Table on France - Market size and forecast 2025-2030 ($ million)
Chart on France - Year-over-year growth 2025-2030 (%)
Data Table on France - Year-over-year growth 2025-2030 (%)

12.4.4 Italy - Market size and forecast 2025-2030

Chart on Italy - Market size and forecast 2025-2030 ($ million)
Data Table on Italy - Market size and forecast 2025-2030 ($ million)
Chart on Italy - Year-over-year growth 2025-2030 (%)
Data Table on Italy - Year-over-year growth 2025-2030 (%)

12.4.5 Spain - Market size and forecast 2025-2030

Chart on Spain - Market size and forecast 2025-2030 ($ million)
Data Table on Spain - Market size and forecast 2025-2030 ($ million)
Chart on Spain - Year-over-year growth 2025-2030 (%)
Data Table on Spain - Year-over-year growth 2025-2030 (%)

12.4.6 The Netherlands - Market size and forecast 2025-2030

Chart on The Netherlands - Market size and forecast 2025-2030 ($ million)
Data Table on The Netherlands - Market size and forecast 2025-2030 ($ million)
Chart on The Netherlands - Year-over-year growth 2025-2030 (%)
Data Table on The Netherlands - Year-over-year growth 2025-2030 (%)

12.5 APAC - Market size and forecast 2025-2030

Chart on APAC - Market size and forecast 2025-2030 ($ million)
Data Table on APAC - Market size and forecast 2025-2030 ($ million)
Chart on APAC - Year-over-year growth 2025-2030 (%)
Data Table on APAC - Year-over-year growth 2025-2030 (%)
Chart on Regional Comparison - APAC
Data Table on Regional Comparison - APAC

12.5.1 China - Market size and forecast 2025-2030

Chart on China - Market size and forecast 2025-2030 ($ million)
Data Table on China - Market size and forecast 2025-2030 ($ million)
Chart on China - Year-over-year growth 2025-2030 (%)
Data Table on China - Year-over-year growth 2025-2030 (%)

12.5.2 Japan - Market size and forecast 2025-2030

Chart on Japan - Market size and forecast 2025-2030 ($ million)
Data Table on Japan - Market size and forecast 2025-2030 ($ million)
Chart on Japan - Year-over-year growth 2025-2030 (%)
Data Table on Japan - Year-over-year growth 2025-2030 (%)

12.5.3 South Korea - Market size and forecast 2025-2030

Chart on South Korea - Market size and forecast 2025-2030 ($ million)
Data Table on South Korea - Market size and forecast 2025-2030 ($ million)
Chart on South Korea - Year-over-year growth 2025-2030 (%)
Data Table on South Korea - Year-over-year growth 2025-2030 (%)

12.5.4 Australia - Market size and forecast 2025-2030

Chart on Australia - Market size and forecast 2025-2030 ($ million)
Data Table on Australia - Market size and forecast 2025-2030 ($ million)
Chart on Australia - Year-over-year growth 2025-2030 (%)
Data Table on Australia - Year-over-year growth 2025-2030 (%)

12.5.5 India - Market size and forecast 2025-2030

Chart on India - Market size and forecast 2025-2030 ($ million)
Data Table on India - Market size and forecast 2025-2030 ($ million)
Chart on India - Year-over-year growth 2025-2030 (%)
Data Table on India - Year-over-year growth 2025-2030 (%)

12.5.6 Singapore - Market size and forecast 2025-2030

Chart on Singapore - Market size and forecast 2025-2030 ($ million)
Data Table on Singapore - Market size and forecast 2025-2030 ($ million)
Chart on Singapore - Year-over-year growth 2025-2030 (%)
Data Table on Singapore - Year-over-year growth 2025-2030 (%)

12.6 Middle East and Africa - Market size and forecast 2025-2030

Chart on Middle East and Africa - Market size and forecast 2025-2030 ($ million)
Data Table on Middle East and Africa - Market size and forecast 2025-2030 ($ million)
Chart on Middle East and Africa - Year-over-year growth 2025-2030 (%)
Data Table on Middle East and Africa - Year-over-year growth 2025-2030 (%)
Chart on Regional Comparison - Middle East and Africa
Data Table on Regional Comparison - Middle East and Africa

12.6.1 Saudi Arabia - Market size and forecast 2025-2030

Chart on Saudi Arabia - Market size and forecast 2025-2030 ($ million)
Data Table on Saudi Arabia - Market size and forecast 2025-2030 ($ million)
Chart on Saudi Arabia - Year-over-year growth 2025-2030 (%)
Data Table on Saudi Arabia - Year-over-year growth 2025-2030 (%)

12.6.2 UAE - Market size and forecast 2025-2030

Chart on UAE - Market size and forecast 2025-2030 ($ million)
Data Table on UAE - Market size and forecast 2025-2030 ($ million)
Chart on UAE - Year-over-year growth 2025-2030 (%)
Data Table on UAE - Year-over-year growth 2025-2030 (%)

12.6.3 South Africa - Market size and forecast 2025-2030

Chart on South Africa - Market size and forecast 2025-2030 ($ million)
Data Table on South Africa - Market size and forecast 2025-2030 ($ million)
Chart on South Africa - Year-over-year growth 2025-2030 (%)
Data Table on South Africa - Year-over-year growth 2025-2030 (%)

12.6.4 Qatar - Market size and forecast 2025-2030

Chart on Qatar - Market size and forecast 2025-2030 ($ million)
Data Table on Qatar - Market size and forecast 2025-2030 ($ million)
Chart on Qatar - Year-over-year growth 2025-2030 (%)
Data Table on Qatar - Year-over-year growth 2025-2030 (%)

12.6.5 Egypt - Market size and forecast 2025-2030

Chart on Egypt - Market size and forecast 2025-2030 ($ million)
Data Table on Egypt - Market size and forecast 2025-2030 ($ million)
Chart on Egypt - Year-over-year growth 2025-2030 (%)
Data Table on Egypt - Year-over-year growth 2025-2030 (%)

12.7 South America - Market size and forecast 2025-2030

Chart on South America - Market size and forecast 2025-2030 ($ million)
Data Table on South America - Market size and forecast 2025-2030 ($ million)
Chart on South America - Year-over-year growth 2025-2030 (%)
Data Table on South America - Year-over-year growth 2025-2030 (%)
Chart on Regional Comparison - South America
Data Table on Regional Comparison - South America

12.7.1 Brazil - Market size and forecast 2025-2030

Chart on Brazil - Market size and forecast 2025-2030 ($ million)
Data Table on Brazil - Market size and forecast 2025-2030 ($ million)
Chart on Brazil - Year-over-year growth 2025-2030 (%)
Data Table on Brazil - Year-over-year growth 2025-2030 (%)

12.7.2 Argentina - Market size and forecast 2025-2030

Chart on Argentina - Market size and forecast 2025-2030 ($ million)
Data Table on Argentina - Market size and forecast 2025-2030 ($ million)
Chart on Argentina - Year-over-year growth 2025-2030 (%)
Data Table on Argentina - Year-over-year growth 2025-2030 (%)

12.7.3 Colombia - Market size and forecast 2025-2030

Chart on Colombia - Market size and forecast 2025-2030 ($ million)
Data Table on Colombia - Market size and forecast 2025-2030 ($ million)
Chart on Colombia - Year-over-year growth 2025-2030 (%)
Data Table on Colombia - Year-over-year growth 2025-2030 (%)

12.8 Market opportunity by geography

Market opportunity by geography ($ million)
Data Tables on Market opportunity by geography ($ million)

13. Drivers, Challenges, and Opportunity

13.1 Market drivers

Global mandates for decarbonization and energy efficiency standards
Rapid proliferation of distributed energy resources and renewables
Advancements in edge computing and machine learning technologies

13.2 Market challenges

Interoperability and standardization barriers across legacy infrastructure
Data privacy and cybersecurity risks in decentralized energy networks
High initial capital expenditure and financial payback uncertainty

13.3 Impact of drivers and challenges

Impact of drivers and challenges in 2025 and 2030

13.4 Market opportunities

Integration of virtual power plant frameworks in urban environments
Shift toward agentic artificial intelligence and autonomous operations
Growth of energy-as-a-service and performance-based contracting models

14. Competitive Landscape

14.1 Overview

14.2

Overview on criticality of inputs and factors of differentiation

14.3 Landscape disruption

Overview on factors of disruption

14.4 Industry risks

Impact of key risks on business

15. Competitive Analysis

15.1 Companies profiled

Companies covered

15.2 Company ranking index

15.3 Market positioning of companies

Matrix on companies position and classification

15.4 ABB Ltd.

ABB Ltd. - Overview
ABB Ltd. - Business segments
ABB Ltd. - Key news
ABB Ltd. - Key offerings
ABB Ltd. - Segment focus
SWOT

15.5 C3.ai Inc.

C3.ai Inc. - Overview
C3.ai Inc. - Product / Service
C3.ai Inc. - Key news
C3.ai Inc. - Key offerings
SWOT

15.6 Cisco Systems Inc.

Cisco Systems Inc. - Overview
Cisco Systems Inc. - Business segments
Cisco Systems Inc. - Key news
Cisco Systems Inc. - Key offerings
Cisco Systems Inc. - Segment focus
SWOT

15.7 CPower Energy Management

CPower Energy Management - Overview
CPower Energy Management - Product / Service
CPower Energy Management - Key offerings
SWOT

15.8 Eaton Corp. Plc

Eaton Corp. Plc - Overview
Eaton Corp. Plc - Business segments
Eaton Corp. Plc - Key news
Eaton Corp. Plc - Key offerings
Eaton Corp. Plc - Segment focus
SWOT

15.9 Energy Deferral Operations

Energy Deferral Operations - Overview
Energy Deferral Operations - Product / Service
Energy Deferral Operations - Key offerings
SWOT

15.10 Enel X Italia S.r.l.

Enel X Italia S.r.l. - Overview
Enel X Italia S.r.l. - Product / Service
Enel X Italia S.r.l. - Key offerings
SWOT

15.11 GridPoint Inc.

GridPoint Inc. - Overview
GridPoint Inc. - Product / Service
GridPoint Inc. - Key offerings
SWOT

15.12 Honeywell International Inc.

Honeywell International Inc. - Overview
Honeywell International Inc. - Business segments
Honeywell International Inc. - Key news
Honeywell International Inc. - Key offerings
Honeywell International Inc. - Segment focus
SWOT

15.13 IBM Corp.

IBM Corp. - Overview
IBM Corp. - Business segments
IBM Corp. - Key news
IBM Corp. - Key offerings
IBM Corp. - Segment focus
SWOT

15.14 Johnson Controls International

Johnson Controls International - Overview
Johnson Controls International - Business segments
Johnson Controls International - Key news
Johnson Controls International - Key offerings
Johnson Controls International - Segment focus
SWOT

15.15 Legrand SA

Legrand SA - Overview
Legrand SA - Business segments
Legrand SA - Key news
Legrand SA - Key offerings
Legrand SA - Segment focus
SWOT

15.16 Schneider Electric SE

Schneider Electric SE - Overview
Schneider Electric SE - Business segments
Schneider Electric SE - Key news
Schneider Electric SE - Key offerings
Schneider Electric SE - Segment focus
SWOT

15.17 Siemens AG

Siemens AG - Overview
Siemens AG - Business segments
Siemens AG - Key news
Siemens AG - Key offerings
Siemens AG - Segment focus
SWOT

15.18 Trane Technologies plc

Trane Technologies plc - Overview
Trane Technologies plc - Business segments
Trane Technologies plc - Key news
Trane Technologies plc - Key offerings
Trane Technologies plc - Segment focus
SWOT

16. Appendix

16.1 Scope of the report

Market definition
Objectives
Notes and caveats

16.2 Inclusions and exclusions checklist

Inclusions checklist
Exclusions checklist

16.3 Currency conversion rates for US$

16.4 Research methodology

16.5 Data procurement

Information sources

16.6 Data validation

16.7 Validation techniques employed for market sizing

16.8 Data synthesis

16.9 360 degree market analysis

16.10 List of abbreviations

Research Methodology

Technavio presents a detailed picture of the market by way of study, synthesis, and summation of data from multiple sources. The analysts have presented the various facets of the market with a particular focus on identifying the key industry influencers. The data thus presented is comprehensive, reliable, and the result of extensive research, both primary and secondary.

INFORMATION SOURCES

Primary sources

  • Manufacturers and suppliers
  • Channel partners
  • Industry experts
  • Strategic decision makers

Secondary sources

  • Industry journals and periodicals
  • Government data
  • Financial reports of key industry players
  • Historical data
  • Press releases

DATA ANALYSIS

Data Synthesis

  • Collation of data
  • Estimation of key figures
  • Analysis of derived insights

Data Validation

  • Triangulation with data models
  • Reference against proprietary databases
  • Corroboration with industry experts

REPORT WRITING

Qualitative

  • Market drivers
  • Market challenges
  • Market trends
  • Five forces analysis

Quantitative

  • Market size and forecast
  • Market segmentation
  • Geographical insights
  • Competitive landscape

Interested in this report?

Get your sample now to see our research methodology and insights!

Download Now

Frequently Asked Questions

Grid-interactive Building Solutions market growth will increase by USD 27094.2 million during 2026-2030.

The Grid-interactive Building Solutions market is expected to grow at a CAGR of 19.8% during 2026-2030.

Grid-interactive Building Solutions market is segmented by Component (Hardware, Software, Services) Type (Commercial buildings, Residential buildings, Industrial buildings) Application (Energy efficiency and optimization, Demand flexibility, Demand response and peak shaving, Others)

ABB Ltd., C3.ai Inc., Cisco Systems Inc., CPower Energy Management, Eaton Corp. Plc, Energy Deferral Operations, Enel X Italia S.r.l., GridPoint Inc., Honeywell International Inc., IBM Corp., Johnson Controls International, Leapfrog Power Inc., Legrand SA, Logical Buildings, Natures Rapture, Schneider Electric SE, Siemens AG, Slipstream Group Inc., Trane Technologies plc, Virtual Peaker are a few of the key vendors in the Grid-interactive Building Solutions market.

North America will register the highest growth rate of 39.3% among the other regions. Therefore, the Grid-interactive Building Solutions market in North America is expected to garner significant business opportunities for the vendors during the forecast period.

US, Canada, Mexico, Germany, UK, France, Italy, Spain, The Netherlands, China, Japan, South Korea, Australia, India, Singapore, Saudi Arabia, UAE, South Africa, Qatar, Egypt, Brazil, Argentina, Colombia

  • Global mandates for decarbonization and energy efficiency standards is the driving factor this market.

The Grid-interactive Building Solutions market vendors should focus on grabbing business opportunities from the Component segment as it accounted for the largest market share in the base year.
RIA - Research AI Assistant
Ask RIA