Green Steel Market Analysis, Size, and Forecast 2026-2030: Europe (Germany, UK, and France), APAC (China, India, and Japan), North America (US, Canada, and Mexico), South America (Brazil, Argentina, and Colombia), Middle East and Africa (Saudi Arabia, UAE, and Turkey), and Rest of World (ROW)

Green Steel Market Analysis, Size, and Forecast 2026-2030:
Europe (Germany, UK, and France), APAC (China, India, and Japan), North America (US, Canada, and Mexico), South America (Brazil, Argentina, and Colombia), Middle East and Africa (Saudi Arabia, UAE, and Turkey), and Rest of World (ROW)

Published: Apr 2026 314 Pages SKU: IRTNTR81437

Market Overview at a Glance

$29.19 B
Market Opportunity
43.8%
CAGR 2025 - 2030
44.2%
Europe Growth
$2.12 B
Recycled steel segment 2024

Green Steel Market Size 2026-2030

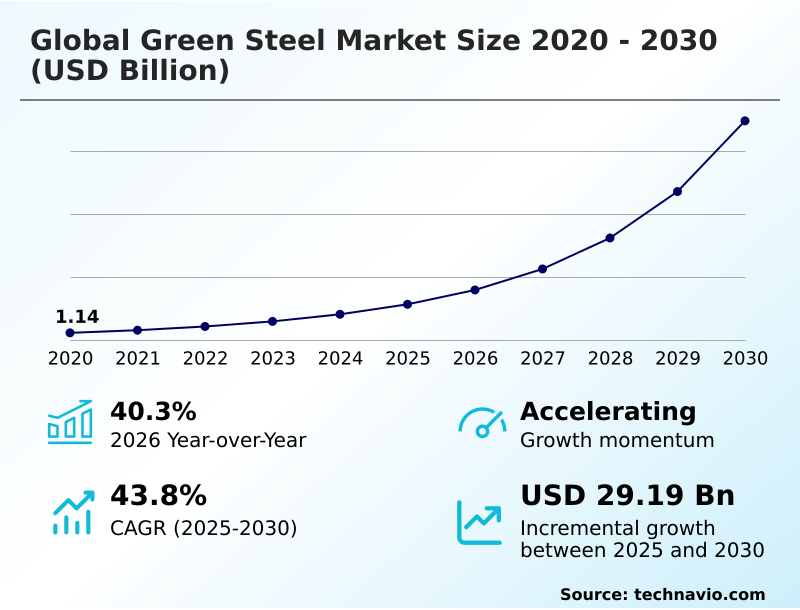
The green steel market size is valued to increase by USD 29.19 billion, at a CAGR of 43.8% from 2025 to 2030. Stringent environmental regulations and carbon pricing initiatives will drive the green steel market.

Major Market Trends & Insights

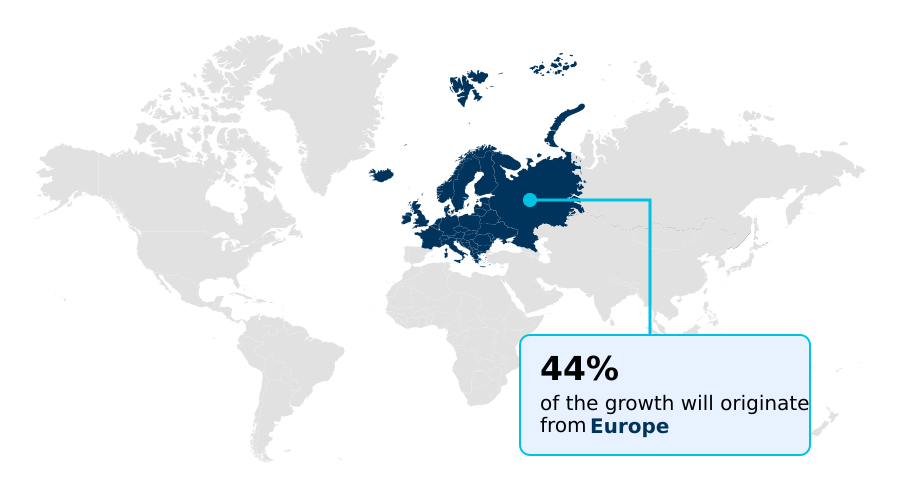
  • Europe dominated the market and accounted for a 44.2% growth during the forecast period.
  • By Type - Recycled steel segment was valued at USD 2.12 billion in 2024
  • By Technology - Electric arc furnace segment accounted for the largest market revenue share in 2024

Market Size & Forecast

  • Market Opportunities: USD 33.73 billion
  • Market Future Opportunities: USD 29.19 billion
  • CAGR from 2025 to 2030 : 43.8%

Market Summary

  • The green steel market represents a fundamental shift in metallurgy, driven by the need to reconcile industrial production with environmental stewardship. This transition is propelled by stringent regulations and the implementation of frameworks like the carbon border adjustment mechanism, creating financial incentives to abandon carbon-intensive processes.
  • Key trends include the adoption of hydrogen-based direct reduction and the expansion of electric arc furnace technology powered by renewables. Concurrently, corporate decarbonization targets from downstream sectors, particularly automotive, create strong demand-side pull for materials with a lower carbon footprint.
  • However, the industry faces challenges related to the high capital costs of retrofitting plants and the nascent state of green hydrogen infrastructure. For example, a manufacturer aiming to reduce scope 3 emissions must secure a verifiable supply of low-carbon steel, a process that involves complex supply chain validation using technologies like blockchain to ensure traceability from production to final assembly.
  • This move toward circular economy principles and sustainable sourcing is reshaping the entire value chain, making data transparency and material verification central to long-term business strategy and market positioning.

What will be the Size of the Green Steel Market during the forecast period?

Get Key Insights on Market Forecast (PDF) Request Free Sample

How is the Green Steel Market Segmented?

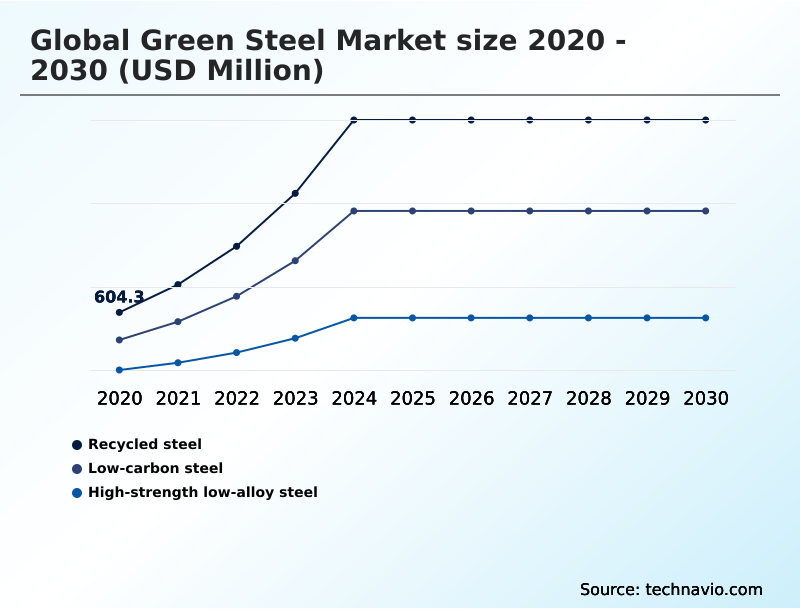
The green steel industry research report provides comprehensive data (region-wise segment analysis), with forecasts and estimates in "USD million" for the period 2026-2030, as well as historical data from 2020-2024 for the following segments.

  • Type
    • Recycled steel
    • Low-carbon steel
    • High-strength low-alloy steel
  • Technology
    • Electric arc furnace
    • Hydrogen-based direct reduced iron
    • Molten oxide electrolysis
    • Others
  • End-user
    • Automotive
    • Construction
    • Industrial equipment and machinery
    • Energy and power
    • Others
  • Geography
    • Europe
      • Germany
      • UK
      • France
    • APAC
      • China
      • India
      • Japan
    • North America
      • US
      • Canada
      • Mexico
    • South America
      • Brazil
      • Argentina
      • Colombia
    • Middle East and Africa
      • Saudi Arabia
      • UAE
      • Turkey
    • Rest of World (ROW)

By Type Insights

The recycled steel segment is estimated to witness significant growth during the forecast period.

Market segmentation reflects diverse decarbonization pathways beyond primary routes. Technologies like the molten oxide electrolysis process and electrochemical metal extraction promise direct, carbon-free production.

For existing infrastructure, carbon capture utilization storage offers a transitional solution, while biomass-based reduction using bio-coke fuel replacement provides a lower-carbon alternative to coal. The development of advanced proton exchange membrane electrolyzer technology is critical for scaling green hydrogen.

This focus on sustainable material efficiency is vital for end-users, such as the industrial equipment decarbonization sector and for building renewable energy infrastructure steel.

Effective carbon footprint tracking, which can reduce embodied carbon in steel by over 80% compared to traditional methods, is essential for demonstrating compliance. All these approaches rely on access to carbon-free electricity sourcing for net-zero industrial manufacturing.

Request Free Sample

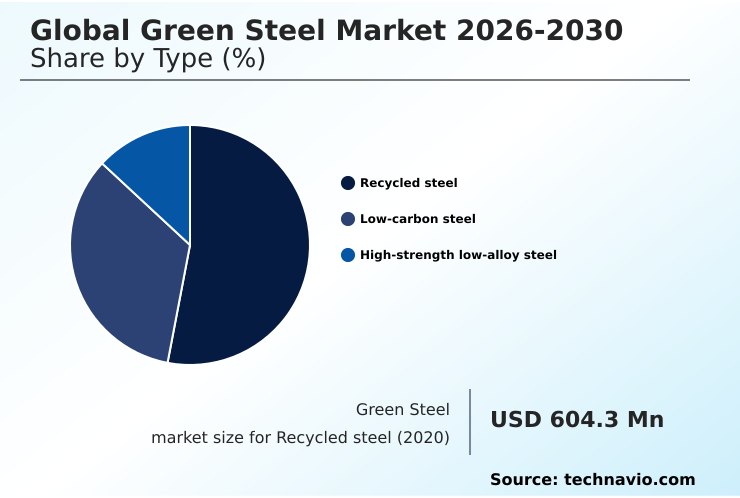
The Recycled steel segment was valued at USD 2.12 billion in 2024 and showed a gradual increase during the forecast period.

Request Free Sample

Regional Analysis

Europe is estimated to contribute 44.2% to the growth of the global market during the forecast period.Technavio’s analysts have elaborately explained the regional trends and drivers that shape the market during the forecast period.

See How Green Steel Market Demand is Rising in Europe Request Free Sample

The geographic landscape is shaped by regional strengths in technology and resources. Europe is pioneering low-carbon metallurgical innovation, focusing on hydrogen-based direct reduction and creating carbon-neutral industrial clusters.

The region's automotive industry is a key offtaker for advanced high-strength steel and other high-tensile strength alloys.

In APAC, the focus is on structural steel decarbonization through the expansion of electric arc furnace technology and electrified steelmaking processes, supported by policies promoting sustainable forestry for bio-coke. North America leverages its expertise in hydrogen injection in blast furnaces.

The ultimate goal across all regions is achieving zero-emission steel production, but progress is uneven. For example, regions with abundant renewables are advancing electrolytic iron production and other sustainable industrial materials 50% faster than those with carbon-intensive grids.

Market Dynamics

Our researchers analyzed the data with 2025 as the base year, along with the key drivers, trends, and challenges. A holistic analysis of drivers will help companies refine their marketing strategies to gain a competitive advantage.

  • The transition to sustainable steel manufacturing hinges on several interconnected technological and economic factors. The hydrogen direct reduction ironmaking process stands as a primary pathway to decarbonization of heavy industry, though its viability depends on investment in hydrogen steel plants and reliable raw material sourcing for DRI.
  • Simultaneously, electric arc furnace scrap recycling offers a circular route, but its effectiveness is tied to advanced technologies like robotic sorting for metal scrap. Innovations such as molten oxide electrolysis for steel and carbon capture in steel production provide alternative routes, though they face their own challenges in green steel adoption. For downstream users, the benefits are clear.
  • High-strength low-alloy steel applications are crucial for designing next-generation products, particularly advanced steel for electric vehicles. To ensure authenticity, blockchain for steel supply chain and digital twins in steel manufacturing provide unprecedented transparency. The lifecycle assessment of steel products becomes a critical metric, especially for automakers focused on reducing scope 3 emissions in automotive.
  • As demand grows, influenced by green building materials certification and circular economy for steel scrap principles, the entire value chain is being re-evaluated. For example, implementing renewable energy for EAF steelmaking can reduce operational energy costs by up to 20% compared to fossil-fuel-powered alternatives, a significant factor in supply chain planning.
  • The impact of regulations like the carbon border adjustment impact further complicates international trade, making the shift to green hydrogen production for industry a strategic imperative.

What are the key market drivers leading to the rise in the adoption of Green Steel Industry?

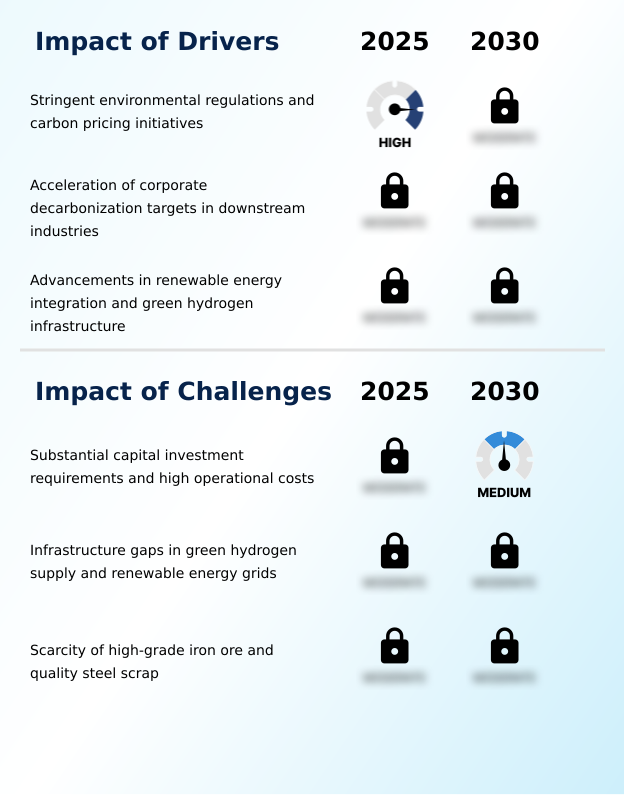
  • Stringent environmental regulations and carbon pricing initiatives are key drivers compelling the industry to adopt cleaner production technologies.

  • Market expansion is propelled by a stringent industrial emissions framework, including the carbon border adjustment mechanism and emissions trading systems that incentivize low-carbon industrial processes.
  • Downstream industries are accelerating their corporate decarbonization targets, increasing demand for materials that reduce scope 3 emissions and support green building certifications. This is particularly evident in the automotive sector's need for automotive lightweighting materials.
  • Progress in renewable energy integration is critical, yet depends on ensuring renewable energy grid stability.
  • The development of a resilient green hydrogen supply chain is equally vital, with advancements in lifecycle assessment data showing a potential 70% reduction in emissions for steel produced with green hydrogen compared to conventional methods.
  • This supports the broader goal of sustainable urban development.

What are the market trends shaping the Green Steel Industry?

  • A prominent trend is the development of integrated industrial clusters where steel manufacturing is co-located with large-scale hydrogen generation and renewable energy sites. This cross-sector synergy optimizes logistics and stabilizes clean energy supply.

  • Key market trends center on enhancing efficiency and transparency. The development of industrial hydrogen hubs exemplifies cross-sector hydrogen synergies, optimizing logistics along dedicated carbon-neutral freight corridors. There is a strong focus on digital supply chain transparency, where blockchain supply chain traceability and digital twin production simulation provide verified environmental claims.
  • These digital tools improve operational oversight by over 25% compared to legacy systems. Concurrently, an emphasis on circular economy principles is driving innovation in high-precision scrap beneficiation.
  • The adoption of advanced scrap sorting technology, including robotic scrap sorting systems and chemical scrap purification techniques, is creating closed-loop recycling systems that produce higher-quality feedstock, with some processes improving scrap purity by 15%.

What challenges does the Green Steel Industry face during its growth?

  • Substantial capital investment requirements and high operational costs present a key challenge affecting the industry's growth trajectory.

  • The transition to fossil-free steel production is constrained by significant challenges. The substantial capital expenditure for retrofitting existing facilities into a modern industrial energy ecosystem remains a primary hurdle. Securing sustainable raw material procurement is another critical issue, with a scarcity of high-grade raw materials like direct-reduction grade iron ore and high-purity iron ore pellets.
  • This elevates the need for iron ore beneficiation techniques. Furthermore, the operational cost of electrolysis for green hydrogen is still high, requiring advancements in high-capacity electrolyzers to become competitive with metallurgical coal alternatives.
  • A reliable supply of direct reduced iron feedstock and high-purity scrap availability are essential, with supply chain disruptions causing production delays of up to 20% in some regions.

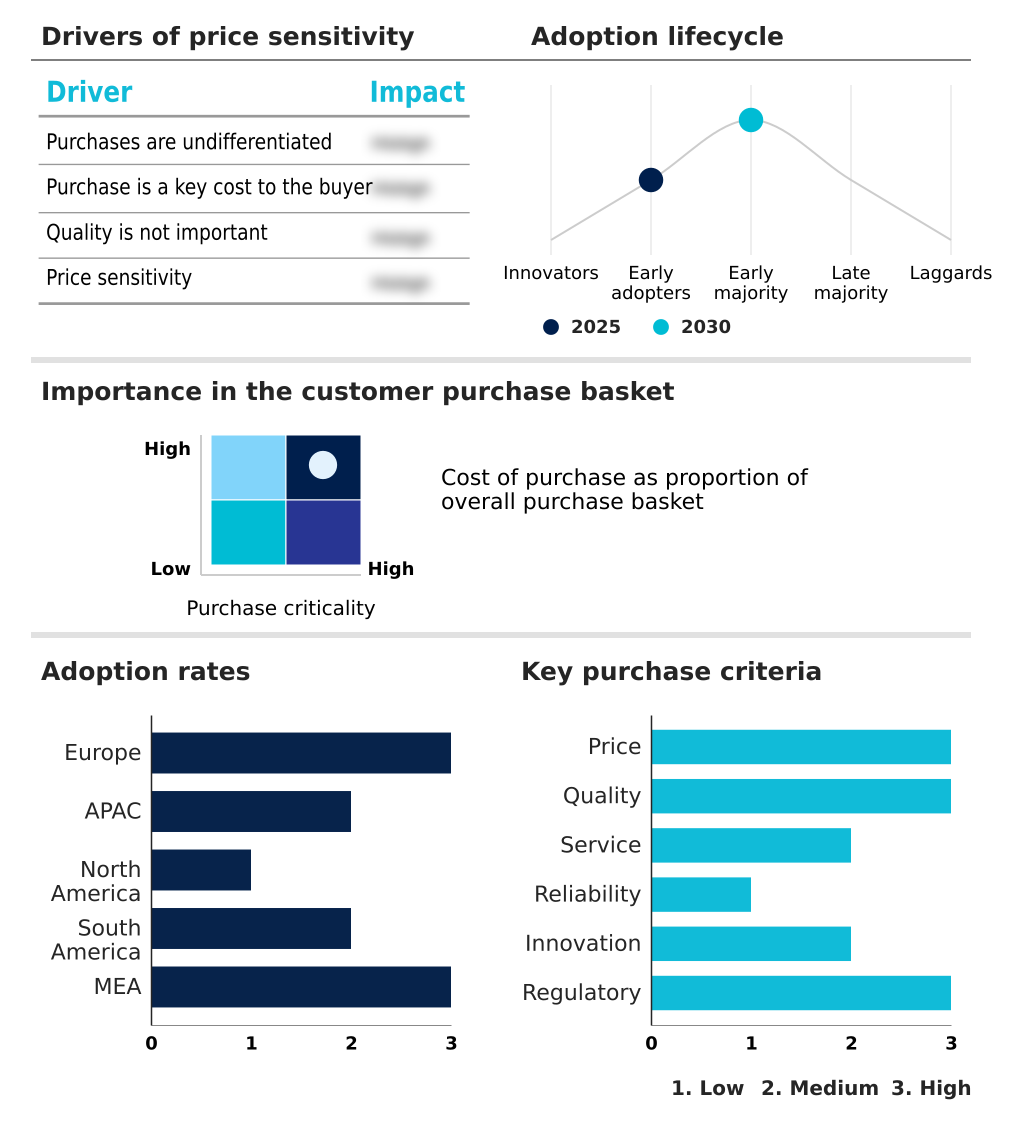
Exclusive Technavio Analysis on Customer Landscape

The green steel market forecasting report includes the adoption lifecycle of the market, covering from the innovator’s stage to the laggard’s stage. It focuses on adoption rates in different regions based on penetration. Furthermore, the green steel market report also includes key purchase criteria and drivers of price sensitivity to help companies evaluate and develop their market growth analysis strategies.

Customer Landscape of Green Steel Industry

Competitive Landscape

Companies are implementing various strategies, such as strategic alliances, green steel market forecast, partnerships, mergers and acquisitions, geographical expansion, and product/service launches, to enhance their presence in the industry.

ArcelorMittal S.A. - Offerings include recycled and renewably produced steel, alongside certified low-carbon steel solutions, addressing demand for sustainable materials across industrial applications.

The industry research and growth report includes detailed analyses of the competitive landscape of the market and information about key companies, including:

  • ArcelorMittal S.A.
  • BlueScope Steel Ltd.
  • Boston Electrometallurgical Corp
  • China BaoWu Steel Group Corp.
  • Cleveland Cliffs Inc.
  • Gerdau SA
  • HBIS Group Co. Ltd.
  • Hyundai Steel Co.
  • JFE Holdings Inc.
  • LIBERTY Steel Group
  • Nippon Steel Corp.
  • Nucor Corp.
  • Outokumpu Oyj
  • POSCO Co. Ltd.
  • Salzgitter AG
  • SSAB AB
  • Tata Steel Ltd.
  • thyssenkrupp Steel Europe AG
  • United States Steel Corp.
  • voestalpine AG

Qualitative and quantitative analysis of companies has been conducted to help clients understand the wider business environment as well as the strengths and weaknesses of key industry players. Data is qualitatively analyzed to categorize companies as pure play, category-focused, industry-focused, and diversified; it is quantitatively analyzed to categorize companies as dominant, leading, strong, tentative, and weak.

Recent Development and News in Green steel market

  • In February, 2025, a major North American utility provider initiated construction of a high-capacity hydrogen electrolyzer facility to create a localized energy ecosystem for heavy manufacturing plants in the Great Lakes region.
  • In March, 2025, a leading European steel producer finalized a long-term agreement with a renewable energy consortium to procure wind-generated electricity for an upcoming electric arc furnace project, ensuring a stable supply of clean energy.
  • In April, 2025, a prominent European regulatory agency implemented a revised framework for industrial emissions, mandating a 20% reduction in carbon intensity for all primary metal production facilities by 2030.
  • In May, 2025, a prominent international recycling firm inaugurated an automated scrap processing center in the Port of Rotterdam, utilizing advanced sensory technology and AI to enhance raw material purity for green steel manufacturers.

Dive into Technavio’s robust research methodology, blending expert interviews, extensive data synthesis, and validated models for unparalleled Green Steel Market insights. See full methodology.

Market Scope
Page number 314
Base year 2025
Historic period 2020-2024
Forecast period 2026-2030
Growth momentum & CAGR Accelerate at a CAGR of 43.8%
Market growth 2026-2030 USD 29191.9 million
Market structure Fragmented
YoY growth 2025-2026(%) 40.3%
Key countries Sweden, Germany, UK, France, Italy, Spain, China, India, Japan, South Korea, Australia, Indonesia, US, Canada, Mexico, Brazil, Argentina, Colombia, Saudi Arabia, UAE, Turkey, Egypt and South Africa
Competitive landscape Leading Companies, Market Positioning of Companies, Competitive Strategies, and Industry Risks

Request Free Sample

Research Analyst Overview

  • The industry is undergoing a pivotal transformation toward sustainable industrial materials, driven by a strict industrial emissions framework and the carbon border adjustment mechanism. This directly affects corporate decarbonization targets and scope 3 emissions reduction.
  • At the core are two technology pathways: electric arc furnace technology, leveraging circular economy principles, and hydrogen-based direct reduction, requiring a robust green hydrogen infrastructure and access to direct-reduction grade iron ore. Boardroom decisions now focus on securing high-purity iron ore pellets and managing the high capital expenditure for retrofitting.
  • Adopting digital twin production simulation, for instance, can reduce process energy use by over 12%. Innovations in high-precision scrap beneficiation, including robotic scrap sorting systems, are enhancing feedstock for advanced high-strength steel. Other methods like the molten oxide electrolysis process and biomass-based reduction offer alternative routes to fossil-free steel production, with technologies like proton exchange membrane electrolyzer becoming key.
  • This evolution, verified via blockchain supply chain traceability and supporting green building certifications, is reshaping the industrial energy ecosystem.

What are the Key Data Covered in this Green Steel Market Research and Growth Report?

  • What is the expected growth of the Green Steel Market between 2026 and 2030?

    • USD 29.19 billion, at a CAGR of 43.8%

  • What segmentation does the market report cover?

    • The report is segmented by Type (Recycled steel, Low-carbon steel, and High-strength low-alloy steel), Technology (Electric arc furnace, Hydrogen-based direct reduced iron, Molten oxide electrolysis, and Others), End-user (Automotive, Construction, Industrial equipment and machinery, Energy and power, and Others) and Geography (Europe, APAC, North America, South America, Middle East and Africa)

  • Which regions are analyzed in the report?

    • Europe, APAC, North America, South America and Middle East and Africa

  • What are the key growth drivers and market challenges?

    • Stringent environmental regulations and carbon pricing initiatives, Substantial capital investment requirements and high operational costs

  • Who are the major players in the Green Steel Market?

    • ArcelorMittal S.A., BlueScope Steel Ltd., Boston Electrometallurgical Corp, China BaoWu Steel Group Corp., Cleveland Cliffs Inc., Gerdau SA, HBIS Group Co. Ltd., Hyundai Steel Co., JFE Holdings Inc., LIBERTY Steel Group, Nippon Steel Corp., Nucor Corp., Outokumpu Oyj, POSCO Co. Ltd., Salzgitter AG, SSAB AB, Tata Steel Ltd., thyssenkrupp Steel Europe AG, United States Steel Corp. and voestalpine AG

Market Research Insights

  • The market's dynamics are shaped by a confluence of regulatory pressures and supply chain innovations. The push for decarbonization is creating a notable green premium, with certified low-carbon materials commanding prices up to 30% higher than conventional steel. This shift compels manufacturers to focus on electrified steelmaking processes and direct reduced iron feedstock.
  • Downstream, corporate buyers are driving demand for sustainable urban development and automotive lightweighting materials, with a focus on reducing embodied carbon in steel. Implementing digital supply chain transparency through blockchain can reduce verification costs by over 40% compared to manual audits.
  • However, progress is tempered by infrastructure gaps in the green hydrogen supply chain and the scarcity of high-purity scrap availability. These challenges directly impact the operational cost of electrolysis and the capital expenditure for retrofitting, creating a complex strategic landscape for producers.

We can help! Our analysts can customize this green steel market research report to meet your requirements.

Get in touch

1. Executive Summary

1.1 Market overview

Executive Summary - Chart on Market Overview
Executive Summary - Data Table on Market Overview
Executive Summary - Chart on Global Market Characteristics
Executive Summary - Chart on Market by Geography
Executive Summary - Chart on Market Segmentation by Type
Executive Summary - Chart on Market Segmentation by Technology
Executive Summary - Chart on Market Segmentation by End-user
Executive Summary - Chart on Incremental Growth
Executive Summary - Data Table on Incremental Growth
Executive Summary - Chart on Company Market Positioning

2. Technavio Analysis

2.1 Analysis of price sensitivity, lifecycle, customer purchase basket, adoption rates, and purchase criteria

2.2 Criticality of inputs and Factors of differentiation

Chart on Overview on criticality of inputs and factors of differentiation

2.3 Factors of disruption

Chart on Overview on factors of disruption

2.4 Impact of drivers and challenges

Chart on Impact of drivers and challenges in 2025 and 2030

3. Market Landscape

3.1 Market ecosystem

Chart on Parent Market
Data Table on - Parent Market

3.2 Market characteristics

Chart on Market characteristics analysis

3.3 Value chain analysis

Chart on Value chain analysis

4. Market Sizing

4.1 Market definition

Data Table on Offerings of companies included in the market definition

4.2 Market segment analysis

Market segments

4.3 Market size 2025

4.4 Market outlook: Forecast for 2025-2030

Chart on Global - Market size and forecast 2025-2030 ($ million)
Data Table on Global - Market size and forecast 2025-2030 ($ million)
Chart on Global Market: Year-over-year growth 2025-2030 (%)
Data Table on Global Market: Year-over-year growth 2025-2030 (%)

5. Historic Market Size

5.1 Global Green Steel Market 2020 - 2024

Historic Market Size - Data Table on Global Green Steel Market 2020 - 2024 ($ million)

5.2 Type segment analysis 2020 - 2024

Historic Market Size - Type Segment 2020 - 2024 ($ million)

5.3 Technology segment analysis 2020 - 2024

Historic Market Size - Technology Segment 2020 - 2024 ($ million)

5.4 End-user segment analysis 2020 - 2024

Historic Market Size - End-user Segment 2020 - 2024 ($ million)

5.5 Geography segment analysis 2020 - 2024

Historic Market Size - Geography Segment 2020 - 2024 ($ million)

5.6 Country segment analysis 2020 - 2024

Historic Market Size - Country Segment 2020 - 2024 ($ million)

6. Qualitative Analysis

6.1 Impact of AI on Global Green Steel Market

6.2 Impact of geopolitical conflicts on Global Green Steel Market

7. Five Forces Analysis

7.1 Five forces summary

Five forces analysis - Comparison between 2025 and 2030

7.2 Bargaining power of buyers

Bargaining power of buyers - Impact of key factors 2025 and 2030

7.3 Bargaining power of suppliers

Bargaining power of suppliers - Impact of key factors in 2025 and 2030

7.4 Threat of new entrants

Threat of new entrants - Impact of key factors in 2025 and 2030

7.5 Threat of substitutes

Threat of substitutes - Impact of key factors in 2025 and 2030

7.6 Threat of rivalry

Threat of rivalry - Impact of key factors in 2025 and 2030

7.7 Market condition

Chart on Market condition - Five forces 2025 and 2030

8. Market Segmentation by Type

8.1 Market segments

Chart on Type - Market share 2025-2030 (%)
Data Table on Type - Market share 2025-2030 (%)

8.2 Comparison by Type

Chart on Comparison by Type
Data Table on Comparison by Type

8.3 Recycled steel - Market size and forecast 2025-2030

Chart on Recycled steel - Market size and forecast 2025-2030 ($ million)
Data Table on Recycled steel - Market size and forecast 2025-2030 ($ million)
Chart on Recycled steel - Year-over-year growth 2025-2030 (%)
Data Table on Recycled steel - Year-over-year growth 2025-2030 (%)

8.4 Low-carbon steel - Market size and forecast 2025-2030

Chart on Low-carbon steel - Market size and forecast 2025-2030 ($ million)
Data Table on Low-carbon steel - Market size and forecast 2025-2030 ($ million)
Chart on Low-carbon steel - Year-over-year growth 2025-2030 (%)
Data Table on Low-carbon steel - Year-over-year growth 2025-2030 (%)

8.5 High-strength low-alloy steel - Market size and forecast 2025-2030

Chart on High-strength low-alloy steel - Market size and forecast 2025-2030 ($ million)
Data Table on High-strength low-alloy steel - Market size and forecast 2025-2030 ($ million)
Chart on High-strength low-alloy steel - Year-over-year growth 2025-2030 (%)
Data Table on High-strength low-alloy steel - Year-over-year growth 2025-2030 (%)

8.6 Market opportunity by Type

Market opportunity by Type ($ million)
Data Table on Market opportunity by Type ($ million)

9. Market Segmentation by Technology

9.1 Market segments

Chart on Technology - Market share 2025-2030 (%)
Data Table on Technology - Market share 2025-2030 (%)

9.2 Comparison by Technology

Chart on Comparison by Technology
Data Table on Comparison by Technology

9.3 Electric arc furnace - Market size and forecast 2025-2030

Chart on Electric arc furnace - Market size and forecast 2025-2030 ($ million)
Data Table on Electric arc furnace - Market size and forecast 2025-2030 ($ million)
Chart on Electric arc furnace - Year-over-year growth 2025-2030 (%)
Data Table on Electric arc furnace - Year-over-year growth 2025-2030 (%)

9.4 Hydrogen-based direct reduced iron - Market size and forecast 2025-2030

Chart on Hydrogen-based direct reduced iron - Market size and forecast 2025-2030 ($ million)
Data Table on Hydrogen-based direct reduced iron - Market size and forecast 2025-2030 ($ million)
Chart on Hydrogen-based direct reduced iron - Year-over-year growth 2025-2030 (%)
Data Table on Hydrogen-based direct reduced iron - Year-over-year growth 2025-2030 (%)

9.5 Molten oxide electrolysis - Market size and forecast 2025-2030

Chart on Molten oxide electrolysis - Market size and forecast 2025-2030 ($ million)
Data Table on Molten oxide electrolysis - Market size and forecast 2025-2030 ($ million)
Chart on Molten oxide electrolysis - Year-over-year growth 2025-2030 (%)
Data Table on Molten oxide electrolysis - Year-over-year growth 2025-2030 (%)

9.6 Others - Market size and forecast 2025-2030

Chart on Others - Market size and forecast 2025-2030 ($ million)
Data Table on Others - Market size and forecast 2025-2030 ($ million)
Chart on Others - Year-over-year growth 2025-2030 (%)
Data Table on Others - Year-over-year growth 2025-2030 (%)

9.7 Market opportunity by Technology

Market opportunity by Technology ($ million)
Data Table on Market opportunity by Technology ($ million)

10. Market Segmentation by End-user

10.1 Market segments

Chart on End-user - Market share 2025-2030 (%)
Data Table on End-user - Market share 2025-2030 (%)

10.2 Comparison by End-user

Chart on Comparison by End-user
Data Table on Comparison by End-user

10.3 Automotive - Market size and forecast 2025-2030

Chart on Automotive - Market size and forecast 2025-2030 ($ million)
Data Table on Automotive - Market size and forecast 2025-2030 ($ million)
Chart on Automotive - Year-over-year growth 2025-2030 (%)
Data Table on Automotive - Year-over-year growth 2025-2030 (%)

10.4 Construction - Market size and forecast 2025-2030

Chart on Construction - Market size and forecast 2025-2030 ($ million)
Data Table on Construction - Market size and forecast 2025-2030 ($ million)
Chart on Construction - Year-over-year growth 2025-2030 (%)
Data Table on Construction - Year-over-year growth 2025-2030 (%)

10.5 Industrial equipment and machinery - Market size and forecast 2025-2030

Chart on Industrial equipment and machinery - Market size and forecast 2025-2030 ($ million)
Data Table on Industrial equipment and machinery - Market size and forecast 2025-2030 ($ million)
Chart on Industrial equipment and machinery - Year-over-year growth 2025-2030 (%)
Data Table on Industrial equipment and machinery - Year-over-year growth 2025-2030 (%)

10.6 Energy and power - Market size and forecast 2025-2030

Chart on Energy and power - Market size and forecast 2025-2030 ($ million)
Data Table on Energy and power - Market size and forecast 2025-2030 ($ million)
Chart on Energy and power - Year-over-year growth 2025-2030 (%)
Data Table on Energy and power - Year-over-year growth 2025-2030 (%)

10.7 Others - Market size and forecast 2025-2030

Chart on Others - Market size and forecast 2025-2030 ($ million)
Data Table on Others - Market size and forecast 2025-2030 ($ million)
Chart on Others - Year-over-year growth 2025-2030 (%)
Data Table on Others - Year-over-year growth 2025-2030 (%)

10.8 Market opportunity by End-user

Market opportunity by End-user ($ million)
Data Table on Market opportunity by End-user ($ million)

11. Customer Landscape

11.1 Customer landscape overview

Analysis of price sensitivity, lifecycle, customer purchase basket, adoption rates, and purchase criteria

12. Geographic Landscape

12.1 Geographic segmentation

Chart on Market share by geography 2025-2030 (%)
Data Table on Market share by geography 2025-2030 (%)

12.2 Geographic comparison

Chart on Geographic comparison
Data Table on Geographic comparison

12.3 Europe - Market size and forecast 2025-2030

Chart on Europe - Market size and forecast 2025-2030 ($ million)
Data Table on Europe - Market size and forecast 2025-2030 ($ million)
Chart on Europe - Year-over-year growth 2025-2030 (%)
Data Table on Europe - Year-over-year growth 2025-2030 (%)
Chart on Regional Comparison - Europe
Data Table on Regional Comparison - Europe

12.3.1 Sweden - Market size and forecast 2025-2030

Chart on Sweden - Market size and forecast 2025-2030 ($ million)
Data Table on Sweden - Market size and forecast 2025-2030 ($ million)
Chart on Sweden - Year-over-year growth 2025-2030 (%)
Data Table on Sweden - Year-over-year growth 2025-2030 (%)

12.3.2 Germany - Market size and forecast 2025-2030

Chart on Germany - Market size and forecast 2025-2030 ($ million)
Data Table on Germany - Market size and forecast 2025-2030 ($ million)
Chart on Germany - Year-over-year growth 2025-2030 (%)
Data Table on Germany - Year-over-year growth 2025-2030 (%)

12.3.3 UK - Market size and forecast 2025-2030

Chart on UK - Market size and forecast 2025-2030 ($ million)
Data Table on UK - Market size and forecast 2025-2030 ($ million)
Chart on UK - Year-over-year growth 2025-2030 (%)
Data Table on UK - Year-over-year growth 2025-2030 (%)

12.3.4 France - Market size and forecast 2025-2030

Chart on France - Market size and forecast 2025-2030 ($ million)
Data Table on France - Market size and forecast 2025-2030 ($ million)
Chart on France - Year-over-year growth 2025-2030 (%)
Data Table on France - Year-over-year growth 2025-2030 (%)

12.3.5 Italy - Market size and forecast 2025-2030

Chart on Italy - Market size and forecast 2025-2030 ($ million)
Data Table on Italy - Market size and forecast 2025-2030 ($ million)
Chart on Italy - Year-over-year growth 2025-2030 (%)
Data Table on Italy - Year-over-year growth 2025-2030 (%)

12.3.6 Spain - Market size and forecast 2025-2030

Chart on Spain - Market size and forecast 2025-2030 ($ million)
Data Table on Spain - Market size and forecast 2025-2030 ($ million)
Chart on Spain - Year-over-year growth 2025-2030 (%)
Data Table on Spain - Year-over-year growth 2025-2030 (%)

12.4 APAC - Market size and forecast 2025-2030

Chart on APAC - Market size and forecast 2025-2030 ($ million)
Data Table on APAC - Market size and forecast 2025-2030 ($ million)
Chart on APAC - Year-over-year growth 2025-2030 (%)
Data Table on APAC - Year-over-year growth 2025-2030 (%)
Chart on Regional Comparison - APAC
Data Table on Regional Comparison - APAC

12.4.1 China - Market size and forecast 2025-2030

Chart on China - Market size and forecast 2025-2030 ($ million)
Data Table on China - Market size and forecast 2025-2030 ($ million)
Chart on China - Year-over-year growth 2025-2030 (%)
Data Table on China - Year-over-year growth 2025-2030 (%)

12.4.2 India - Market size and forecast 2025-2030

Chart on India - Market size and forecast 2025-2030 ($ million)
Data Table on India - Market size and forecast 2025-2030 ($ million)
Chart on India - Year-over-year growth 2025-2030 (%)
Data Table on India - Year-over-year growth 2025-2030 (%)

12.4.3 Japan - Market size and forecast 2025-2030

Chart on Japan - Market size and forecast 2025-2030 ($ million)
Data Table on Japan - Market size and forecast 2025-2030 ($ million)
Chart on Japan - Year-over-year growth 2025-2030 (%)
Data Table on Japan - Year-over-year growth 2025-2030 (%)

12.4.4 South Korea - Market size and forecast 2025-2030

Chart on South Korea - Market size and forecast 2025-2030 ($ million)
Data Table on South Korea - Market size and forecast 2025-2030 ($ million)
Chart on South Korea - Year-over-year growth 2025-2030 (%)
Data Table on South Korea - Year-over-year growth 2025-2030 (%)

12.4.5 Australia - Market size and forecast 2025-2030

Chart on Australia - Market size and forecast 2025-2030 ($ million)
Data Table on Australia - Market size and forecast 2025-2030 ($ million)
Chart on Australia - Year-over-year growth 2025-2030 (%)
Data Table on Australia - Year-over-year growth 2025-2030 (%)

12.4.6 Indonesia - Market size and forecast 2025-2030

Chart on Indonesia - Market size and forecast 2025-2030 ($ million)
Data Table on Indonesia - Market size and forecast 2025-2030 ($ million)
Chart on Indonesia - Year-over-year growth 2025-2030 (%)
Data Table on Indonesia - Year-over-year growth 2025-2030 (%)

12.5 North America - Market size and forecast 2025-2030

Chart on North America - Market size and forecast 2025-2030 ($ million)
Data Table on North America - Market size and forecast 2025-2030 ($ million)
Chart on North America - Year-over-year growth 2025-2030 (%)
Data Table on North America - Year-over-year growth 2025-2030 (%)
Chart on Regional Comparison - North America
Data Table on Regional Comparison - North America

12.5.1 US - Market size and forecast 2025-2030

Chart on US - Market size and forecast 2025-2030 ($ million)
Data Table on US - Market size and forecast 2025-2030 ($ million)
Chart on US - Year-over-year growth 2025-2030 (%)
Data Table on US - Year-over-year growth 2025-2030 (%)

12.5.2 Canada - Market size and forecast 2025-2030

Chart on Canada - Market size and forecast 2025-2030 ($ million)
Data Table on Canada - Market size and forecast 2025-2030 ($ million)
Chart on Canada - Year-over-year growth 2025-2030 (%)
Data Table on Canada - Year-over-year growth 2025-2030 (%)

12.5.3 Mexico - Market size and forecast 2025-2030

Chart on Mexico - Market size and forecast 2025-2030 ($ million)
Data Table on Mexico - Market size and forecast 2025-2030 ($ million)
Chart on Mexico - Year-over-year growth 2025-2030 (%)
Data Table on Mexico - Year-over-year growth 2025-2030 (%)

12.6 South America - Market size and forecast 2025-2030

Chart on South America - Market size and forecast 2025-2030 ($ million)
Data Table on South America - Market size and forecast 2025-2030 ($ million)
Chart on South America - Year-over-year growth 2025-2030 (%)
Data Table on South America - Year-over-year growth 2025-2030 (%)
Chart on Regional Comparison - South America
Data Table on Regional Comparison - South America

12.6.1 Brazil - Market size and forecast 2025-2030

Chart on Brazil - Market size and forecast 2025-2030 ($ million)
Data Table on Brazil - Market size and forecast 2025-2030 ($ million)
Chart on Brazil - Year-over-year growth 2025-2030 (%)
Data Table on Brazil - Year-over-year growth 2025-2030 (%)

12.6.2 Argentina - Market size and forecast 2025-2030

Chart on Argentina - Market size and forecast 2025-2030 ($ million)
Data Table on Argentina - Market size and forecast 2025-2030 ($ million)
Chart on Argentina - Year-over-year growth 2025-2030 (%)
Data Table on Argentina - Year-over-year growth 2025-2030 (%)

12.6.3 Colombia - Market size and forecast 2025-2030

Chart on Colombia - Market size and forecast 2025-2030 ($ million)
Data Table on Colombia - Market size and forecast 2025-2030 ($ million)
Chart on Colombia - Year-over-year growth 2025-2030 (%)
Data Table on Colombia - Year-over-year growth 2025-2030 (%)

12.7 Middle East and Africa - Market size and forecast 2025-2030

Chart on Middle East and Africa - Market size and forecast 2025-2030 ($ million)
Data Table on Middle East and Africa - Market size and forecast 2025-2030 ($ million)
Chart on Middle East and Africa - Year-over-year growth 2025-2030 (%)
Data Table on Middle East and Africa - Year-over-year growth 2025-2030 (%)
Chart on Regional Comparison - Middle East and Africa
Data Table on Regional Comparison - Middle East and Africa

12.7.1 Saudi Arabia - Market size and forecast 2025-2030

Chart on Saudi Arabia - Market size and forecast 2025-2030 ($ million)
Data Table on Saudi Arabia - Market size and forecast 2025-2030 ($ million)
Chart on Saudi Arabia - Year-over-year growth 2025-2030 (%)
Data Table on Saudi Arabia - Year-over-year growth 2025-2030 (%)

12.7.2 UAE - Market size and forecast 2025-2030

Chart on UAE - Market size and forecast 2025-2030 ($ million)
Data Table on UAE - Market size and forecast 2025-2030 ($ million)
Chart on UAE - Year-over-year growth 2025-2030 (%)
Data Table on UAE - Year-over-year growth 2025-2030 (%)

12.7.3 Turkey - Market size and forecast 2025-2030

Chart on Turkey - Market size and forecast 2025-2030 ($ million)
Data Table on Turkey - Market size and forecast 2025-2030 ($ million)
Chart on Turkey - Year-over-year growth 2025-2030 (%)
Data Table on Turkey - Year-over-year growth 2025-2030 (%)

12.7.4 Egypt - Market size and forecast 2025-2030

Chart on Egypt - Market size and forecast 2025-2030 ($ million)
Data Table on Egypt - Market size and forecast 2025-2030 ($ million)
Chart on Egypt - Year-over-year growth 2025-2030 (%)
Data Table on Egypt - Year-over-year growth 2025-2030 (%)

12.7.5 South Africa - Market size and forecast 2025-2030

Chart on South Africa - Market size and forecast 2025-2030 ($ million)
Data Table on South Africa - Market size and forecast 2025-2030 ($ million)
Chart on South Africa - Year-over-year growth 2025-2030 (%)
Data Table on South Africa - Year-over-year growth 2025-2030 (%)

12.8 Market opportunity by geography

Market opportunity by geography ($ million)
Data Tables on Market opportunity by geography ($ million)

13. Drivers, Challenges, and Opportunity

13.1 Market drivers

Stringent environmental regulations and carbon pricing initiatives
Acceleration of corporate decarbonization targets in downstream industries
Advancements in renewable energy integration and green hydrogen infrastructure

13.2 Market challenges

Substantial capital investment requirements and high operational costs
Infrastructure gaps in green hydrogen supply and renewable energy grids
Scarcity of high-grade iron ore and quality steel scrap

13.3 Impact of drivers and challenges

Impact of drivers and challenges in 2025 and 2030

13.4 Market opportunities

Proliferation of cross-sector hydrogen synergies and industrial hubs
Implementation of advanced digitalization and blockchain for supply chain transparency
Evolutionary focus on circularity and high-precision scrap beneficiation

14. Competitive Landscape

14.1 Overview

14.2

Overview on criticality of inputs and factors of differentiation

14.3 Landscape disruption

Overview on factors of disruption

14.4 Industry risks

Impact of key risks on business

15. Competitive Analysis

15.1 Companies profiled

Companies covered

15.2 Company ranking index

15.3 Market positioning of companies

Matrix on companies position and classification

15.4 ArcelorMittal S.A.

ArcelorMittal S.A. - Overview
ArcelorMittal S.A. - Business segments
ArcelorMittal S.A. - Key offerings
ArcelorMittal S.A. - Segment focus
SWOT

15.5 BlueScope Steel Ltd.

BlueScope Steel Ltd. - Overview
BlueScope Steel Ltd. - Product / Service
BlueScope Steel Ltd. - Key offerings
SWOT

15.6 China BaoWu Steel Group Corp.

China BaoWu Steel Group Corp. - Overview
China BaoWu Steel Group Corp. - Product / Service
China BaoWu Steel Group Corp. - Key offerings
SWOT

15.7 Cleveland Cliffs Inc.

Cleveland Cliffs Inc. - Overview
Cleveland Cliffs Inc. - Product / Service
Cleveland Cliffs Inc. - Key offerings
SWOT

15.8 HBIS Group Co. Ltd.

HBIS Group Co. Ltd. - Overview
HBIS Group Co. Ltd. - Product / Service
HBIS Group Co. Ltd. - Key offerings
SWOT

15.9 Hyundai Steel Co.

Hyundai Steel Co. - Overview
Hyundai Steel Co. - Product / Service
Hyundai Steel Co. - Key offerings
SWOT

15.10 JFE Holdings Inc.

JFE Holdings Inc. - Overview
JFE Holdings Inc. - Business segments
JFE Holdings Inc. - Key offerings
JFE Holdings Inc. - Segment focus
SWOT

15.11 LIBERTY Steel Group

LIBERTY Steel Group - Overview
LIBERTY Steel Group - Product / Service
LIBERTY Steel Group - Key offerings
SWOT

15.12 Nippon Steel Corp.

Nippon Steel Corp. - Overview
Nippon Steel Corp. - Business segments
Nippon Steel Corp. - Key offerings
Nippon Steel Corp. - Segment focus
SWOT

15.13 Nucor Corp.

Nucor Corp. - Overview
Nucor Corp. - Business segments
Nucor Corp. - Key offerings
Nucor Corp. - Segment focus
SWOT

15.14 POSCO Co. Ltd.

POSCO Co. Ltd. - Overview
POSCO Co. Ltd. - Business segments
POSCO Co. Ltd. - Key offerings
POSCO Co. Ltd. - Segment focus
SWOT

15.15 SSAB AB

SSAB AB - Overview
SSAB AB - Business segments
SSAB AB - Key offerings
SSAB AB - Segment focus
SWOT

15.16 Tata Steel Ltd.

Tata Steel Ltd. - Overview
Tata Steel Ltd. - Business segments
Tata Steel Ltd. - Key offerings
Tata Steel Ltd. - Segment focus
SWOT

15.17 thyssenkrupp Steel Europe AG

thyssenkrupp Steel Europe AG - Overview
thyssenkrupp Steel Europe AG - Product / Service
thyssenkrupp Steel Europe AG - Key offerings
SWOT

15.18 United States Steel Corp.

United States Steel Corp. - Overview
United States Steel Corp. - Business segments
United States Steel Corp. - Key offerings
United States Steel Corp. - Segment focus
SWOT

16. Appendix

16.1 Scope of the report

Market definition
Objectives
Notes and caveats

16.2 Inclusions and exclusions checklist

Inclusions checklist
Exclusions checklist

16.3 Currency conversion rates for US$

16.4 Research methodology

16.5 Data procurement

Information sources

16.6 Data validation

16.7 Validation techniques employed for market sizing

16.8 Data synthesis

16.9 360 degree market analysis

16.10 List of abbreviations

Research Methodology

Technavio presents a detailed picture of the market by way of study, synthesis, and summation of data from multiple sources. The analysts have presented the various facets of the market with a particular focus on identifying the key industry influencers. The data thus presented is comprehensive, reliable, and the result of extensive research, both primary and secondary.

INFORMATION SOURCES

Primary sources

  • Manufacturers and suppliers
  • Channel partners
  • Industry experts
  • Strategic decision makers

Secondary sources

  • Industry journals and periodicals
  • Government data
  • Financial reports of key industry players
  • Historical data
  • Press releases

DATA ANALYSIS

Data Synthesis

  • Collation of data
  • Estimation of key figures
  • Analysis of derived insights

Data Validation

  • Triangulation with data models
  • Reference against proprietary databases
  • Corroboration with industry experts

REPORT WRITING

Qualitative

  • Market drivers
  • Market challenges
  • Market trends
  • Five forces analysis

Quantitative

  • Market size and forecast
  • Market segmentation
  • Geographical insights
  • Competitive landscape

Interested in this report?

Get your sample now to see our research methodology and insights!

Download Now

Frequently Asked Questions

Green Steel market growth will increase by USD 29191.9 million during 2026-2030.

The Green Steel market is expected to grow at a CAGR of 43.8% during 2026-2030.

Green Steel market is segmented by Type (Recycled steel, Low-carbon steel, High-strength low-alloy steel) Technology (Electric arc furnace, Hydrogen-based direct reduced iron, Molten oxide electrolysis, Others) End-user (Automotive, Construction, Industrial equipment and machinery, Energy and power, Others)

ArcelorMittal S.A., BlueScope Steel Ltd., Boston Electrometallurgical Corp, China BaoWu Steel Group Corp., Cleveland Cliffs Inc., Gerdau SA, HBIS Group Co. Ltd., Hyundai Steel Co., JFE Holdings Inc., LIBERTY Steel Group, Nippon Steel Corp., Nucor Corp., Outokumpu Oyj, POSCO Co. Ltd., Salzgitter AG, SSAB AB, Tata Steel Ltd., thyssenkrupp Steel Europe AG, United States Steel Corp., voestalpine AG are a few of the key vendors in the Green Steel market.

Europe will register the highest growth rate of 44.2% among the other regions. Therefore, the Green Steel market in Europe is expected to garner significant business opportunities for the vendors during the forecast period.

Sweden, Germany, UK, France, Italy, Spain, China, India, Japan, South Korea, Australia, Indonesia, US, Canada, Mexico, Brazil, Argentina, Colombia, Saudi Arabia, UAE, Turkey, Egypt, South Africa

  • Stringent environmental regulations and carbon pricing initiatives is the driving factor this market.

The Green Steel market vendors should focus on grabbing business opportunities from the Type segment as it accounted for the largest market share in the base year.
RIA - Research AI Assistant
Ask RIA