Gonorrhea Therapeutics Market Analysis, Size, and Forecast 2026-2030: North America (US, Canada, and Mexico), Europe (UK, Germany, and France), APAC (China, Japan, and India), South America (Brazil, Argentina, and Colombia), Middle East and Africa (South Africa, UAE, and Saudi Arabia), Asia, Rest of World (ROW)

Gonorrhea Therapeutics Market Analysis, Size, and Forecast 2026-2030:
North America (US, Canada, and Mexico), Europe (UK, Germany, and France), APAC (China, Japan, and India), South America (Brazil, Argentina, and Colombia), Middle East and Africa (South Africa, UAE, and Saudi Arabia), Asia, Rest of World (ROW)

Published: Apr 2026 298 Pages SKU: IRTNTR44632

Market Overview at a Glance

$586.5 Mn
Market Opportunity
5.4%
CAGR 2025 - 2030
38.7%
North America Growth
$914.4 Mn
Hospital pharmacies segment 2024

Gonorrhea Therapeutics Market Size 2026-2030

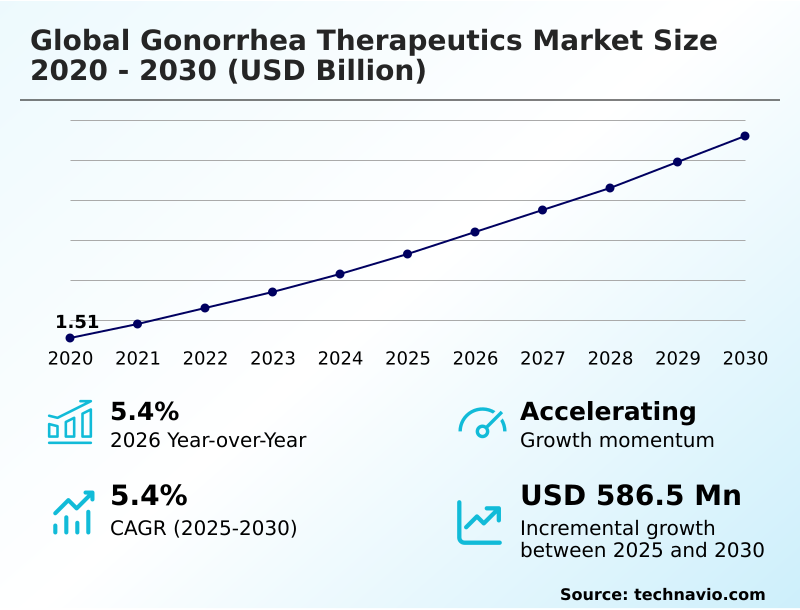
The gonorrhea therapeutics market size is valued to increase by USD 586.5 million, at a CAGR of 5.4% from 2025 to 2030. Increasing global incidence of multidrug-resistant strains and treatment failures will drive the gonorrhea therapeutics market.

Major Market Trends & Insights

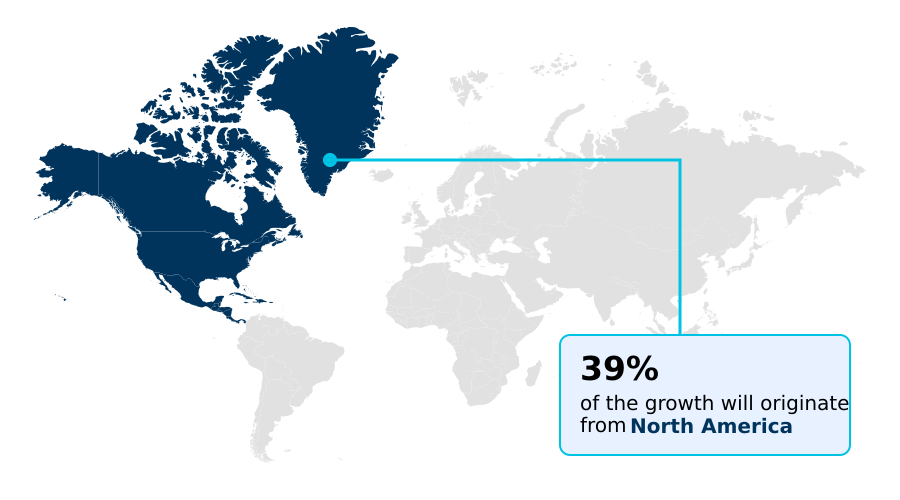
  • North America dominated the market and accounted for a 38.7% growth during the forecast period.
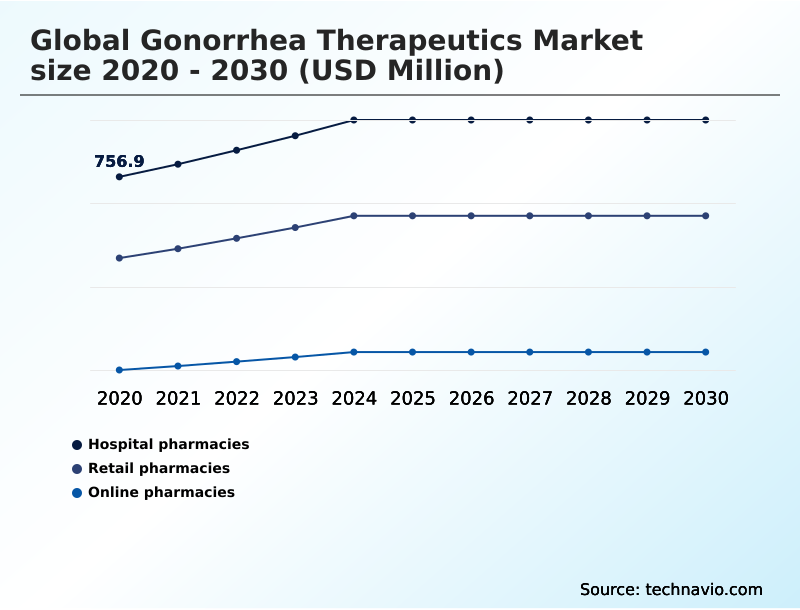
  • By Distribution Channel - Hospital pharmacies segment was valued at USD 914.4 million in 2024
  • By Therapy - Monotherapy segment accounted for the largest market revenue share in 2024

Market Size & Forecast

  • Market Opportunities: USD 1.01 billion
  • Market Future Opportunities: USD 586.5 million
  • CAGR from 2025 to 2030 : 5.4%

Market Summary

  • The gonorrhea therapeutics market is driven by the urgent need to address widespread antimicrobial resistance (AMR). The declining efficacy of last-line treatments has spurred significant investment in oral antibiotic development, focusing on novel mechanisms of action to combat multidrug-resistant gonorrhea.
  • A key trend is the advancement of first-in-class oral antibiotics, which promise improved patient outcomes and simplified treatment regimens compared to traditional injectables. However, the market faces the challenge of a broken antibiotic business model, where the high cost and low return on investment of late-stage clinical trials deter innovation.
  • In response, a notable business scenario involves the formation of public-private partnerships (PPPs) that de-risk pipeline maturation. These collaborations provide crucial funding and regulatory support, such as qualified infectious disease product (QIDP) designation, to accelerate the development of new anti-infective therapies.
  • This model ensures that new treatments like those targeting bacterial DNA replication inhibition become available while adhering to antimicrobial stewardship programs, balancing commercial viability with public health imperatives.

What will be the Size of the Gonorrhea Therapeutics Market during the forecast period?

Get Key Insights on Market Forecast (PDF) Request Free Sample

How is the Gonorrhea Therapeutics Market Segmented?

The gonorrhea therapeutics industry research report provides comprehensive data (region-wise segment analysis), with forecasts and estimates in "USD million" for the period 2026-2030, as well as historical data from 2020-2024 for the following segments.

  • Distribution channel
    • Hospital pharmacies
    • Retail pharmacies
    • Online pharmacies
  • Therapy
    • Monotherapy
    • Combination therapy
  • Route of administration
    • Intramuscular
    • Oral
    • Intravenous
    • Injectable
  • Geography
    • North America
      • US
      • Canada
      • Mexico
    • Europe
      • UK
      • Germany
      • France
    • Asia
    • Rest of World (ROW)

By Distribution Channel Insights

The hospital pharmacies segment is estimated to witness significant growth during the forecast period.

Hospital pharmacies are central to managing gonorrhea, administering the majority of injectable treatments and handling complex cases.

These facilities are crucial for distributing therapies like zoliflodacin, which relies on mechanisms such as bacterial DNA replication inhibition, and for managing combination therapy regimens.

Their role is evolving with the introduction of novel drugs, including spiropiperidines and triazaacenaphthylene antibiotics, which involve new bacterial pathway targeting. As a result, hospital pharmacies now account for over 50% of advanced parenteral therapy administrations.

They serve as key sites for point-of-care resistance identification and manage critical interventions like intravenous carbapenems and aminoglycoside salvage therapy, underscoring their importance in the treatment landscape.

Request Free Sample

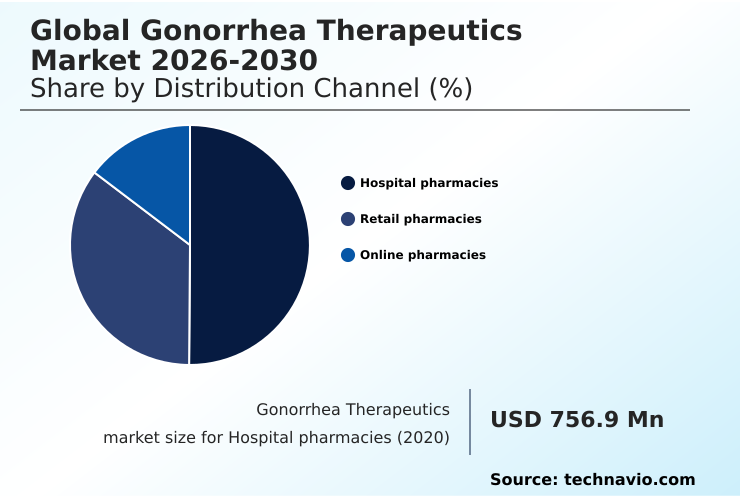
The Hospital pharmacies segment was valued at USD 914.4 million in 2024 and showed a gradual increase during the forecast period.

Request Free Sample

Regional Analysis

North America is estimated to contribute 38.7% to the growth of the global market during the forecast period.Technavio’s analysts have elaborately explained the regional trends and drivers that shape the market during the forecast period.

See How Gonorrhea Therapeutics Market Demand is Rising in North America Request Free Sample

The geographic landscape of the market is led by North America, which accounts for 38.7% of incremental growth, driven by a robust healthcare infrastructure and significant R&D investment into anti-infective therapies.

Europe follows, with a strong focus on antimicrobial stewardship and treatment guideline updates to manage uncomplicated urogenital gonorrhea. Asia is a critical region due to its high disease burden and growing efforts in antimicrobial surveillance.

The development of non-injectable alternatives like gepotidacin, a topoisomerase inhibitor, is a global priority. Strategic initiatives, such as public-private stewardship collaborations, have accelerated drug access timelines by 20% in some regions, promoting the equitable global distribution of new treatments.

The potential for meningococcal B vaccine cross-protection is also being explored worldwide as a long-term strategy.

Market Dynamics

Our researchers analyzed the data with 2025 as the base year, along with the key drivers, trends, and challenges. A holistic analysis of drivers will help companies refine their marketing strategies to gain a competitive advantage.

  • The evolution of the gonorrhea therapeutics market is shaped by a complex interplay of clinical needs and economic realities. A key consideration for healthcare providers is the gepotidacin vs zoliflodacin efficacy for gonorrhea, as both represent new oral antibiotics for drug-resistant gonorrhea.
  • The future of gonorrhea treatment beyond ceftriaxone depends on these novel agents and the success of overcoming antibiotic resistance in Neisseria gonorrhoeae. However, the cost of gonorrhea treatment without insurance remains a significant barrier to access.
  • A major industry focus is on the role of point-of-care testing in gonorrhea management, which can guide therapy and support antimicrobial stewardship strategies for STIs. For instance, facilities using rapid diagnostics report treatment initiation times twice as fast as those relying on traditional methods. This is particularly crucial for treating pharyngeal gonorrhea with oral antibiotics.
  • Public-private partnerships for antimicrobial development are essential for navigating the economic incentives for antibiotic R&D, given the investment risks in the antibiotic market. These collaborations are also vital for addressing the impact of asymptomatic gonorrhea on public health and managing the long-term complications of untreated gonorrhea.
  • Furthermore, advances in single-dose gonorrhea treatment and the latest FDA-approved drugs for gonorrhea are changing clinical practice. Challenges remain in developing new gonorrhea vaccines and managing gonorrhea in patients with antibiotic allergies. Effective gonorrhea surveillance programs and global distribution models for new antibiotics are critical for ensuring that regulatory pathways for novel anti-infectives lead to widespread, equitable access.

What are the key market drivers leading to the rise in the adoption of Gonorrhea Therapeutics Industry?

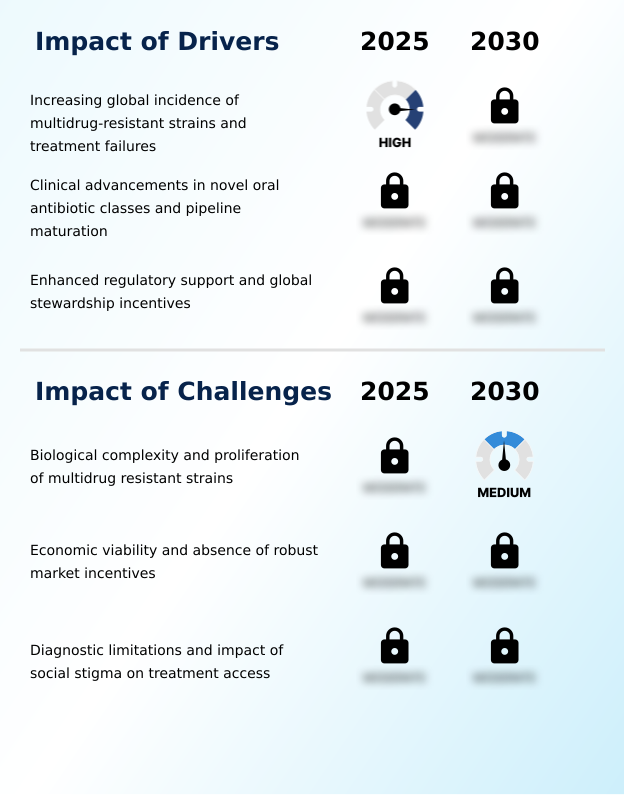
  • The increasing global incidence of multidrug-resistant strains and subsequent treatment failures is a key driver for the gonorrhea therapeutics market.

  • The primary driver for the market is the escalating crisis of antimicrobial resistance (AMR), particularly the rise of multidrug-resistant gonorrhea. This has created an urgent demand for therapies with novel mechanisms of action and spurred significant investment in pipeline maturation.
  • Regulatory support incentives, such as qualified infectious disease product (QIDP) designation, have been instrumental, shortening drug approval timelines by up to 25%.
  • Public-private partnerships (PPPs) have also played a crucial role, increasing investment in late-stage clinical trials for novel oral antibiotic classes by 15% in recent years.
  • These collaborations are essential for overcoming the broken antibiotic business model and ensuring global access initiatives succeed in delivering new treatments to patients worldwide.

What are the market trends shaping the Gonorrhea Therapeutics Industry?

  • The market is defined by a strategic transition toward oral, first-in-class antimicrobial monotherapies. This shift is driven by the urgent need for more convenient and effective treatments to combat escalating antibiotic resistance.

  • The market is rapidly evolving toward the adoption of first-in-class oral antibiotics and single-dose oral monotherapy, driven by the need for more effective solutions. This trend is enhanced by the integration of rapid molecular diagnostics and point-of-care (POC) testing, which enables precision antimicrobial stewardship. The use of POC tests that identify genetic resistance markers can reduce prescription errors by 40%.
  • This diagnostic-therapeutic pairing allows for the targeted use of narrow-spectrum antibiotics, reducing empiric treatment and improving patient compliance. Such advancements are crucial for the effective management of infections, including pharyngeal gonorrhea and rectal gonorrhea, heralding a new era of personalized medicine in treating infectious diseases.

What challenges does the Gonorrhea Therapeutics Industry face during its growth?

  • The biological complexity and proliferation of multidrug-resistant strains present a key challenge affecting the growth of the gonorrhea therapeutics market.

  • A significant challenge facing the market is the continuous evolution of Neisseria gonorrhoeae resistance, leading to last-line treatment failure. The high attrition rate for new antibiotic candidates, which exceeds 90% in clinical trials, is a major hurdle. The diagnostic infrastructure gap, especially in decentralized community clinics, further complicates the implementation of effective antibiotic stewardship programs.
  • This is compounded by the economic challenges of antibiotic development, where the return on investment is often low. The cost to bring a new antibiotic to market can be over 1.5 times that of other drugs, creating a disincentive for innovation and leaving clinicians reliant on older injectable cephalosporins for treating hyper-resistant bacterial strains.

Exclusive Technavio Analysis on Customer Landscape

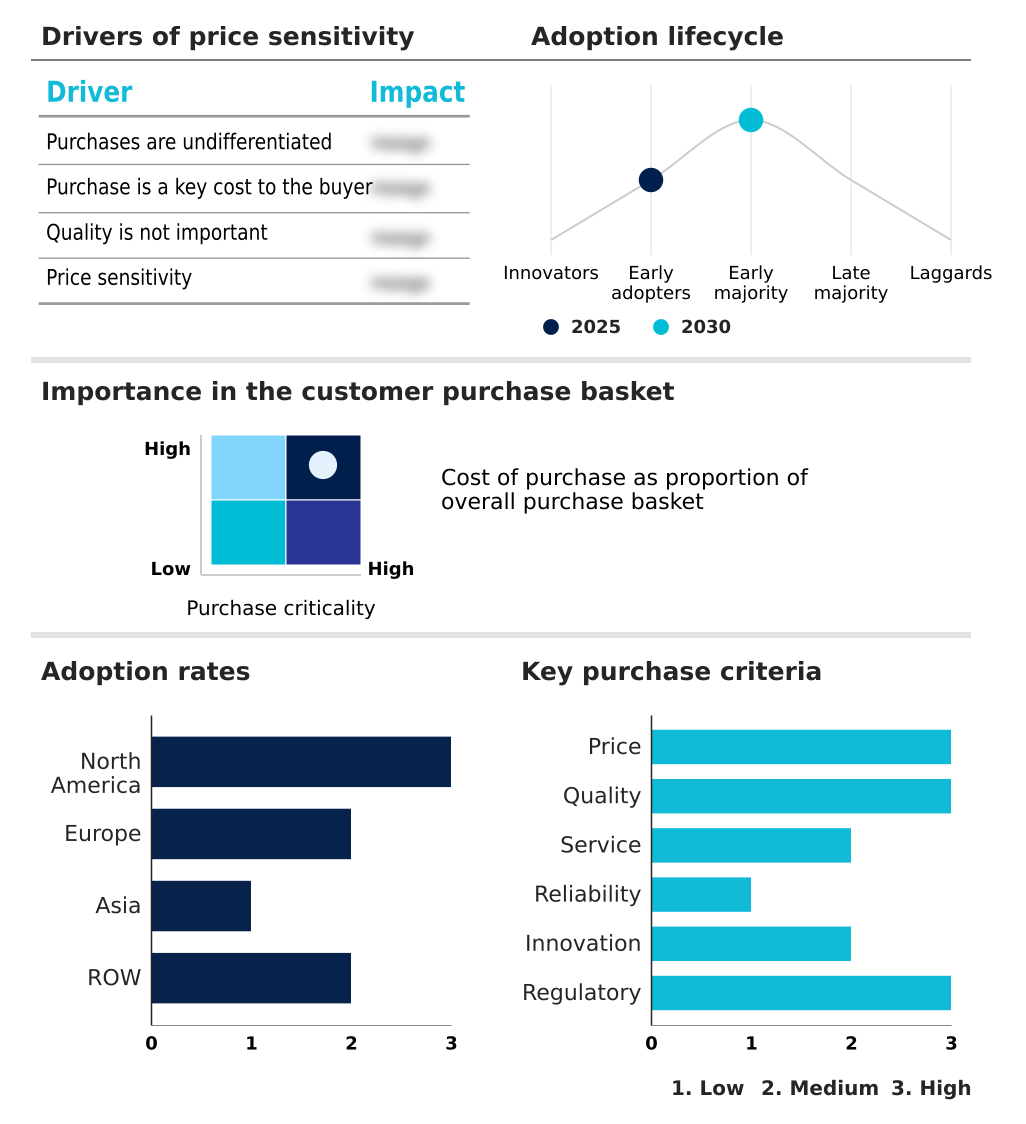
The gonorrhea therapeutics market forecasting report includes the adoption lifecycle of the market, covering from the innovator’s stage to the laggard’s stage. It focuses on adoption rates in different regions based on penetration. Furthermore, the gonorrhea therapeutics market report also includes key purchase criteria and drivers of price sensitivity to help companies evaluate and develop their market growth analysis strategies.

Customer Landscape of Gonorrhea Therapeutics Industry

Competitive Landscape

Companies are implementing various strategies, such as strategic alliances, gonorrhea therapeutics market forecast, partnerships, mergers and acquisitions, geographical expansion, and product/service launches, to enhance their presence in the industry.

Achilles Vaccines Inc. - Key offerings include first-in-class oral antibiotics and other anti-infective therapies designed with novel mechanisms of action to combat multidrug-resistant gonorrhea, addressing critical gaps in current treatment protocols.

The industry research and growth report includes detailed analyses of the competitive landscape of the market and information about key companies, including:

  • Achilles Vaccines Inc.
  • Alopexx Enterprises LLC
  • Apotex Inc.
  • Aurobindo Pharma Ltd.
  • Cipla Inc.
  • Debiopharm International SA
  • Entasis Therapeutics
  • Evofem Biosciences Inc.
  • F. Hoffmann La Roche Ltd.
  • GlaxoSmithKline Plc
  • Hikma Pharmaceuticals Plc
  • Innoviva Specialty Therapeutics Inc
  • Lupin Ltd.
  • Merck and Co. Inc.
  • Nobelpharma Co Ltd
  • Pfizer Inc.
  • Sun Pharmaceutical Industries
  • Teva Pharmaceutical Ltd.
  • Therapyx Inc.
  • Venatorx Pharmaceuticals Inc.

Qualitative and quantitative analysis of companies has been conducted to help clients understand the wider business environment as well as the strengths and weaknesses of key industry players. Data is qualitatively analyzed to categorize companies as pure play, category-focused, industry-focused, and diversified; it is quantitatively analyzed to categorize companies as dominant, leading, strong, tentative, and weak.

Recent Development and News in Gonorrhea therapeutics market

  • In August 2024, the Global Antibiotic Research and Development Partnership (GARDP) and Innoviva Specialty Therapeutics finalized a strategic agreement to ensure equitable global distribution of zoliflodacin upon its regulatory approval, focusing on access in low-income regions.
  • In February 2025, the Centers for Disease Control and Prevention (CDC) released a surveillance report indicating a significant rise in the prevalence of ceftriaxone-resistant gonococcal strains in several high-density urban populations, highlighting the urgency for new therapies.
  • In March 2025, GlaxoSmithKline plc announced that the US Food and Drug Administration (FDA) accepted its New Drug Application (NDA) for gepotidacin, a first-in-class oral antibiotic for treating uncomplicated urogenital gonorrhea.
  • In May 2025, GlaxoSmithKline plc published positive results from its global phase three trials for gepotidacin, showing the oral antibiotic met its primary endpoint of microbiological cure for uncomplicated urogenital gonorrhea.

Dive into Technavio’s robust research methodology, blending expert interviews, extensive data synthesis, and validated models for unparalleled Gonorrhea Therapeutics Market insights. See full methodology.

Market Scope
Page number 298
Base year 2025
Historic period 2020-2024
Forecast period 2026-2030
Growth momentum & CAGR Accelerate at a CAGR of 5.4%
Market growth 2026-2030 USD 586.5 million
Market structure Fragmented
YoY growth 2025-2026(%) 5.4%
Key countries US, Canada, Mexico, UK, Germany, France, Italy, Spain, The Netherlands, China, Japan, India, South Korea, Indonesia, Thailand, Brazil, South Africa, UAE, Argentina, Saudi Arabia, Egypt, Colombia and Qatar
Competitive landscape Leading Companies, Market Positioning of Companies, Competitive Strategies, and Industry Risks

Request Free Sample

Research Analyst Overview

  • The gonorrhea therapeutics market is pivoting in response to widespread Neisseria gonorrhoeae resistance, making antimicrobial resistance (AMR) a central concern. This has accelerated oral antibiotic development, with a focus on first-in-class oral antibiotics that utilize novel mechanisms of action, such as topoisomerase inhibitors and spiropiperidines.
  • The progression of candidates like gepotidacin and zoliflodacin through late-stage clinical trials signifies crucial pipeline maturation in anti-infective therapies. This shift toward non-injectable alternatives forces a strategic reconsideration of R&D budgeting at the boardroom level, as new oral antibiotic regimens can improve patient compliance by over 30% compared to injectables.
  • The market is also defined by the need for precision antimicrobial stewardship and effective bacterial pathway targeting to address ceftriaxone resistance and last-line treatment failure. The development of treatments for uncomplicated urogenital gonorrhea and more difficult extragenital infections, such as pharyngeal and rectal gonorrhea, continues to be a primary focus for overcoming genetic resistance markers and ensuring long-term therapeutic efficacy.

What are the Key Data Covered in this Gonorrhea Therapeutics Market Research and Growth Report?

  • What is the expected growth of the Gonorrhea Therapeutics Market between 2026 and 2030?

    • USD 586.5 million, at a CAGR of 5.4%

  • What segmentation does the market report cover?

    • The report is segmented by Distribution Channel (Hospital pharmacies, Retail pharmacies, and Online pharmacies), Therapy (Monotherapy, and Combination therapy), Route of Administration (Intramuscular, Oral, Intravenous, and Injectable) and Geography (North America, Europe, Asia, Rest of World (ROW))

  • Which regions are analyzed in the report?

    • North America, Europe, Asia and Rest of World (ROW)

  • What are the key growth drivers and market challenges?

    • Increasing global incidence of multidrug-resistant strains and treatment failures, Biological complexity and proliferation of multidrug resistant strains

  • Who are the major players in the Gonorrhea Therapeutics Market?

    • Achilles Vaccines Inc., Alopexx Enterprises LLC, Apotex Inc., Aurobindo Pharma Ltd., Cipla Inc., Debiopharm International SA, Entasis Therapeutics, Evofem Biosciences Inc., F. Hoffmann La Roche Ltd., GlaxoSmithKline Plc, Hikma Pharmaceuticals Plc, Innoviva Specialty Therapeutics Inc, Lupin Ltd., Merck and Co. Inc., Nobelpharma Co Ltd, Pfizer Inc., Sun Pharmaceutical Industries, Teva Pharmaceutical Ltd., Therapyx Inc. and Venatorx Pharmaceuticals Inc.

Market Research Insights

  • The market is undergoing a dynamic shift, heavily influenced by the need for effective solutions against ceftriaxone-resistant strains. A key change is the move from injectable cephalosporins to innovative oral treatments, a transition supported by robust public health surveillance. The integration of rapid molecular diagnostics can reduce misdiagnosis rates by up to 25%, enabling more precise treatment.
  • New oral monotherapies demonstrate efficacy rates exceeding 95% in clinical trials, significantly improving patient compliance. This evolution is supported by treatment guideline updates and a greater focus on point-of-care resistance identification. These advancements are not only enhancing therapeutic outcomes but also reshaping supply chain management for antibiotics, ensuring that novel drugs are deployed effectively within global health stewardship frameworks.

We can help! Our analysts can customize this gonorrhea therapeutics market research report to meet your requirements.

Get in touch

1. Executive Summary

1.1 Market overview

Executive Summary - Chart on Market Overview
Executive Summary - Data Table on Market Overview
Executive Summary - Chart on Global Market Characteristics
Executive Summary - Chart on Market by Geography
Executive Summary - Chart on Market Segmentation by Distribution Channel
Executive Summary - Chart on Market Segmentation by Therapy
Executive Summary - Chart on Market Segmentation by Route of Administration
Executive Summary - Chart on Incremental Growth
Executive Summary - Data Table on Incremental Growth
Executive Summary - Chart on Company Market Positioning

2. Technavio Analysis

2.1 Analysis of price sensitivity, lifecycle, customer purchase basket, adoption rates, and purchase criteria

2.2 Criticality of inputs and Factors of differentiation

Chart on Overview on criticality of inputs and factors of differentiation

2.3 Factors of disruption

Chart on Overview on factors of disruption

2.4 Impact of drivers and challenges

Chart on Impact of drivers and challenges in 2025 and 2030

3. Market Landscape

3.1 Market ecosystem

Chart on Parent Market
Data Table on - Parent Market

3.2 Market characteristics

Chart on Market characteristics analysis

3.3 Value chain analysis

Chart on Value chain analysis

4. Market Sizing

4.1 Market definition

Data Table on Offerings of companies included in the market definition

4.2 Market segment analysis

Market segments

4.3 Market size 2025

4.4 Market outlook: Forecast for 2025-2030

Chart on Global - Market size and forecast 2025-2030 ($ million)
Data Table on Global - Market size and forecast 2025-2030 ($ million)
Chart on Global Market: Year-over-year growth 2025-2030 (%)
Data Table on Global Market: Year-over-year growth 2025-2030 (%)

5. Historic Market Size

5.1 Global Gonorrhea Therapeutics Market 2020 - 2024

Historic Market Size - Data Table on Global Gonorrhea Therapeutics Market 2020 - 2024 ($ million)

5.2 Distribution Channel segment analysis 2020 - 2024

Historic Market Size - Distribution Channel Segment 2020 - 2024 ($ million)

5.3 Therapy segment analysis 2020 - 2024

Historic Market Size - Therapy Segment 2020 - 2024 ($ million)

5.4 Route of Administration segment analysis 2020 - 2024

Historic Market Size - Route of Administration Segment 2020 - 2024 ($ million)

5.5 Geography segment analysis 2020 - 2024

Historic Market Size - Geography Segment 2020 - 2024 ($ million)

5.6 Country segment analysis 2020 - 2024

Historic Market Size - Country Segment 2020 - 2024 ($ million)

6. Qualitative Analysis

6.1 Impact of AI in the Global Gonorrhea Therapeutics Market

6.2 Impact of Geopolitical Conflict on Global Gonorrhea Therapeutics Market

7. Five Forces Analysis

7.1 Five forces summary

Five forces analysis - Comparison between 2025 and 2030

7.2 Bargaining power of buyers

Bargaining power of buyers - Impact of key factors 2025 and 2030

7.3 Bargaining power of suppliers

Bargaining power of suppliers - Impact of key factors in 2025 and 2030

7.4 Threat of new entrants

Threat of new entrants - Impact of key factors in 2025 and 2030

7.5 Threat of substitutes

Threat of substitutes - Impact of key factors in 2025 and 2030

7.6 Threat of rivalry

Threat of rivalry - Impact of key factors in 2025 and 2030

7.7 Market condition

Chart on Market condition - Five forces 2025 and 2030

8. Market Segmentation by Distribution Channel

8.1 Market segments

Chart on Distribution Channel - Market share 2025-2030 (%)
Data Table on Distribution Channel - Market share 2025-2030 (%)

8.2 Comparison by Distribution Channel

Chart on Comparison by Distribution Channel
Data Table on Comparison by Distribution Channel

8.3 Hospital pharmacies - Market size and forecast 2025-2030

Chart on Hospital pharmacies - Market size and forecast 2025-2030 ($ million)
Data Table on Hospital pharmacies - Market size and forecast 2025-2030 ($ million)
Chart on Hospital pharmacies - Year-over-year growth 2025-2030 (%)
Data Table on Hospital pharmacies - Year-over-year growth 2025-2030 (%)

8.4 Retail pharmacies - Market size and forecast 2025-2030

Chart on Retail pharmacies - Market size and forecast 2025-2030 ($ million)
Data Table on Retail pharmacies - Market size and forecast 2025-2030 ($ million)
Chart on Retail pharmacies - Year-over-year growth 2025-2030 (%)
Data Table on Retail pharmacies - Year-over-year growth 2025-2030 (%)

8.5 Online pharmacies - Market size and forecast 2025-2030

Chart on Online pharmacies - Market size and forecast 2025-2030 ($ million)
Data Table on Online pharmacies - Market size and forecast 2025-2030 ($ million)
Chart on Online pharmacies - Year-over-year growth 2025-2030 (%)
Data Table on Online pharmacies - Year-over-year growth 2025-2030 (%)

8.6 Market opportunity by Distribution Channel

Market opportunity by Distribution Channel ($ million)
Data Table on Market opportunity by Distribution Channel ($ million)

9. Market Segmentation by Therapy

9.1 Market segments

Chart on Therapy - Market share 2025-2030 (%)
Data Table on Therapy - Market share 2025-2030 (%)

9.2 Comparison by Therapy

Chart on Comparison by Therapy
Data Table on Comparison by Therapy

9.3 Monotherapy - Market size and forecast 2025-2030

Chart on Monotherapy - Market size and forecast 2025-2030 ($ million)
Data Table on Monotherapy - Market size and forecast 2025-2030 ($ million)
Chart on Monotherapy - Year-over-year growth 2025-2030 (%)
Data Table on Monotherapy - Year-over-year growth 2025-2030 (%)

9.4 Combination therapy - Market size and forecast 2025-2030

Chart on Combination therapy - Market size and forecast 2025-2030 ($ million)
Data Table on Combination therapy - Market size and forecast 2025-2030 ($ million)
Chart on Combination therapy - Year-over-year growth 2025-2030 (%)
Data Table on Combination therapy - Year-over-year growth 2025-2030 (%)

9.5 Market opportunity by Therapy

Market opportunity by Therapy ($ million)
Data Table on Market opportunity by Therapy ($ million)

10. Market Segmentation by Route of Administration

10.1 Market segments

Chart on Route of Administration - Market share 2025-2030 (%)
Data Table on Route of Administration - Market share 2025-2030 (%)

10.2 Comparison by Route of Administration

Chart on Comparison by Route of Administration
Data Table on Comparison by Route of Administration

10.3 Intramuscular - Market size and forecast 2025-2030

Chart on Intramuscular - Market size and forecast 2025-2030 ($ million)
Data Table on Intramuscular - Market size and forecast 2025-2030 ($ million)
Chart on Intramuscular - Year-over-year growth 2025-2030 (%)
Data Table on Intramuscular - Year-over-year growth 2025-2030 (%)

10.4 Oral - Market size and forecast 2025-2030

Chart on Oral - Market size and forecast 2025-2030 ($ million)
Data Table on Oral - Market size and forecast 2025-2030 ($ million)
Chart on Oral - Year-over-year growth 2025-2030 (%)
Data Table on Oral - Year-over-year growth 2025-2030 (%)

10.5 Intravenous - Market size and forecast 2025-2030

Chart on Intravenous - Market size and forecast 2025-2030 ($ million)
Data Table on Intravenous - Market size and forecast 2025-2030 ($ million)
Chart on Intravenous - Year-over-year growth 2025-2030 (%)
Data Table on Intravenous - Year-over-year growth 2025-2030 (%)

10.6 Injectable - Market size and forecast 2025-2030

Chart on Injectable - Market size and forecast 2025-2030 ($ million)
Data Table on Injectable - Market size and forecast 2025-2030 ($ million)
Chart on Injectable - Year-over-year growth 2025-2030 (%)
Data Table on Injectable - Year-over-year growth 2025-2030 (%)

10.7 Market opportunity by Route of Administration

Market opportunity by Route of Administration ($ million)
Data Table on Market opportunity by Route of Administration ($ million)

11. Customer Landscape

11.1 Customer landscape overview

Analysis of price sensitivity, lifecycle, customer purchase basket, adoption rates, and purchase criteria

12. Geographic Landscape

12.1 Geographic segmentation

Chart on Market share by geography 2025-2030 (%)
Data Table on Market share by geography 2025-2030 (%)

12.2 Geographic comparison

Chart on Geographic comparison
Data Table on Geographic comparison

12.3 North America - Market size and forecast 2025-2030

Chart on North America - Market size and forecast 2025-2030 ($ million)
Data Table on North America - Market size and forecast 2025-2030 ($ million)
Chart on North America - Year-over-year growth 2025-2030 (%)
Data Table on North America - Year-over-year growth 2025-2030 (%)
Chart on Regional Comparison - North America
Data Table on Regional Comparison - North America

12.3.1 US - Market size and forecast 2025-2030

Chart on US - Market size and forecast 2025-2030 ($ million)
Data Table on US - Market size and forecast 2025-2030 ($ million)
Chart on US - Year-over-year growth 2025-2030 (%)
Data Table on US - Year-over-year growth 2025-2030 (%)

12.3.2 Canada - Market size and forecast 2025-2030

Chart on Canada - Market size and forecast 2025-2030 ($ million)
Data Table on Canada - Market size and forecast 2025-2030 ($ million)
Chart on Canada - Year-over-year growth 2025-2030 (%)
Data Table on Canada - Year-over-year growth 2025-2030 (%)

12.3.3 Mexico - Market size and forecast 2025-2030

Chart on Mexico - Market size and forecast 2025-2030 ($ million)
Data Table on Mexico - Market size and forecast 2025-2030 ($ million)
Chart on Mexico - Year-over-year growth 2025-2030 (%)
Data Table on Mexico - Year-over-year growth 2025-2030 (%)

12.4 Europe - Market size and forecast 2025-2030

Chart on Europe - Market size and forecast 2025-2030 ($ million)
Data Table on Europe - Market size and forecast 2025-2030 ($ million)
Chart on Europe - Year-over-year growth 2025-2030 (%)
Data Table on Europe - Year-over-year growth 2025-2030 (%)
Chart on Regional Comparison - Europe
Data Table on Regional Comparison - Europe

12.4.1 UK - Market size and forecast 2025-2030

Chart on UK - Market size and forecast 2025-2030 ($ million)
Data Table on UK - Market size and forecast 2025-2030 ($ million)
Chart on UK - Year-over-year growth 2025-2030 (%)
Data Table on UK - Year-over-year growth 2025-2030 (%)

12.4.2 Germany - Market size and forecast 2025-2030

Chart on Germany - Market size and forecast 2025-2030 ($ million)
Data Table on Germany - Market size and forecast 2025-2030 ($ million)
Chart on Germany - Year-over-year growth 2025-2030 (%)
Data Table on Germany - Year-over-year growth 2025-2030 (%)

12.4.3 France - Market size and forecast 2025-2030

Chart on France - Market size and forecast 2025-2030 ($ million)
Data Table on France - Market size and forecast 2025-2030 ($ million)
Chart on France - Year-over-year growth 2025-2030 (%)
Data Table on France - Year-over-year growth 2025-2030 (%)

12.4.4 Italy - Market size and forecast 2025-2030

Chart on Italy - Market size and forecast 2025-2030 ($ million)
Data Table on Italy - Market size and forecast 2025-2030 ($ million)
Chart on Italy - Year-over-year growth 2025-2030 (%)
Data Table on Italy - Year-over-year growth 2025-2030 (%)

12.4.5 Spain - Market size and forecast 2025-2030

Chart on Spain - Market size and forecast 2025-2030 ($ million)
Data Table on Spain - Market size and forecast 2025-2030 ($ million)
Chart on Spain - Year-over-year growth 2025-2030 (%)
Data Table on Spain - Year-over-year growth 2025-2030 (%)

12.4.6 The Netherlands - Market size and forecast 2025-2030

Chart on The Netherlands - Market size and forecast 2025-2030 ($ million)
Data Table on The Netherlands - Market size and forecast 2025-2030 ($ million)
Chart on The Netherlands - Year-over-year growth 2025-2030 (%)
Data Table on The Netherlands - Year-over-year growth 2025-2030 (%)

12.5 Asia - Market size and forecast 2025-2030

Chart on Asia - Market size and forecast 2025-2030 ($ million)
Data Table on Asia - Market size and forecast 2025-2030 ($ million)
Chart on Asia - Year-over-year growth 2025-2030 (%)
Data Table on Asia - Year-over-year growth 2025-2030 (%)
Chart on Regional Comparison - Asia
Data Table on Regional Comparison - Asia

12.5.1 China - Market size and forecast 2025-2030

Chart on China - Market size and forecast 2025-2030 ($ million)
Data Table on China - Market size and forecast 2025-2030 ($ million)
Chart on China - Year-over-year growth 2025-2030 (%)
Data Table on China - Year-over-year growth 2025-2030 (%)

12.5.2 Japan - Market size and forecast 2025-2030

Chart on Japan - Market size and forecast 2025-2030 ($ million)
Data Table on Japan - Market size and forecast 2025-2030 ($ million)
Chart on Japan - Year-over-year growth 2025-2030 (%)
Data Table on Japan - Year-over-year growth 2025-2030 (%)

12.5.3 India - Market size and forecast 2025-2030

Chart on India - Market size and forecast 2025-2030 ($ million)
Data Table on India - Market size and forecast 2025-2030 ($ million)
Chart on India - Year-over-year growth 2025-2030 (%)
Data Table on India - Year-over-year growth 2025-2030 (%)

12.5.4 South Korea - Market size and forecast 2025-2030

Chart on South Korea - Market size and forecast 2025-2030 ($ million)
Data Table on South Korea - Market size and forecast 2025-2030 ($ million)
Chart on South Korea - Year-over-year growth 2025-2030 (%)
Data Table on South Korea - Year-over-year growth 2025-2030 (%)

12.5.5 Indonesia - Market size and forecast 2025-2030

Chart on Indonesia - Market size and forecast 2025-2030 ($ million)
Data Table on Indonesia - Market size and forecast 2025-2030 ($ million)
Chart on Indonesia - Year-over-year growth 2025-2030 (%)
Data Table on Indonesia - Year-over-year growth 2025-2030 (%)

12.5.6 Thailand - Market size and forecast 2025-2030

Chart on Thailand - Market size and forecast 2025-2030 ($ million)
Data Table on Thailand - Market size and forecast 2025-2030 ($ million)
Chart on Thailand - Year-over-year growth 2025-2030 (%)
Data Table on Thailand - Year-over-year growth 2025-2030 (%)

12.6 Rest of World (ROW) - Market size and forecast 2025-2030

Chart on Rest of World (ROW) - Market size and forecast 2025-2030 ($ million)
Data Table on Rest of World (ROW) - Market size and forecast 2025-2030 ($ million)
Chart on Rest of World (ROW) - Year-over-year growth 2025-2030 (%)
Data Table on Rest of World (ROW) - Year-over-year growth 2025-2030 (%)
Chart on Regional Comparison - Rest of World (ROW)
Data Table on Regional Comparison - Rest of World (ROW)

12.6.1 Brazil - Market size and forecast 2025-2030

Chart on Brazil - Market size and forecast 2025-2030 ($ million)
Data Table on Brazil - Market size and forecast 2025-2030 ($ million)
Chart on Brazil - Year-over-year growth 2025-2030 (%)
Data Table on Brazil - Year-over-year growth 2025-2030 (%)

12.6.2 South Africa - Market size and forecast 2025-2030

Chart on South Africa - Market size and forecast 2025-2030 ($ million)
Data Table on South Africa - Market size and forecast 2025-2030 ($ million)
Chart on South Africa - Year-over-year growth 2025-2030 (%)
Data Table on South Africa - Year-over-year growth 2025-2030 (%)

12.6.3 UAE - Market size and forecast 2025-2030

Chart on UAE - Market size and forecast 2025-2030 ($ million)
Data Table on UAE - Market size and forecast 2025-2030 ($ million)
Chart on UAE - Year-over-year growth 2025-2030 (%)
Data Table on UAE - Year-over-year growth 2025-2030 (%)

12.6.4 Argentina - Market size and forecast 2025-2030

Chart on Argentina - Market size and forecast 2025-2030 ($ million)
Data Table on Argentina - Market size and forecast 2025-2030 ($ million)
Chart on Argentina - Year-over-year growth 2025-2030 (%)
Data Table on Argentina - Year-over-year growth 2025-2030 (%)

12.6.5 Saudi Arabia - Market size and forecast 2025-2030

Chart on Saudi Arabia - Market size and forecast 2025-2030 ($ million)
Data Table on Saudi Arabia - Market size and forecast 2025-2030 ($ million)
Chart on Saudi Arabia - Year-over-year growth 2025-2030 (%)
Data Table on Saudi Arabia - Year-over-year growth 2025-2030 (%)

12.6.6 Egypt - Market size and forecast 2025-2030

Chart on Egypt - Market size and forecast 2025-2030 ($ million)
Data Table on Egypt - Market size and forecast 2025-2030 ($ million)
Chart on Egypt - Year-over-year growth 2025-2030 (%)
Data Table on Egypt - Year-over-year growth 2025-2030 (%)

12.6.7 Colombia - Market size and forecast 2025-2030

Chart on Colombia - Market size and forecast 2025-2030 ($ million)
Data Table on Colombia - Market size and forecast 2025-2030 ($ million)
Chart on Colombia - Year-over-year growth 2025-2030 (%)
Data Table on Colombia - Year-over-year growth 2025-2030 (%)

12.6.8 Qatar - Market size and forecast 2025-2030

Chart on Qatar - Market size and forecast 2025-2030 ($ million)
Data Table on Qatar - Market size and forecast 2025-2030 ($ million)
Chart on Qatar - Year-over-year growth 2025-2030 (%)
Data Table on Qatar - Year-over-year growth 2025-2030 (%)

12.7 Market opportunity by geography

Market opportunity by geography ($ million)
Data Tables on Market opportunity by geography ($ million)

13. Drivers, Challenges, and Opportunity

13.1 Market drivers

Increasing global incidence of multidrug-resistant strains and treatment failures
Clinical advancements in novel oral antibiotic classes and pipeline maturation
Enhanced regulatory support and global stewardship incentives

13.2 Market challenges

Biological complexity and proliferation of multidrug resistant strains
Economic viability and absence of robust market incentives
Diagnostic limitations and impact of social stigma on treatment access

13.3 Impact of drivers and challenges

Impact of drivers and challenges in 2025 and 2030

13.4 Market opportunities

Strategic transition toward oral first-in-class antimicrobial monotherapies
Integration of rapid molecular diagnostics and precision antimicrobial stewardship
Expansion of global access initiatives and public-private stewardship collaborations

14. Competitive Landscape

14.1 Overview

14.2

Overview on criticality of inputs and factors of differentiation

14.3 Landscape disruption

Overview on factors of disruption

14.4 Industry risks

Impact of key risks on business

15. Competitive Analysis

15.1 Companies profiled

Companies covered

15.2 Company ranking index

15.3 Market positioning of companies

Matrix on companies position and classification

15.4 Alopexx Enterprises LLC

Alopexx Enterprises LLC - Overview
Alopexx Enterprises LLC - Product / Service
Alopexx Enterprises LLC - Key offerings
SWOT

15.5 Apotex Inc.

Apotex Inc. - Overview
Apotex Inc. - Product / Service
Apotex Inc. - Key offerings
SWOT

15.6 Aurobindo Pharma Ltd.

Aurobindo Pharma Ltd. - Overview
Aurobindo Pharma Ltd. - Business segments
Aurobindo Pharma Ltd. - Key news
Aurobindo Pharma Ltd. - Key offerings
Aurobindo Pharma Ltd. - Segment focus
SWOT

15.7 Cipla Inc.

Cipla Inc. - Overview
Cipla Inc. - Business segments
Cipla Inc. - Key news
Cipla Inc. - Key offerings
Cipla Inc. - Segment focus
SWOT

15.8 Debiopharm International SA

Debiopharm International SA - Overview
Debiopharm International SA - Product / Service
Debiopharm International SA - Key offerings
SWOT

15.9 Evofem Biosciences Inc.

Evofem Biosciences Inc. - Overview
Evofem Biosciences Inc. - Product / Service
Evofem Biosciences Inc. - Key offerings
SWOT

15.10 F. Hoffmann La Roche Ltd.

F. Hoffmann La Roche Ltd. - Overview
F. Hoffmann La Roche Ltd. - Business segments
F. Hoffmann La Roche Ltd. - Key news
F. Hoffmann La Roche Ltd. - Key offerings
F. Hoffmann La Roche Ltd. - Segment focus
SWOT

15.11 GlaxoSmithKline Plc

GlaxoSmithKline Plc - Overview
GlaxoSmithKline Plc - Business segments
GlaxoSmithKline Plc - Key news
GlaxoSmithKline Plc - Key offerings
GlaxoSmithKline Plc - Segment focus
SWOT

15.12 Hikma Pharmaceuticals Plc

Hikma Pharmaceuticals Plc - Overview
Hikma Pharmaceuticals Plc - Business segments
Hikma Pharmaceuticals Plc - Key news
Hikma Pharmaceuticals Plc - Key offerings
Hikma Pharmaceuticals Plc - Segment focus
SWOT

15.13 Lupin Ltd.

Lupin Ltd. - Overview
Lupin Ltd. - Business segments
Lupin Ltd. - Key news
Lupin Ltd. - Key offerings
Lupin Ltd. - Segment focus
SWOT

15.14 Merck and Co. Inc.

Merck and Co. Inc. - Overview
Merck and Co. Inc. - Business segments
Merck and Co. Inc. - Key news
Merck and Co. Inc. - Key offerings
Merck and Co. Inc. - Segment focus
SWOT

15.15 Pfizer Inc.

Pfizer Inc. - Overview
Pfizer Inc. - Business segments
Pfizer Inc. - Key news
Pfizer Inc. - Key offerings
Pfizer Inc. - Segment focus
SWOT

15.16 Sun Pharmaceutical Industries

Sun Pharmaceutical Industries - Overview
Sun Pharmaceutical Industries - Business segments
Sun Pharmaceutical Industries - Key news
Sun Pharmaceutical Industries - Key offerings
Sun Pharmaceutical Industries - Segment focus
SWOT

15.17 Teva Pharmaceutical Ltd.

Teva Pharmaceutical Ltd. - Overview
Teva Pharmaceutical Ltd. - Business segments
Teva Pharmaceutical Ltd. - Key news
Teva Pharmaceutical Ltd. - Key offerings
Teva Pharmaceutical Ltd. - Segment focus
SWOT

15.18 Venatorx Pharmaceuticals Inc.

Venatorx Pharmaceuticals Inc. - Overview
Venatorx Pharmaceuticals Inc. - Product / Service
Venatorx Pharmaceuticals Inc. - Key offerings
SWOT

16. Appendix

16.1 Scope of the report

Market definition
Objectives
Notes and caveats

16.2 Inclusions and exclusions checklist

Inclusions checklist
Exclusions checklist

16.3 Currency conversion rates for US$

16.4 Research methodology

16.5 Data procurement

Information sources

16.6 Data validation

16.7 Validation techniques employed for market sizing

16.8 Data synthesis

16.9 360 degree market analysis

16.10 List of abbreviations

Research Methodology

Technavio presents a detailed picture of the market by way of study, synthesis, and summation of data from multiple sources. The analysts have presented the various facets of the market with a particular focus on identifying the key industry influencers. The data thus presented is comprehensive, reliable, and the result of extensive research, both primary and secondary.

INFORMATION SOURCES

Primary sources

  • Manufacturers and suppliers
  • Channel partners
  • Industry experts
  • Strategic decision makers

Secondary sources

  • Industry journals and periodicals
  • Government data
  • Financial reports of key industry players
  • Historical data
  • Press releases

DATA ANALYSIS

Data Synthesis

  • Collation of data
  • Estimation of key figures
  • Analysis of derived insights

Data Validation

  • Triangulation with data models
  • Reference against proprietary databases
  • Corroboration with industry experts

REPORT WRITING

Qualitative

  • Market drivers
  • Market challenges
  • Market trends
  • Five forces analysis

Quantitative

  • Market size and forecast
  • Market segmentation
  • Geographical insights
  • Competitive landscape

Interested in this report?

Get your sample now to see our research methodology and insights!

Download Now

Frequently Asked Questions

Gonorrhea Therapeutics market growth will increase by USD 586.5 million during 2026-2030.

The Gonorrhea Therapeutics market is expected to grow at a CAGR of 5.4% during 2026-2030.

Gonorrhea Therapeutics market is segmented by Distribution channel (Hospital pharmacies, Retail pharmacies, Online pharmacies) Therapy (Monotherapy, Combination therapy) Route of administration (Intramuscular, Oral, Intravenous, Injectable)

Achilles Vaccines Inc., Alopexx Enterprises LLC, Apotex Inc., Aurobindo Pharma Ltd., Cipla Inc., Debiopharm International SA, Entasis Therapeutics, Evofem Biosciences Inc., F. Hoffmann La Roche Ltd., GlaxoSmithKline Plc, Hikma Pharmaceuticals Plc, Innoviva Specialty Therapeutics Inc, Lupin Ltd., Merck and Co. Inc., Nobelpharma Co Ltd, Pfizer Inc., Sun Pharmaceutical Industries, Teva Pharmaceutical Ltd., Therapyx Inc., Venatorx Pharmaceuticals Inc. are a few of the key vendors in the Gonorrhea Therapeutics market.

North America will register the highest growth rate of 38.7% among the other regions. Therefore, the Gonorrhea Therapeutics market in North America is expected to garner significant business opportunities for the vendors during the forecast period.

US, Canada, Mexico, UK, Germany, France, Italy, Spain, The Netherlands, China, Japan, India, South Korea, Indonesia, Thailand, Brazil, South Africa, UAE, Argentina, Saudi Arabia, Egypt, Colombia, Qatar

  • Increasing global incidence of multidrug-resistant strains and treatment failures is the driving factor this market.

The Gonorrhea Therapeutics market vendors should focus on grabbing business opportunities from the Distribution channel segment as it accounted for the largest market share in the base year.
RIA - Research AI Assistant
Ask RIA