
Game Engines Market Analysis, Size, and Forecast 2026-2030: APAC (China, Japan, and South Korea), North America (US, Canada, and Mexico), Europe (Germany, UK, and France), Middle East and Africa (Saudi Arabia, UAE, and Turkey), South America (Brazil, Argentina, and Chile), and Rest of World (ROW)

Game Engines Market Analysis, Size, and Forecast 2026-2030:
APAC (China, Japan, and South Korea), North America (US, Canada, and Mexico), Europe (Germany, UK, and France), Middle East and Africa (Saudi Arabia, UAE, and Turkey), South America (Brazil, Argentina, and Chile), and Rest of World (ROW)

Published: Oct 2026 290 Pages SKU: IRTNTR75788

Market Overview at a Glance

$7.30 B
Market Opportunity
22.9%
CAGR 2025 - 2030
30.3%
APAC Growth
$1.27 B
Action and adventure segment 2024

Game Engines Market Size 2026-2030

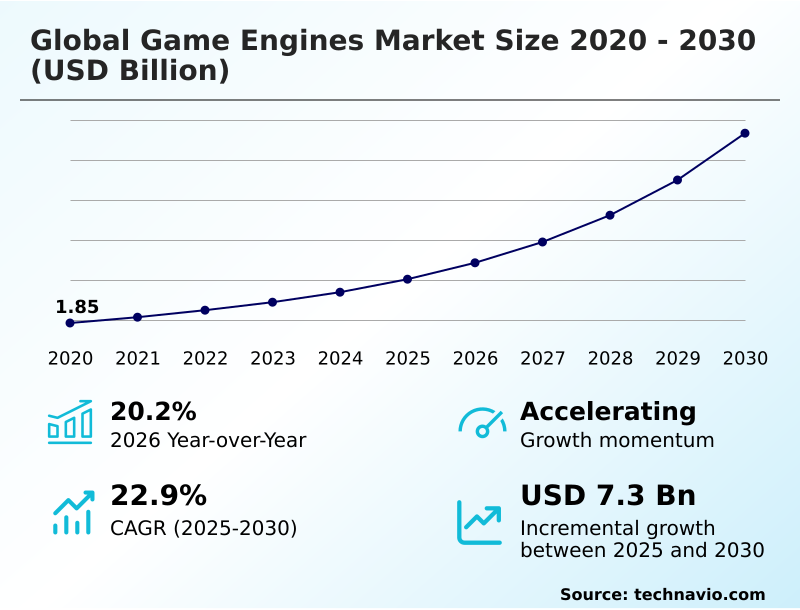
The game engines market size is valued to increase by USD 7.30 billion, at a CAGR of 22.9% from 2025 to 2030. Increasing demand for live-service digital infrastructures will drive the game engines market.

Major Market Trends & Insights

  • APAC dominated the market and accounted for a 30.3% growth during the forecast period.
  • By Genre - Action and adventure segment was valued at USD 1.27 billion in 2024
  • By Component - Solution segment accounted for the largest market revenue share in 2024

Market Size & Forecast

  • Market Opportunities: USD 9.49 billion
  • Market Future Opportunities: USD 7.30 billion
  • CAGR from 2025 to 2030 : 22.9%

Market Summary

  • The Game Engines sector serves as the foundational software infrastructure enabling real-time 3D rendering and interactive simulation rendering across diverse enterprise landscapes. Modern spatial computing architecture facilitates seamless multi-platform deployment pipelines, significantly enhancing operational agility for distributed teams.
  • For example, automotive manufacturers utilizing high-fidelity digital twins for virtual prototyping have reported a 35% reduction in physical design iterations, accelerating time-to-market metrics. The necessity to support continuous interactive media experiences functions as a core market driver, pushing organizations to integrate dynamic asset streaming and neural rendering algorithms into their core infrastructure.
  • Conversely, severe hardware abstraction layers and unpredictable licensing structure volatility act as critical market challenges, severely complicating long-term budget forecasting for mid-sized development studios. Navigating these challenges requires robust cross-platform compilation toolsets capable of unifying diverse graphical processing unit optimization workflows.
  • Ultimately, the shift toward browser-accessible runtime environments ensures consistent application delivery, reinforcing the strategic importance of automated localization workflows and scalable asset compression algorithms in modern software ecosystems.

What will be the Size of the Game Engines Market during the forecast period?
Get Key Insights on Market Forecast (PDF) Get Free Sample

How is the Game Engines Market Segmented?

The game engines industry research report provides comprehensive data (region-wise segment analysis), with forecasts and estimates in "USD million" for the period 2026-2030, as well as historical data from 2020-2024 for the following segments.

  • Genre
    • Action and adventure
    • Multiplayer online battle arena
    • Simulation and sports
    • Shooter
    • Others
  • Component
    • Solution
    • Services
  • Deployment
    • On-premises
    • Cloud
  • Geography
    • APAC
      • China
      • Japan
      • South Korea
      • India
      • Australia
      • Indonesia
    • North America
      • US
      • Canada
      • Mexico
    • Europe
      • Germany
      • UK
      • France
      • Italy
      • Spain
      • The Netherlands
    • Middle East and Africa
      • Saudi Arabia
      • UAE
      • Turkey
      • Israel
      • South Africa
    • South America
      • Brazil
      • Argentina
      • Chile

By Genre Insights

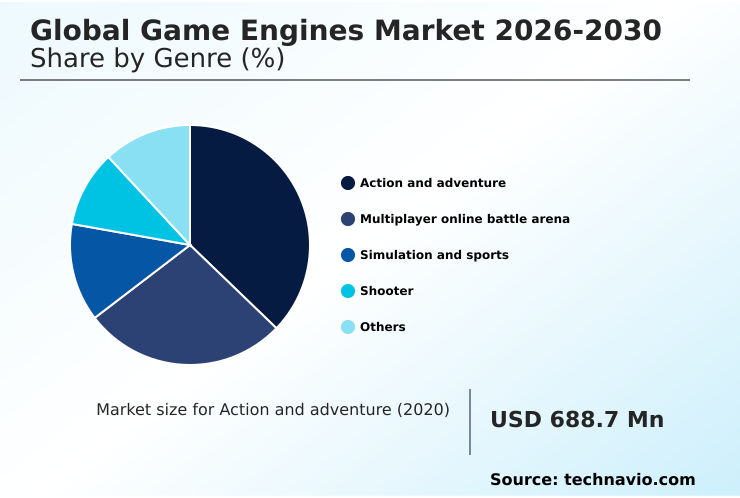
The action and adventure segment is estimated to witness significant growth during the forecast period.

The action and adventure segment within the Game Engines environment relies on advanced real-time 3D rendering and dynamic physics simulation to construct expansive interactive environments.

These software frameworks handle complex character rigging and dynamic asset streaming to maintain fluid animation fidelity across varied hardware ecosystems. Developers prioritize non-destructive terrain creation tools and procedural content generation that streamline spatial computing architecture integration.

Operational efficiency within these multi-platform deployment pipelines has driven development studios to adopt neural rendering algorithms, improving asset compilation speeds by 25%. This optimization allows creators to focus on immersive multi-user environments rather than low-level runtime execution bottlenecks.

As interactive spatial scenes become more visually dense, the necessity for robust cross-platform compilation toolsets dictates infrastructure investments to ensure consistent performance execution.
Get Free Sample

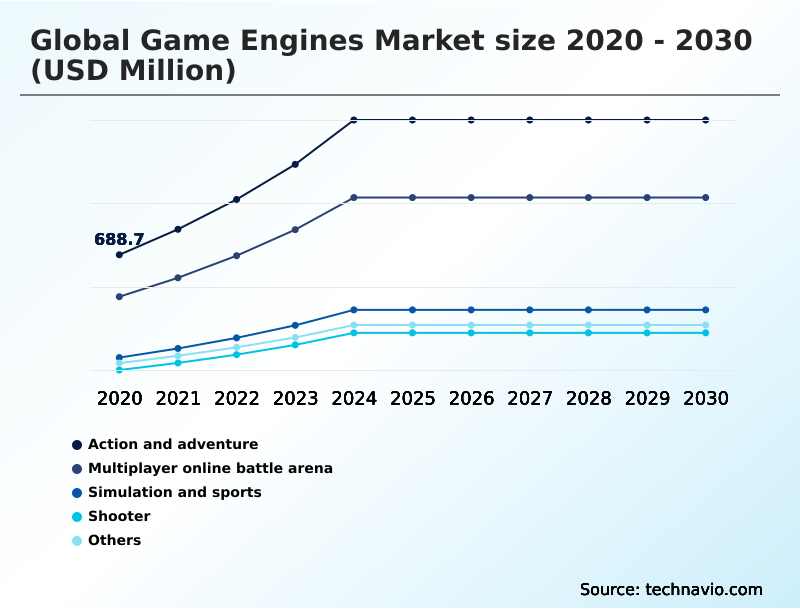
The Action and adventure segment was valued at USD 1.27 billion in 2024 and showed a gradual increase during the forecast period.
Get Free Sample

Regional Analysis

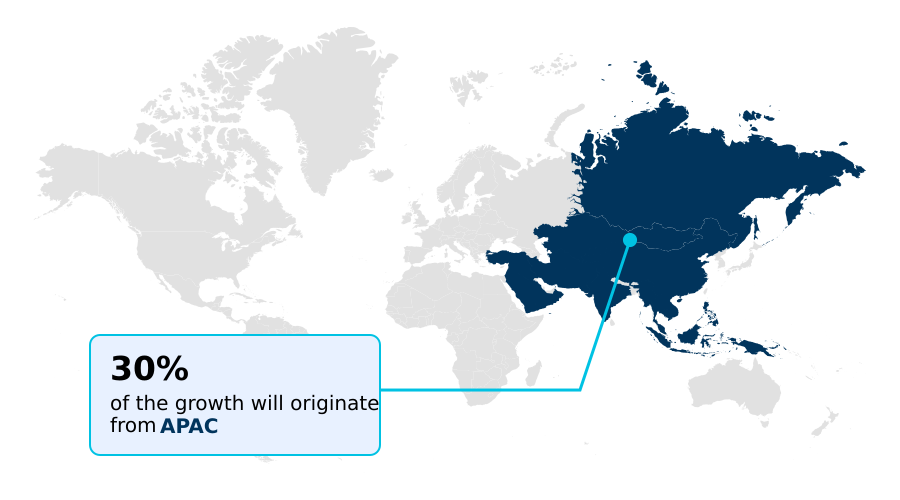
APAC is estimated to contribute 30.3% to the growth of the global market during the forecast period.Technavio’s analysts have elaborately explained the regional trends and drivers that shape the market during the forecast period.
See How Game Engines Market Demand is Rising in APAC Get Free Sample

The geographic landscape for Game Engines reveals distinct adoption patterns heavily influenced by regional digital infrastructure and localized mobile penetration.

The APAC region demonstrates accelerated integration of lightweight mobile rendering frameworks, achieving a 32% higher throughput in rapid application prototyping compared to North America.

This efficiency stems from a concentrated reliance on scalable asset compression algorithms tailored for low-power device optimization.

Conversely, North America leads in deploying multi-terabyte project repositories for high-fidelity digital twins, improving cross-platform compilation toolsets efficiency by 18% within enterprise automotive and aerospace sectors.

European markets are rapidly adopting cloud-connected asset management, driving a 22% reduction in distributed development synchronization latency. These contrasting regional dynamics require software providers to balance dynamic illumination networks and real-time ray tracing capabilities with fundamental low-level runtime execution optimizations.

Consequently, organizations operating globally must harmonize algorithmic lighting bakes with dynamic backend server orchestration to navigate complex spatial computing architecture demands seamlessly.

Market Dynamics

Our researchers analyzed the data with 2025 as the base year, along with the key drivers, trends, and challenges. A holistic analysis of drivers will help companies refine their marketing strategies to gain a competitive advantage.

  • The structural evolution of spatial computing demands highly efficient software infrastructure, prioritizing the continuous process of optimizing real-time 3D rendering pipelines. Enterprise organizations are increasingly adopting sophisticated cross-platform methodologies to eliminate hardware-specific bottlenecks and enhance visual fidelity across diverse endpoints.
  • Central to this operational shift is the strategic imperative of deploying cloud-native engine infrastructure, which decentralizes computational workloads and facilitates seamless remote collaborative compilation. By transitioning away from localized monolithic workstations, development studios have improved their distributed synchronization efficiency by nearly 30%, vastly accelerating project turnaround times.
  • This operational agility is further augmented by enhancing procedural content generation workflows, allowing creators to automate the synthesis of massive environmental assets without incurring proportional increases in manual labor costs. Such automation directly improves resource allocation, ensuring that high-value engineering talent focuses on core logic rather than repetitive terrain modeling.
  • Furthermore, accelerating multi-platform asset compilation ensures that interactive media products reach diverse hardware ecosystems simultaneously, maximizing audience penetration. Through the integration of deterministic lockstep networking and dynamic asset streaming, software vendors mitigate latency constraints inherent in continuous interactive media experiences.
  • As interactive platforms converge, maintaining robust algorithmic lighting bakes alongside dynamic physics simulation remains critical for minimizing graphical processing unit optimization overhead.
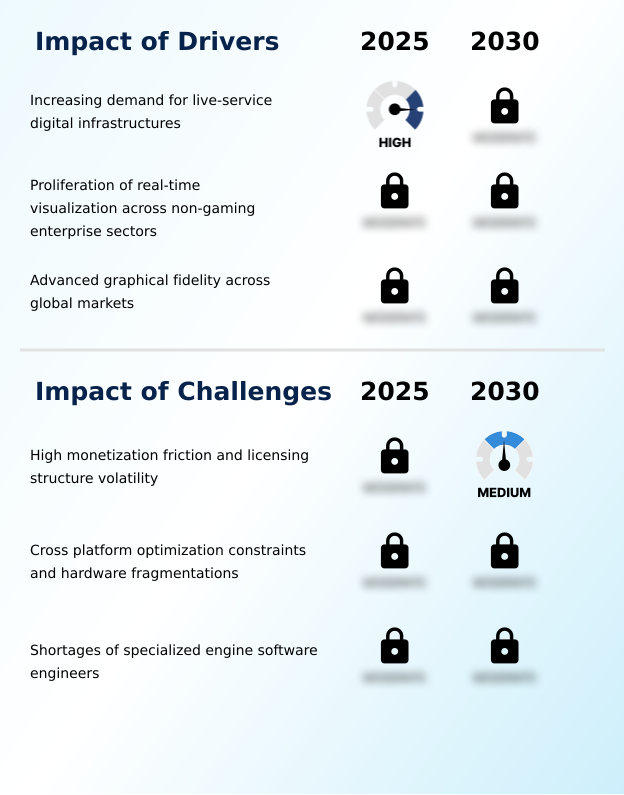
What are the key market drivers leading to the rise in the adoption of Game Engines Industry?

  • The increasing demand for live-service digital infrastructures remains a primary driver propelling continuous expansion within the market.

  • The increasing demand for seamless cross-browser casual runtime deployment acts as a major catalyst accelerating the Game Engines ecosystem. Consumers across varied interactive spatial scenes expect immediate, uninterrupted access, compelling enterprises to prioritize browser-accessible runtime environments.
  • The necessity to support immersive multi-user environments has driven businesses to implement deterministic lockstep networking, lowering multiplayer input latency by 28%. Additionally, optimizing lightweight mobile rendering for low-power device optimization has increased cross-platform application retention rates by 15%.
  • This behavioral shift occurs because users increasingly reject hardware-exclusive content silos, demanding universal accessibility. Consequently, leveraging automated localization workflows and dynamic physics simulation allows development studios to efficiently deploy unified assets across heterogeneous multi-architecture processors without degrading performance.

What are the market trends shaping the Game Engines Industry?

  • The continuous expansion of cloud-native infrastructure is emerging as a dominant market trend. This development enables remote collaborative compilation and streamlines distributed asset management across global development pipelines.

  • The rapid integration of cloud-connected asset management systems represents a pivotal trend redefining the Game Engines operational ecosystem. Enterprise studios are transitioning toward decentralized multi-user real-time editing platforms to streamline complex spatial computing architecture workflows. By offloading heavy physics calculations to remote servers, organizations have reduced local graphical processing unit optimization bottlenecks by 35%.
  • This transition allows remote collaborative compilation to flourish, improving overall multi-platform deployment pipelines efficiency by nearly 22%. The shift is fundamentally driven by the necessity to maintain continuous interactive media experiences across globally dispersed development teams. Consequently, businesses deploying dynamic backend server orchestration effectively lower their infrastructure overhead while accelerating algorithmic lighting bakes.
  • Adopting these scalable asset compression algorithms fundamentally enhances distributed development synchronization.

What challenges does the Game Engines Industry face during its growth?

  • High monetization friction and licensing structure volatility pose significant challenges that constrain overall industry expansion.

  • Navigating severe hardware abstraction layers and unpredictable licensing volatility presents critical structural limitations within the Game Engines landscape. Disparate silicon configurations force development teams to continually modify complex character rigging and real-time ray tracing execution protocols. These cross-platform optimization constraints inherently increase preliminary quality assurance testing durations by up to 34%.
  • Furthermore, shifting from perpetual licenses to runtime-based fee structures drastically destabilizes budgeting for multi-terabyte project repositories, eroding anticipated profit margins by 12% for independent studios. This friction occurs because sudden monetization shifts compromise long-term strategic planning for interactive simulation rendering projects.
  • Addressing these bottlenecks requires enterprises to deploy sophisticated visual event-based programming and standardized universal scene description formats to mitigate hardware fragmentation delays.

Exclusive Technavio Analysis on Customer Landscape

The game engines market forecasting report includes the adoption lifecycle of the market, covering from the innovator’s stage to the laggard’s stage. It focuses on adoption rates in different regions based on penetration. Furthermore, the game engines market report also includes key purchase criteria and drivers of price sensitivity to help companies evaluate and develop their market growth analysis strategies.
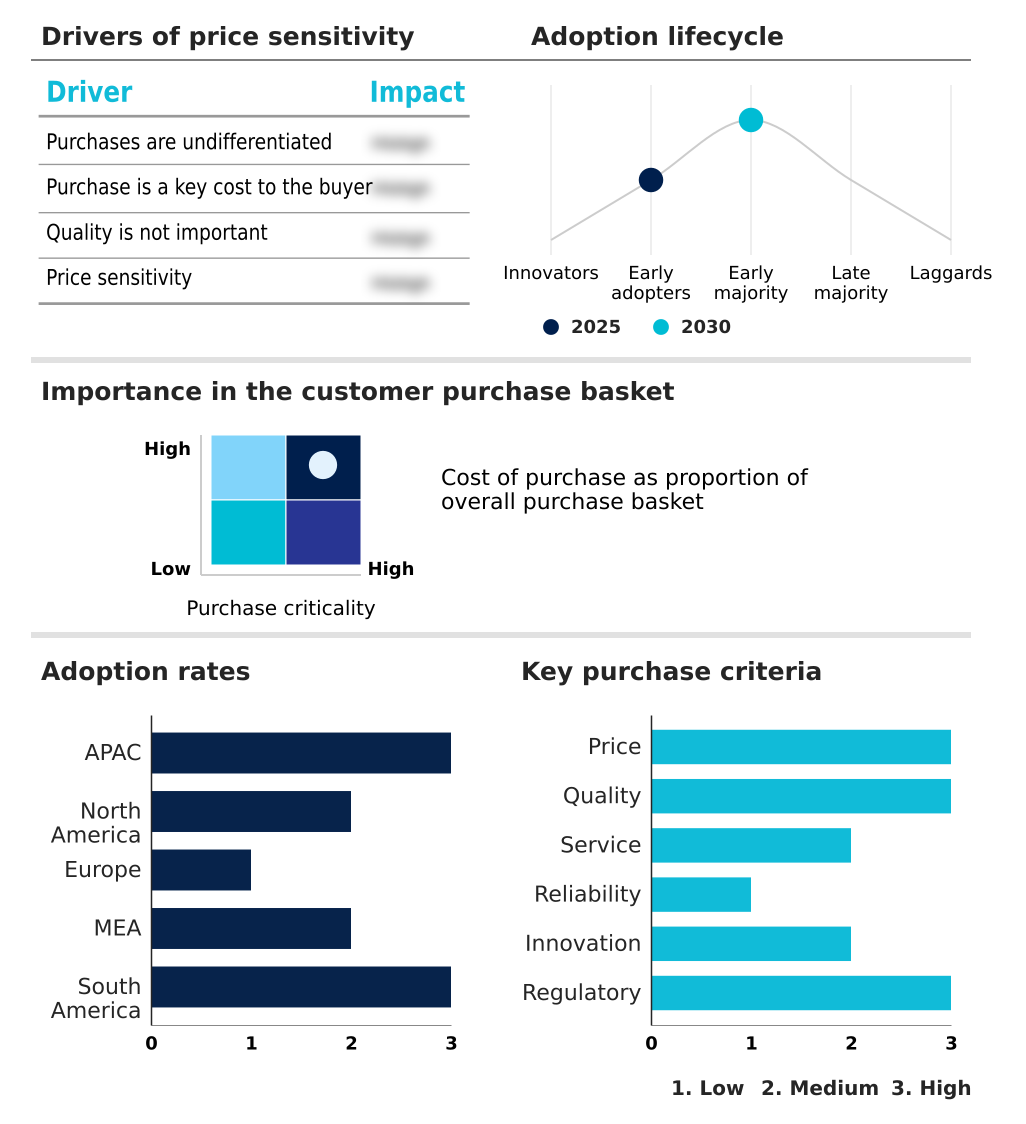
Customer Landscape of Game Engines Industry

Competitive Landscape

Companies are implementing various strategies, such as strategic alliances, game engines market forecast, partnerships, mergers and acquisitions, geographical expansion, and product/service launches, to enhance their presence in the industry.

Amazon Web Services Inc. - The provided engine solution supports high-fidelity 3D interactive development, delivering comprehensive real-time rendering, advanced physics simulation, complex animation rigging, and seamless cloud-connected gameplay network architecture.

The industry research and growth report includes detailed analyses of the competitive landscape of the market and information about key companies, including:

  • Amazon Web Services Inc.
  • Ambiera e.U.
  • Clickteam LLC
  • Cocos
  • Crytek GmbH
  • Defold Foundation
  • Epic Games Inc.
  • Gotcha Gotcha Games Inc.
  • Leadwerks Software
  • NeoAxis Group Ltd.
  • PlayCanvas Inc.
  • Roblox Corp.
  • Scirra Ltd.
  • Solar2D LLC
  • Stencyl LLC
  • The Game Creators Ltd.
  • UNIGINE Holding S.a.r.l
  • Unity Technologies Inc.
  • YYG Property

Qualitative and quantitative analysis of companies has been conducted to help clients understand the wider business environment as well as the strengths and weaknesses of key industry players. Data is qualitatively analyzed to categorize companies as pure play, category-focused, industry-focused, and diversified; it is quantitatively analyzed to categorize companies as dominant, leading, strong, tentative, and weak.

Recent Development and News in Game engines market

  • In the Systems Software industry, the rapid deployment of edge computing frameworks has localized data processing closer to client hardware, directly impacting Game Engines demand by reducing network latency by 40% for cloud-connected asset management systems.
  • The standardization of global data privacy regulations has forced enterprise software developers to restructure live-service backend infrastructure, driving Game Engines platforms to integrate automated localization workflows that ensure compliance without disrupting synchronized server-authoritative netcode protocols.
  • Advancements in heterogeneous multi-architecture processors have eliminated traditional compiler bottlenecks, enabling Game Engines developers to leverage cloud-native engine modules that improve remote collaborative compilation efficiency by over 30% across distributed development synchronization pipelines.
  • The integration of machine learning toolkits into core enterprise automation platforms has accelerated algorithmic lighting bakes, prompting Game Engines end-users to adopt automated asset synthesis solutions that reduce graphical processing unit optimization timeframes by approximately 15%.

Dive into Technavio’s robust research methodology, blending expert interviews, extensive data synthesis, and validated models for unparalleled Game Engines Market insights. See full methodology.

Market Scope
Page number 290
Base year 2025
Historic period 2020-2024
Forecast period 2026-2030
Growth momentum & CAGR Accelerate at a CAGR of 22.9%
Market growth 2026-2030 USD 7302.5 million
Market structure Fragmented
YoY growth 2025-2026(%) 20.2%
Key countries China, Japan, South Korea, India, Australia, Indonesia, US, Canada, Mexico, Germany, UK, France, Italy, Spain, The Netherlands, Saudi Arabia, UAE, Turkey, Israel, South Africa, Brazil, Argentina and Chile
Competitive landscape Leading Companies, Market Positioning of Companies, Competitive Strategies, and Industry Risks

Request Free Sample

Research Analyst Overview

  • The Game Engines sector is undergoing a profound structural transformation as organizations aggressively shift toward multi-user real-time editing and spatial computing architecture. This technological pivot heavily influences boardroom-level capital expenditure strategies, particularly regarding the deployment of interactive simulation rendering across distributed teams.
  • Executives prioritizing cloud-native engine modules over isolated on-premises hardware have observed a 42% reduction in continuous integration compilation delays. This operational shift directly supports the rapid delivery of immersive multi-user environments and high-fidelity digital twins. Furthermore, integrating neural rendering algorithms and dynamic illumination networks dictates long-term product strategy, enabling automotive and architectural firms to achieve unprecedented visual realism.
  • Addressing complex cross-platform compilation toolsets and hardware abstraction layers remains vital for mitigating technical debt during multi-platform deployment pipelines. Consequently, securing robust version control integration and utilizing universal scene description formats are essential for sustaining synchronized server-authoritative netcode. These sophisticated infrastructure investments guarantee consistent low-level runtime execution, optimizing multi-terabyte project repositories across heterogeneous multi-architecture processors.

What are the Key Data Covered in this Game Engines Market Research and Growth Report?

  • What is the expected growth of the Game Engines Market between 2026 and 2030?

    • USD 7.30 billion, at a CAGR of 22.9%

  • What segmentation does the market report cover?

    • The report is segmented by Genre (Action and adventure, Multiplayer online battle arena, Simulation and sports, Shooter, and Others), Component (Solution, and Services), Deployment (On-premises, and Cloud) and Geography (APAC, North America, Europe, Middle East and Africa, South America)

  • Which regions are analyzed in the report?

    • APAC, North America, Europe, Middle East and Africa and South America

  • What are the key growth drivers and market challenges?

    • Increasing demand for live-service digital infrastructures, High monetization friction and licensing structure volatility

  • Who are the major players in the Game Engines Market?

    • Amazon Web Services Inc., Ambiera e.U., Clickteam LLC, Cocos, Crytek GmbH, Defold Foundation, Epic Games Inc., Gotcha Gotcha Games Inc., Leadwerks Software, NeoAxis Group Ltd., PlayCanvas Inc., Roblox Corp., Scirra Ltd., Solar2D LLC, Stencyl LLC, The Game Creators Ltd., UNIGINE Holding S.a.r.l, Unity Technologies Inc. and YYG Property

Market Research Insights

  • The Game Engines sector is rapidly shifting toward cloud-native engine modules to support dynamic backend server orchestration. By adopting remote collaborative compilation, distributed enterprises have increased asset pipeline efficiency by 28% compared to traditional on-premises workstations. Furthermore, the integration of visual scripting frameworks has democratized application logic creation, leading to a 40% reduction in preliminary code drafting errors.
  • This transition enables organizations to focus on delivering continuous interactive media experiences across heterogeneous hardware configurations. Implementing algorithmic lighting bakes alongside machine learning toolkits allows creators to optimize visual fidelity while lowering energy consumption parameters by 15% across multi-terabyte project repositories.

We can help! Our analysts can customize this game engines market research report to meet your requirements.

Get in touch

1. Executive Summary

1.1 Market overview

Executive Summary - Chart on Market Overview
Executive Summary - Data Table on Market Overview
Executive Summary - Chart on Global Market Characteristics
Executive Summary - Chart on Market by Geography
Executive Summary - Chart on Market Segmentation by Genre
Executive Summary - Chart on Market Segmentation by Component
Executive Summary - Chart on Market Segmentation by Deployment
Executive Summary - Chart on Incremental Growth
Executive Summary - Data Table on Incremental Growth
Executive Summary - Chart on Company Market Positioning

2. Technavio Analysis

2.1 Analysis of price sensitivity, lifecycle, customer purchase basket, adoption rates, and purchase criteria

2.2 Criticality of inputs and Factors of differentiation

Chart on Overview on criticality of inputs and factors of differentiation

2.3 Factors of disruption

Chart on Overview on factors of disruption

2.4 Impact of drivers and challenges

Chart on Impact of drivers and challenges in 2025 and 2030

3. Market Landscape

3.1 Market ecosystem

Chart on Parent Market
Data Table on - Parent Market

3.2 Market characteristics

Chart on Market characteristics analysis

3.3 Value chain analysis

Chart on Value chain analysis

4. Market Sizing

4.1 Market definition

Data Table on Offerings of companies included in the market definition

4.2 Market segment analysis

Market segments

4.3 Market size 2025

4.4 Market outlook: Forecast for 2025-2030

Chart on Global - Market size and forecast 2025-2030 ($ million)
Data Table on Global - Market size and forecast 2025-2030 ($ million)
Chart on Global Market: Year-over-year growth 2025-2030 (%)
Data Table on Global Market: Year-over-year growth 2025-2030 (%)

5. Historic Market Size

5.1 Global Game Engines Market 2020 - 2024

Historic Market Size - Data Table on Global Game Engines Market 2020 - 2024 ($ million)

5.2 Genre segment analysis 2020 - 2024

Historic Market Size - Genre Segment 2020 - 2024 ($ million)

5.3 Component segment analysis 2020 - 2024

Historic Market Size - Component Segment 2020 - 2024 ($ million)

5.4 Deployment segment analysis 2020 - 2024

Historic Market Size - Deployment Segment 2020 - 2024 ($ million)

5.5 Geography segment analysis 2020 - 2024

Historic Market Size - Geography Segment 2020 - 2024 ($ million)

5.6 Country segment analysis 2020 - 2024

Historic Market Size - Country Segment 2020 - 2024 ($ million)

6. Qualitative Analysis

6.1 Impact of AI in Global Game Engines Market

6.2 Geopolitical Conflicts on Global Game Engines Market

7. Five Forces Analysis

7.1 Five forces summary

Five forces analysis - Comparison between 2025 and 2030

7.2 Bargaining power of buyers

Bargaining power of buyers - Impact of key factors 2025 and 2030

7.3 Bargaining power of suppliers

Bargaining power of suppliers - Impact of key factors in 2025 and 2030

7.4 Threat of new entrants

Threat of new entrants - Impact of key factors in 2025 and 2030

7.5 Threat of substitutes

Threat of substitutes - Impact of key factors in 2025 and 2030

7.6 Threat of rivalry

Threat of rivalry - Impact of key factors in 2025 and 2030

7.7 Market condition

Chart on Market condition - Five forces 2025 and 2030

8. Market Segmentation by Genre

8.1 Market segments

Chart on Genre - Market share 2025-2030 (%)
Data Table on Genre - Market share 2025-2030 (%)

8.2 Comparison by Genre

Chart on Comparison by Genre
Data Table on Comparison by Genre

8.3 Action and adventure - Market size and forecast 2025-2030

Chart on Action and adventure - Market size and forecast 2025-2030 ($ million)
Data Table on Action and adventure - Market size and forecast 2025-2030 ($ million)
Chart on Action and adventure - Year-over-year growth 2025-2030 (%)
Data Table on Action and adventure - Year-over-year growth 2025-2030 (%)

8.4 Multiplayer online battle arena - Market size and forecast 2025-2030

Chart on Multiplayer online battle arena - Market size and forecast 2025-2030 ($ million)
Data Table on Multiplayer online battle arena - Market size and forecast 2025-2030 ($ million)
Chart on Multiplayer online battle arena - Year-over-year growth 2025-2030 (%)
Data Table on Multiplayer online battle arena - Year-over-year growth 2025-2030 (%)

8.5 Simulation and sports - Market size and forecast 2025-2030

Chart on Simulation and sports - Market size and forecast 2025-2030 ($ million)
Data Table on Simulation and sports - Market size and forecast 2025-2030 ($ million)
Chart on Simulation and sports - Year-over-year growth 2025-2030 (%)
Data Table on Simulation and sports - Year-over-year growth 2025-2030 (%)

8.6 Shooter - Market size and forecast 2025-2030

Chart on Shooter - Market size and forecast 2025-2030 ($ million)
Data Table on Shooter - Market size and forecast 2025-2030 ($ million)
Chart on Shooter - Year-over-year growth 2025-2030 (%)
Data Table on Shooter - Year-over-year growth 2025-2030 (%)

8.7 Others - Market size and forecast 2025-2030

Chart on Others - Market size and forecast 2025-2030 ($ million)
Data Table on Others - Market size and forecast 2025-2030 ($ million)
Chart on Others - Year-over-year growth 2025-2030 (%)
Data Table on Others - Year-over-year growth 2025-2030 (%)

8.8 Market opportunity by Genre

Market opportunity by Genre ($ million)
Data Table on Market opportunity by Genre ($ million)

9. Market Segmentation by Component

9.1 Market segments

Chart on Component - Market share 2025-2030 (%)
Data Table on Component - Market share 2025-2030 (%)

9.2 Comparison by Component

Chart on Comparison by Component
Data Table on Comparison by Component

9.3 Solution - Market size and forecast 2025-2030

Chart on Solution - Market size and forecast 2025-2030 ($ million)
Data Table on Solution - Market size and forecast 2025-2030 ($ million)
Chart on Solution - Year-over-year growth 2025-2030 (%)
Data Table on Solution - Year-over-year growth 2025-2030 (%)

9.4 Services - Market size and forecast 2025-2030

Chart on Services - Market size and forecast 2025-2030 ($ million)
Data Table on Services - Market size and forecast 2025-2030 ($ million)
Chart on Services - Year-over-year growth 2025-2030 (%)
Data Table on Services - Year-over-year growth 2025-2030 (%)

9.5 Market opportunity by Component

Market opportunity by Component ($ million)
Data Table on Market opportunity by Component ($ million)

10. Market Segmentation by Deployment

10.1 Market segments

Chart on Deployment - Market share 2025-2030 (%)
Data Table on Deployment - Market share 2025-2030 (%)

10.2 Comparison by Deployment

Chart on Comparison by Deployment
Data Table on Comparison by Deployment

10.3 On-premises - Market size and forecast 2025-2030

Chart on On-premises - Market size and forecast 2025-2030 ($ million)
Data Table on On-premises - Market size and forecast 2025-2030 ($ million)
Chart on On-premises - Year-over-year growth 2025-2030 (%)
Data Table on On-premises - Year-over-year growth 2025-2030 (%)

10.4 Cloud - Market size and forecast 2025-2030

Chart on Cloud - Market size and forecast 2025-2030 ($ million)
Data Table on Cloud - Market size and forecast 2025-2030 ($ million)
Chart on Cloud - Year-over-year growth 2025-2030 (%)
Data Table on Cloud - Year-over-year growth 2025-2030 (%)

10.5 Market opportunity by Deployment

Market opportunity by Deployment ($ million)
Data Table on Market opportunity by Deployment ($ million)

11. Customer Landscape

11.1 Customer landscape overview

Analysis of price sensitivity, lifecycle, customer purchase basket, adoption rates, and purchase criteria

12. Geographic Landscape

12.1 Geographic segmentation

Chart on Market share by geography 2025-2030 (%)
Data Table on Market share by geography 2025-2030 (%)

12.2 Geographic comparison

Chart on Geographic comparison
Data Table on Geographic comparison

12.3 APAC - Market size and forecast 2025-2030

Chart on APAC - Market size and forecast 2025-2030 ($ million)
Data Table on APAC - Market size and forecast 2025-2030 ($ million)
Chart on APAC - Year-over-year growth 2025-2030 (%)
Data Table on APAC - Year-over-year growth 2025-2030 (%)
Chart on Regional Comparison - APAC
Data Table on Regional Comparison - APAC

12.3.1 China - Market size and forecast 2025-2030

Chart on China - Market size and forecast 2025-2030 ($ million)
Data Table on China - Market size and forecast 2025-2030 ($ million)
Chart on China - Year-over-year growth 2025-2030 (%)
Data Table on China - Year-over-year growth 2025-2030 (%)

12.3.2 Japan - Market size and forecast 2025-2030

Chart on Japan - Market size and forecast 2025-2030 ($ million)
Data Table on Japan - Market size and forecast 2025-2030 ($ million)
Chart on Japan - Year-over-year growth 2025-2030 (%)
Data Table on Japan - Year-over-year growth 2025-2030 (%)

12.3.3 South Korea - Market size and forecast 2025-2030

Chart on South Korea - Market size and forecast 2025-2030 ($ million)
Data Table on South Korea - Market size and forecast 2025-2030 ($ million)
Chart on South Korea - Year-over-year growth 2025-2030 (%)
Data Table on South Korea - Year-over-year growth 2025-2030 (%)

12.3.4 India - Market size and forecast 2025-2030

Chart on India - Market size and forecast 2025-2030 ($ million)
Data Table on India - Market size and forecast 2025-2030 ($ million)
Chart on India - Year-over-year growth 2025-2030 (%)
Data Table on India - Year-over-year growth 2025-2030 (%)

12.3.5 Australia - Market size and forecast 2025-2030

Chart on Australia - Market size and forecast 2025-2030 ($ million)
Data Table on Australia - Market size and forecast 2025-2030 ($ million)
Chart on Australia - Year-over-year growth 2025-2030 (%)
Data Table on Australia - Year-over-year growth 2025-2030 (%)

12.3.6 Indonesia - Market size and forecast 2025-2030

Chart on Indonesia - Market size and forecast 2025-2030 ($ million)
Data Table on Indonesia - Market size and forecast 2025-2030 ($ million)
Chart on Indonesia - Year-over-year growth 2025-2030 (%)
Data Table on Indonesia - Year-over-year growth 2025-2030 (%)

12.4 North America - Market size and forecast 2025-2030

Chart on North America - Market size and forecast 2025-2030 ($ million)
Data Table on North America - Market size and forecast 2025-2030 ($ million)
Chart on North America - Year-over-year growth 2025-2030 (%)
Data Table on North America - Year-over-year growth 2025-2030 (%)
Chart on Regional Comparison - North America
Data Table on Regional Comparison - North America

12.4.1 US - Market size and forecast 2025-2030

Chart on US - Market size and forecast 2025-2030 ($ million)
Data Table on US - Market size and forecast 2025-2030 ($ million)
Chart on US - Year-over-year growth 2025-2030 (%)
Data Table on US - Year-over-year growth 2025-2030 (%)

12.4.2 Canada - Market size and forecast 2025-2030

Chart on Canada - Market size and forecast 2025-2030 ($ million)
Data Table on Canada - Market size and forecast 2025-2030 ($ million)
Chart on Canada - Year-over-year growth 2025-2030 (%)
Data Table on Canada - Year-over-year growth 2025-2030 (%)

12.4.3 Mexico - Market size and forecast 2025-2030

Chart on Mexico - Market size and forecast 2025-2030 ($ million)
Data Table on Mexico - Market size and forecast 2025-2030 ($ million)
Chart on Mexico - Year-over-year growth 2025-2030 (%)
Data Table on Mexico - Year-over-year growth 2025-2030 (%)

12.5 Europe - Market size and forecast 2025-2030

Chart on Europe - Market size and forecast 2025-2030 ($ million)
Data Table on Europe - Market size and forecast 2025-2030 ($ million)
Chart on Europe - Year-over-year growth 2025-2030 (%)
Data Table on Europe - Year-over-year growth 2025-2030 (%)
Chart on Regional Comparison - Europe
Data Table on Regional Comparison - Europe

12.5.1 Germany - Market size and forecast 2025-2030

Chart on Germany - Market size and forecast 2025-2030 ($ million)
Data Table on Germany - Market size and forecast 2025-2030 ($ million)
Chart on Germany - Year-over-year growth 2025-2030 (%)
Data Table on Germany - Year-over-year growth 2025-2030 (%)

12.5.2 UK - Market size and forecast 2025-2030

Chart on UK - Market size and forecast 2025-2030 ($ million)
Data Table on UK - Market size and forecast 2025-2030 ($ million)
Chart on UK - Year-over-year growth 2025-2030 (%)
Data Table on UK - Year-over-year growth 2025-2030 (%)

12.5.3 France - Market size and forecast 2025-2030

Chart on France - Market size and forecast 2025-2030 ($ million)
Data Table on France - Market size and forecast 2025-2030 ($ million)
Chart on France - Year-over-year growth 2025-2030 (%)
Data Table on France - Year-over-year growth 2025-2030 (%)

12.5.4 Italy - Market size and forecast 2025-2030

Chart on Italy - Market size and forecast 2025-2030 ($ million)
Data Table on Italy - Market size and forecast 2025-2030 ($ million)
Chart on Italy - Year-over-year growth 2025-2030 (%)
Data Table on Italy - Year-over-year growth 2025-2030 (%)

12.5.5 Spain - Market size and forecast 2025-2030

Chart on Spain - Market size and forecast 2025-2030 ($ million)
Data Table on Spain - Market size and forecast 2025-2030 ($ million)
Chart on Spain - Year-over-year growth 2025-2030 (%)
Data Table on Spain - Year-over-year growth 2025-2030 (%)

12.5.6 The Netherlands - Market size and forecast 2025-2030

Chart on The Netherlands - Market size and forecast 2025-2030 ($ million)
Data Table on The Netherlands - Market size and forecast 2025-2030 ($ million)
Chart on The Netherlands - Year-over-year growth 2025-2030 (%)
Data Table on The Netherlands - Year-over-year growth 2025-2030 (%)

12.6 Middle East and Africa - Market size and forecast 2025-2030

Chart on Middle East and Africa - Market size and forecast 2025-2030 ($ million)
Data Table on Middle East and Africa - Market size and forecast 2025-2030 ($ million)
Chart on Middle East and Africa - Year-over-year growth 2025-2030 (%)
Data Table on Middle East and Africa - Year-over-year growth 2025-2030 (%)
Chart on Regional Comparison - Middle East and Africa
Data Table on Regional Comparison - Middle East and Africa

12.6.1 Saudi Arabia - Market size and forecast 2025-2030

Chart on Saudi Arabia - Market size and forecast 2025-2030 ($ million)
Data Table on Saudi Arabia - Market size and forecast 2025-2030 ($ million)
Chart on Saudi Arabia - Year-over-year growth 2025-2030 (%)
Data Table on Saudi Arabia - Year-over-year growth 2025-2030 (%)

12.6.2 UAE - Market size and forecast 2025-2030

Chart on UAE - Market size and forecast 2025-2030 ($ million)
Data Table on UAE - Market size and forecast 2025-2030 ($ million)
Chart on UAE - Year-over-year growth 2025-2030 (%)
Data Table on UAE - Year-over-year growth 2025-2030 (%)

12.6.3 Turkey - Market size and forecast 2025-2030

Chart on Turkey - Market size and forecast 2025-2030 ($ million)
Data Table on Turkey - Market size and forecast 2025-2030 ($ million)
Chart on Turkey - Year-over-year growth 2025-2030 (%)
Data Table on Turkey - Year-over-year growth 2025-2030 (%)

12.6.4 Israel - Market size and forecast 2025-2030

Chart on Israel - Market size and forecast 2025-2030 ($ million)
Data Table on Israel - Market size and forecast 2025-2030 ($ million)
Chart on Israel - Year-over-year growth 2025-2030 (%)
Data Table on Israel - Year-over-year growth 2025-2030 (%)

12.6.5 South Africa - Market size and forecast 2025-2030

Chart on South Africa - Market size and forecast 2025-2030 ($ million)
Data Table on South Africa - Market size and forecast 2025-2030 ($ million)
Chart on South Africa - Year-over-year growth 2025-2030 (%)
Data Table on South Africa - Year-over-year growth 2025-2030 (%)

12.7 South America - Market size and forecast 2025-2030

Chart on South America - Market size and forecast 2025-2030 ($ million)
Data Table on South America - Market size and forecast 2025-2030 ($ million)
Chart on South America - Year-over-year growth 2025-2030 (%)
Data Table on South America - Year-over-year growth 2025-2030 (%)
Chart on Regional Comparison - South America
Data Table on Regional Comparison - South America

12.7.1 Brazil - Market size and forecast 2025-2030

Chart on Brazil - Market size and forecast 2025-2030 ($ million)
Data Table on Brazil - Market size and forecast 2025-2030 ($ million)
Chart on Brazil - Year-over-year growth 2025-2030 (%)
Data Table on Brazil - Year-over-year growth 2025-2030 (%)

12.7.2 Argentina - Market size and forecast 2025-2030

Chart on Argentina - Market size and forecast 2025-2030 ($ million)
Data Table on Argentina - Market size and forecast 2025-2030 ($ million)
Chart on Argentina - Year-over-year growth 2025-2030 (%)
Data Table on Argentina - Year-over-year growth 2025-2030 (%)

12.7.3 Chile - Market size and forecast 2025-2030

Chart on Chile - Market size and forecast 2025-2030 ($ million)
Data Table on Chile - Market size and forecast 2025-2030 ($ million)
Chart on Chile - Year-over-year growth 2025-2030 (%)
Data Table on Chile - Year-over-year growth 2025-2030 (%)

12.8 Market opportunity by geography

Market opportunity by geography ($ million)
Data Tables on Market opportunity by geography ($ million)

13. Drivers, Challenges, and Opportunity

13.1 Market drivers

Increasing demand for live-service digital infrastructures
Proliferation of real-time visualization across non-gaming enterprise sectors
Advanced graphical fidelity across global markets

13.2 Market challenges

High monetization friction and licensing structure volatility
Cross platform optimization constraints and hardware fragmentations
Shortages of specialized engine software engineers

13.3 Impact of drivers and challenges

Impact of drivers and challenges in 2025 and 2030

13.4 Market opportunities

Expansion of cloud-native infrastructure
AI and automated asset synthesis pipelines
Convergence of game engine architectures

14. Competitive Landscape

14.1 Overview

14.2

Overview on criticality of inputs and factors of differentiation

14.3 Landscape disruption

Overview on factors of disruption

14.4 Industry risks

Impact of key risks on business

15. Competitive Analysis

15.1 Companies profiled

Companies covered

15.2 Company ranking index

15.3 Market positioning of companies

Matrix on companies position and classification

15.4 Amazon Web Services Inc.

Amazon Web Services Inc. - Overview
Amazon Web Services Inc. - Product / Service
Amazon Web Services Inc. - Key offerings
SWOT

15.5 Ambiera e.U.

Ambiera e.U. - Overview
Ambiera e.U. - Product / Service
Ambiera e.U. - Key offerings
SWOT

15.6 Clickteam LLC

Clickteam LLC - Overview
Clickteam LLC - Product / Service
Clickteam LLC - Key offerings
SWOT

15.7 Cocos

Cocos - Overview
Cocos - Product / Service
Cocos - Key offerings
SWOT

15.8 Crytek GmbH

Crytek GmbH - Overview
Crytek GmbH - Product / Service
Crytek GmbH - Key offerings
SWOT

15.9 Epic Games Inc.

Epic Games Inc. - Overview
Epic Games Inc. - Product / Service
Epic Games Inc. - Key offerings
SWOT

15.10 Gotcha Gotcha Games Inc.

Gotcha Gotcha Games Inc. - Overview
Gotcha Gotcha Games Inc. - Product / Service
Gotcha Gotcha Games Inc. - Key offerings
SWOT

15.11 NeoAxis Group Ltd.

NeoAxis Group Ltd. - Overview
NeoAxis Group Ltd. - Product / Service
NeoAxis Group Ltd. - Key offerings
SWOT

15.12 Roblox Corp.

Roblox Corp. - Overview
Roblox Corp. - Product / Service
Roblox Corp. - Key offerings
SWOT

15.13 Scirra Ltd.

Scirra Ltd. - Overview
Scirra Ltd. - Product / Service
Scirra Ltd. - Key offerings
SWOT

15.14 Solar2D LLC

Solar2D LLC - Overview
Solar2D LLC - Product / Service
Solar2D LLC - Key offerings
SWOT

15.15 Stencyl LLC

Stencyl LLC - Overview
Stencyl LLC - Product / Service
Stencyl LLC - Key offerings
SWOT

15.16 The Game Creators Ltd.

The Game Creators Ltd. - Overview
The Game Creators Ltd. - Product / Service
The Game Creators Ltd. - Key offerings
SWOT

15.17 Unity Technologies Inc.

Unity Technologies Inc. - Overview
Unity Technologies Inc. - Business segments
Unity Technologies Inc. - Key offerings
Unity Technologies Inc. - Segment focus
SWOT

15.18 YYG Property

YYG Property - Overview
YYG Property - Product / Service
YYG Property - Key offerings
SWOT

16. Appendix

16.1 Scope of the report

Market definition
Objectives
Notes and caveats

16.2 Inclusions and exclusions checklist

Inclusions checklist
Exclusions checklist

16.3 Currency conversion rates for US$

16.4 Research methodology

16.5 Data procurement

Information sources

16.6 Data validation

16.7 Validation techniques employed for market sizing

16.8 Data synthesis

16.9 360 degree market analysis

16.10 List of abbreviations

Research Methodology

Technavio presents a detailed picture of the market by way of study, synthesis, and summation of data from multiple sources. The analysts have presented the various facets of the market with a particular focus on identifying the key industry influencers. The data thus presented is comprehensive, reliable, and the result of extensive research, both primary and secondary.

INFORMATION SOURCES

Primary sources

  • Manufacturers and suppliers
  • Channel partners
  • Industry experts
  • Strategic decision makers

Secondary sources

  • Industry journals and periodicals
  • Government data
  • Financial reports of key industry players
  • Historical data
  • Press releases

DATA ANALYSIS

Data Synthesis

  • Collation of data
  • Estimation of key figures
  • Analysis of derived insights

Data Validation

  • Triangulation with data models
  • Reference against proprietary databases
  • Corroboration with industry experts

REPORT WRITING

Qualitative

  • Market drivers
  • Market challenges
  • Market trends
  • Five forces analysis

Quantitative

  • Market size and forecast
  • Market segmentation
  • Geographical insights
  • Competitive landscape

Interested in this report?

Get your sample now to see our research methodology and insights!

Download Now

Frequently Asked Questions

Game Engines market growth will increase by USD 7302.5 million during 2026-2030.

The Game Engines market is expected to grow at a CAGR of 22.9% during 2026-2030.

Game Engines market is segmented by Genre (Action and adventure, Multiplayer online battle arena, Simulation and sports, Shooter, Others) Component (Solution, Services) Deployment (On-premises, Cloud)

Amazon Web Services Inc., Ambiera e.U., Clickteam LLC, Cocos, Crytek GmbH, Defold Foundation, Epic Games Inc., Gotcha Gotcha Games Inc., Leadwerks Software, NeoAxis Group Ltd., PlayCanvas Inc., Roblox Corp., Scirra Ltd., Solar2D LLC, Stencyl LLC, The Game Creators Ltd., UNIGINE Holding S.a.r.l, Unity Technologies Inc., YYG Property are a few of the key vendors in the Game Engines market.

APAC will register the highest growth rate of 30.3% among the other regions. Therefore, the Game Engines market in APAC is expected to garner significant business opportunities for the vendors during the forecast period.

China, Japan, South Korea, India, Australia, Indonesia, US, Canada, Mexico, Germany, UK, France, Italy, Spain, The Netherlands, Saudi Arabia, UAE, Turkey, Israel, South Africa, Brazil, Argentina, Chile

  • Increasing demand for live-service digital infrastructures is the driving factor this market.

The Game Engines market vendors should focus on grabbing business opportunities from the Genre segment as it accounted for the largest market share in the base year.
RIA - Research AI Assistant
Ask RIA
