Food Industry Vacuum Cooling Equipment Market Analysis, Size, and Forecast 2026-2030: Europe (Germany, UK, and France), APAC (China, Japan, and India), North America (US, Canada, and Mexico), South America (Brazil, Argentina, and Chile), Middle East and Africa (Saudi Arabia, UAE, and South Africa), and Rest of World (ROW)

Food Industry Vacuum Cooling Equipment Market Analysis, Size, and Forecast 2026-2030:
Europe (Germany, UK, and France), APAC (China, Japan, and India), North America (US, Canada, and Mexico), South America (Brazil, Argentina, and Chile), Middle East and Africa (Saudi Arabia, UAE, and South Africa), and Rest of World (ROW)

Published: Nov 2026 294 Pages SKU: IRTNTR43233

Market Overview at a Glance

$7.58 Mn
Market Opportunity
3.9%
CAGR 2025 - 2030
38.3%
Europe Growth
$29.41 Mn
Air cooled vacuum cooler segment 2024

Food Industry Vacuum Cooling Equipment Market Size 2026-2030

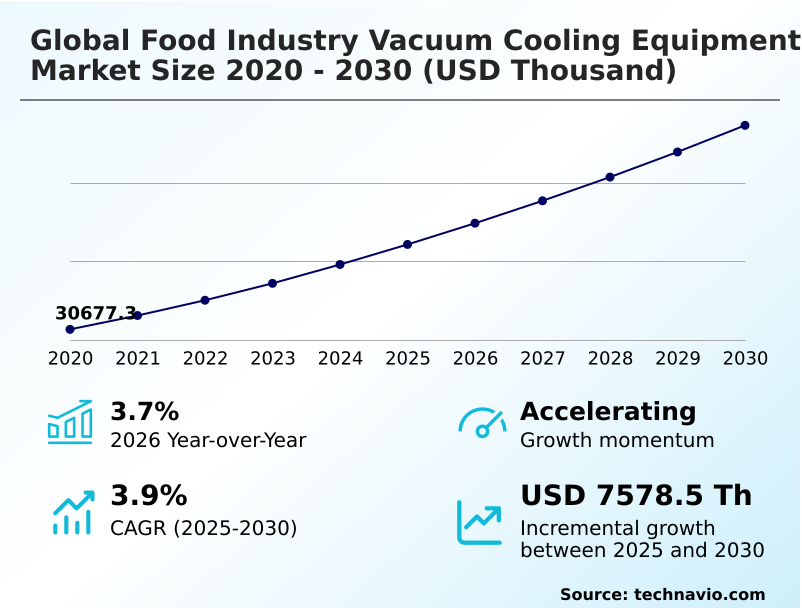
The food industry vacuum cooling equipment market size is valued to increase by USD 7.58 million, at a CAGR of 3.9% from 2025 to 2030. Rapid expansion of commercial bakery operations and industrial batch efficiency needs will drive the food industry vacuum cooling equipment market.

Major Market Trends & Insights

  • Europe dominated the market and accounted for a 38.3% growth during the forecast period.
  • By Type - Air cooled vacuum cooler segment was valued at USD 29.41 million in 2024
  • By Application - Baked products segment accounted for the largest market revenue share in 2024

Market Size & Forecast

  • Market Opportunities:
  • Market Future Opportunities: USD 7.58 million
  • CAGR from 2025 to 2030 : 3.9%

Market Summary

  • The Food Industry Vacuum Cooling Equipment Market demonstrates robust structural expansion driven by the necessity for accelerated thermal processing and stringent food safety compliance. In large-scale commercial bakery operations, traditional ambient cooling methods create severe production bottlenecks, occupying extensive floor space and delaying packaging operations.
  • By transitioning to rapid vacuum depressurization chambers, industrial bakeries can drastically reduce batch cooling duration from several hours to under twenty minutes, achieving a 65% improvement in processing throughput compared to conventional spiral cooling towers. This acceleration effectively prevents internal condensation and structural collapse, extending product shelf life.
  • The rapid expansion of commercial bakery operations and industrial batch efficiency needs acts as a primary market driver. Conversely, high initial capital outlays and facility modification costs, such as specialized plumbing and grid upgrades, present a formidable challenge for mid-tier processors operating on tight margins.
  • As cold chain logistics modernize, the integration of energy-optimized vacuum cooling machinery serves as a vital operational catalyst for achieving sustainable, high-throughput food manufacturing globally.

What will be the Size of the Food Industry Vacuum Cooling Equipment Market during the forecast period?
Get Key Insights on Market Forecast (PDF) Get Free Sample

How is the Food Industry Vacuum Cooling Equipment Market Segmented?

The food industry vacuum cooling equipment industry research report provides comprehensive data (region-wise segment analysis), with forecasts and estimates in "USD thousand" for the period 2026-2030, as well as historical data from 2020-2024 for the following segments.

  • Type
    • Air cooled vacuum cooler
    • Water cooled vacuum cooler
  • Application
    • Baked products
    • Meat products
    • Fruits and vegetables
    • Readymade food
  • Product type
    • Vertical
    • Horizontal
  • Geography
    • Europe
      • Germany
      • UK
      • France
      • Italy
      • Spain
      • The Netherlands
    • APAC
      • China
      • Japan
      • India
      • South Korea
      • Australia
      • Indonesia
    • North America
      • US
      • Canada
      • Mexico
    • South America
      • Brazil
      • Argentina
      • Chile
    • Middle East and Africa
      • Saudi Arabia
      • UAE
      • South Africa
      • Israel
      • Turkey

By Type Insights

The air cooled vacuum cooler segment is estimated to witness significant growth during the forecast period.

The air cooled segment represents a pivotal architectural approach for commercial bakery processing and perishable horticultural crop preservation operations lacking continuous water utility infrastructure.

Relying on integrated condenser coils, this equipment executes rapid thermal dissipation driven by the flash evaporation principle. By eliminating complex piping networks, facilities enhance structural integrity maintenance while enabling automated inline rapid chilling of dense product batches.

Advancements in variable frequency drive technology and smart pressure sensor integration allow these systems to achieve a 15% improvement in thermal extraction efficiency during peak seasonal cycles.

This operational independence optimizes post-harvest field heat removal across remote agricultural packing houses, significantly advancing industrial grid dependency reduction associated with traditional refrigeration overheads.
Get Free Sample

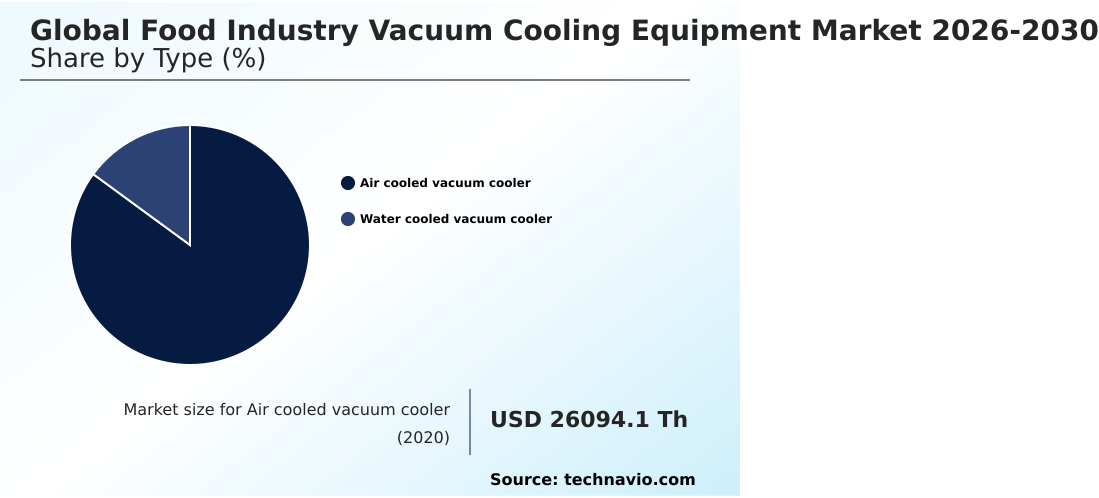
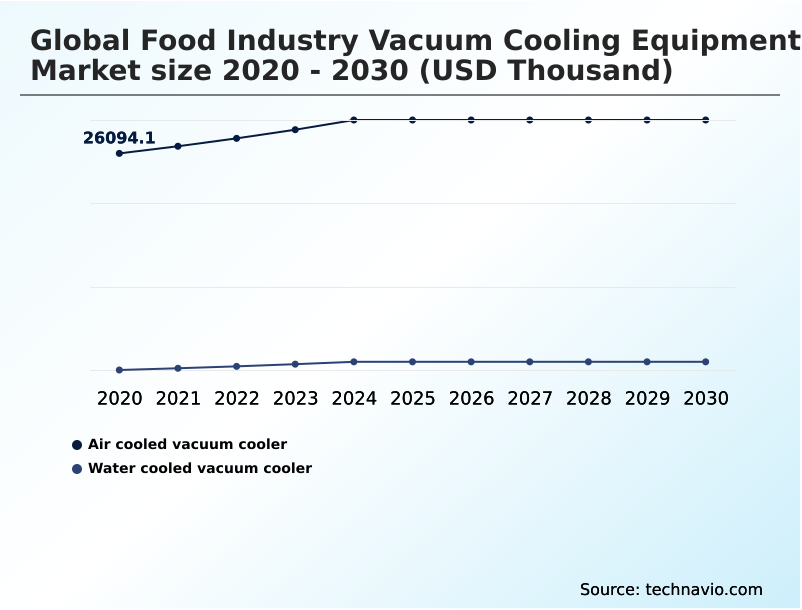
The Air cooled vacuum cooler segment was valued at USD 29.41 million in 2024 and showed a gradual increase during the forecast period.
Get Free Sample

Regional Analysis

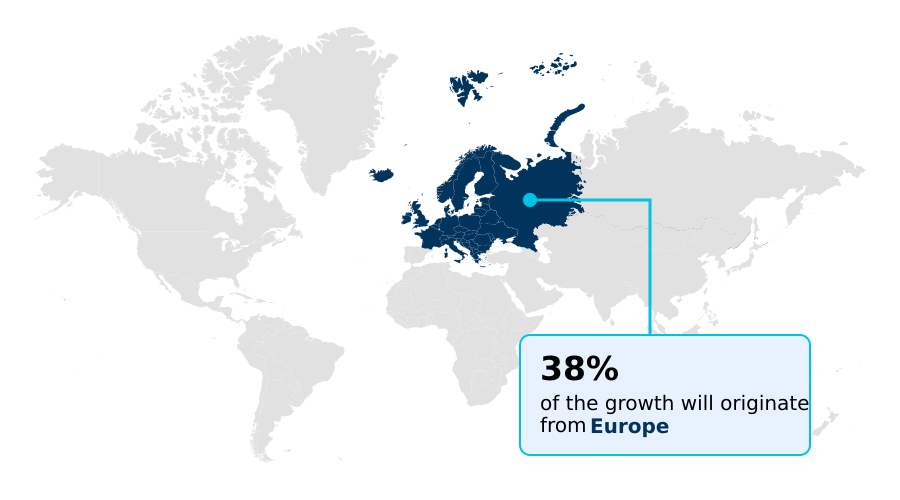
Europe is estimated to contribute 38.3% to the growth of the global market during the forecast period.Technavio’s analysts have elaborately explained the regional trends and drivers that shape the market during the forecast period.
See How Food Industry Vacuum Cooling Equipment Market Demand is Rising in Europe Get Free Sample

Europe maintains a commanding 38.3% regional superiority in the Food Industry Vacuum Cooling Equipment landscape compared to North America, driven by aggressive ecological directives and high-density artisanal bread production.

European processors lead the transition toward low-GWP refrigerant utilization and advanced water-loop heat recovery circuit implementation, yielding a 19% reduction in total facility utility expenditures.

Meanwhile, the APAC region exhibits surging adoption of condensate filtration system networks to support high-throughput ready-to-eat meal preparation and commercial meat processing yield enhancement.

This distinct regional divergence underscores how European operators prioritize cellular turgor pressure preservation for premium agricultural exports, while Asian markets heavily emphasize industrial batch efficiency optimization to accommodate rapid urban consumption growth and modernizing cold chain logistics networks.

Market Dynamics

Our researchers analyzed the data with 2025 as the base year, along with the key drivers, trends, and challenges. A holistic analysis of drivers will help companies refine their marketing strategies to gain a competitive advantage.

  • Optimizing thermal management infrastructure remains a top priority for enterprise food manufacturers seeking to eliminate processing bottlenecks and ensure stringent quality compliance. The implementation of automated inline commercial bakery chilling architectures represents a critical operational shift, allowing high-volume facilities to seamlessly integrate rapid cooling directly into continuous oven production workflows.
  • This strategic alignment minimizes manual handling and achieves up to a 35% enhancement in daily throughput efficiency compared to legacy ambient cooling racks. Within this framework, achieving precise flash evaporation crumb moisture stabilization is paramount for preserving the structural integrity and crust crispness of artisanal breads and pastries.
  • Beyond the bakery sector, agricultural packing houses are aggressively deploying advanced pre-cooling systems to combat post-harvest leafy green thermal degradation, which otherwise accelerates enzymatic decay and cellular wilting. By immediately removing field heat, growers significantly extend the viable shelf life of perishable horticultural crops during long-distance transit.
  • To manage the high energy demands associated with rapid depressurization, modern facilities are increasingly incorporating closed loop hydronic heat recovery mechanisms that capture and repurpose waste thermal energy for facility heating or sanitation washdown processes.
  • Furthermore, the adoption of variable frequency dry screw depressurization technology provides precise control over chamber evacuation rates, allowing plant operators to fine-tune energy consumption based on specific batch densities. These engineered integrations ensure that commercial food operators can simultaneously achieve rigorous sustainability benchmarks, lower utility expenditures, and maintain superior product quality across diverse global supply chains.
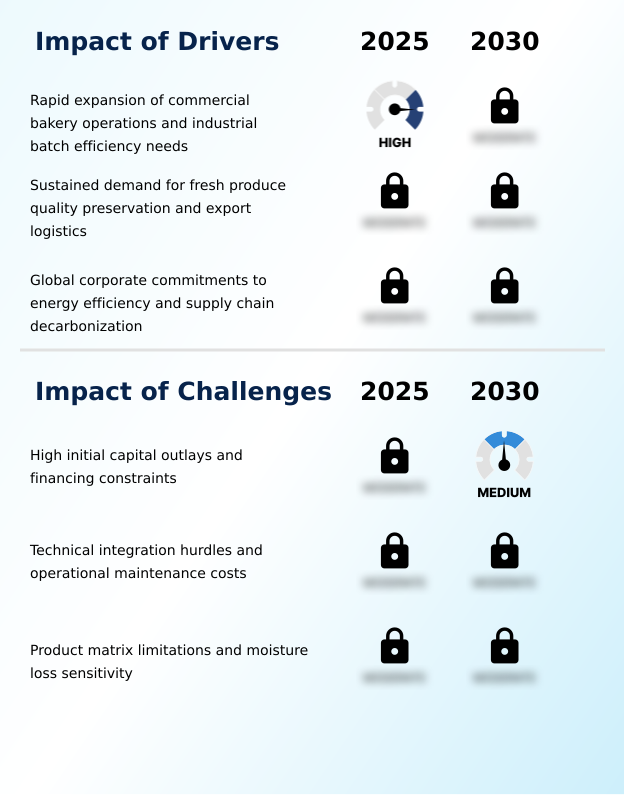
What are the key market drivers leading to the rise in the adoption of Food Industry Vacuum Cooling Equipment Industry?

  • The rapid expansion of commercial bakery operations and the critical need for industrial batch efficiency serve as primary drivers accelerating market growth.

  • Surging corporate commitments to sustainability and processing velocity are forcefully propelling Food Industry Vacuum Cooling Equipment adoption across enterprise food manufacturing.
  • The critical necessity to satisfy stringent supply chain decarbonization mandate requirements drives facilities to harness evaporative latent heat absorption, utilizing variable speed drive vacuum pump modules and internal ice-condenser system designs to minimize electrical consumption.
  • High-volume industrial baking facilities integrating continuous oven production line workflows achieve up to a 28% reduction in batch cooling duration.
  • This acceleration is heavily supported by hygienic stainless steel chamber deployment equipped with advanced programmable logic controller units and automated pressure release valve networks.
  • Consequently, these structural upgrades directly facilitate tangible greenhouse gas emission reduction goals, transforming compliance pressures into measurable operational profitability and accelerated production throughput.

What are the market trends shaping the Food Industry Vacuum Cooling Equipment Industry?

  • Surging global demand for fresh perishable foodstuff constitutes a pivotal trend shaping the market landscape. This shift increasingly compels commercial food processors to adopt rapid thermal management technologies.

  • A profound structural shift is redefining the Food Industry Vacuum Cooling Equipment landscape as processors prioritize advanced thermodynamic pressure reduction to safeguard perishable commodities. The rapid expansion of globalized fresh produce trade and long-distance refrigerated transit demands sophisticated solutions like hydronic misting technology and high-capacity pallet chilling to minimize mass loss.
  • Concurrently, institutional catering facility operation and bakery sectors increasingly leverage closed loop heat recovery system integration and automated energy recovery circuit configurations to accelerate crumb structure stabilization. By transitioning to these intelligent architectures, agricultural distributors have improved moisture retention efficiency by 22%.
  • This modernization of cold chain logistic infrastructure directly mitigates post-harvest deterioration, enabling commercial food operators to align high-throughput processing speed with stringent international freshness standards.

What challenges does the Food Industry Vacuum Cooling Equipment Industry face during its growth?

  • High initial capital outlays and associated financing constraints present a significant challenge limiting broader industry growth.

  • Complex technical integration hurdles and intensive preventative maintenance overheads continually challenge broad Food Industry Vacuum Cooling Equipment deployment within automated manufacturing facilities. Optimizing systems for cellular breakdown prevention and leafy green thermal degradation requires precise calibration of oil-free dry vacuum pump, liquid ring vacuum pump, and dry screw vacuum pump architectures.
  • Plant engineers frequently face operational bottlenecks when attempting automated conveyor routing synchronization and robotic loading automation with legacy packaging lines. Furthermore, continuous wear on critical components like rotary vane vacuum pump mechanisms and elastomer door gasket seals demands rigorous servicing protocols to maintain hermetic integrity.
  • Despite these mechanical constraints, facilities implementing predictive maintenance sensors have reduced unplanned downtime by 14%, ensuring consistent post-harvest agricultural loss mitigation without jeopardizing perishable batch yields.

Exclusive Technavio Analysis on Customer Landscape

The food industry vacuum cooling equipment market forecasting report includes the adoption lifecycle of the market, covering from the innovator’s stage to the laggard’s stage. It focuses on adoption rates in different regions based on penetration. Furthermore, the food industry vacuum cooling equipment market report also includes key purchase criteria and drivers of price sensitivity to help companies evaluate and develop their market growth analysis strategies.
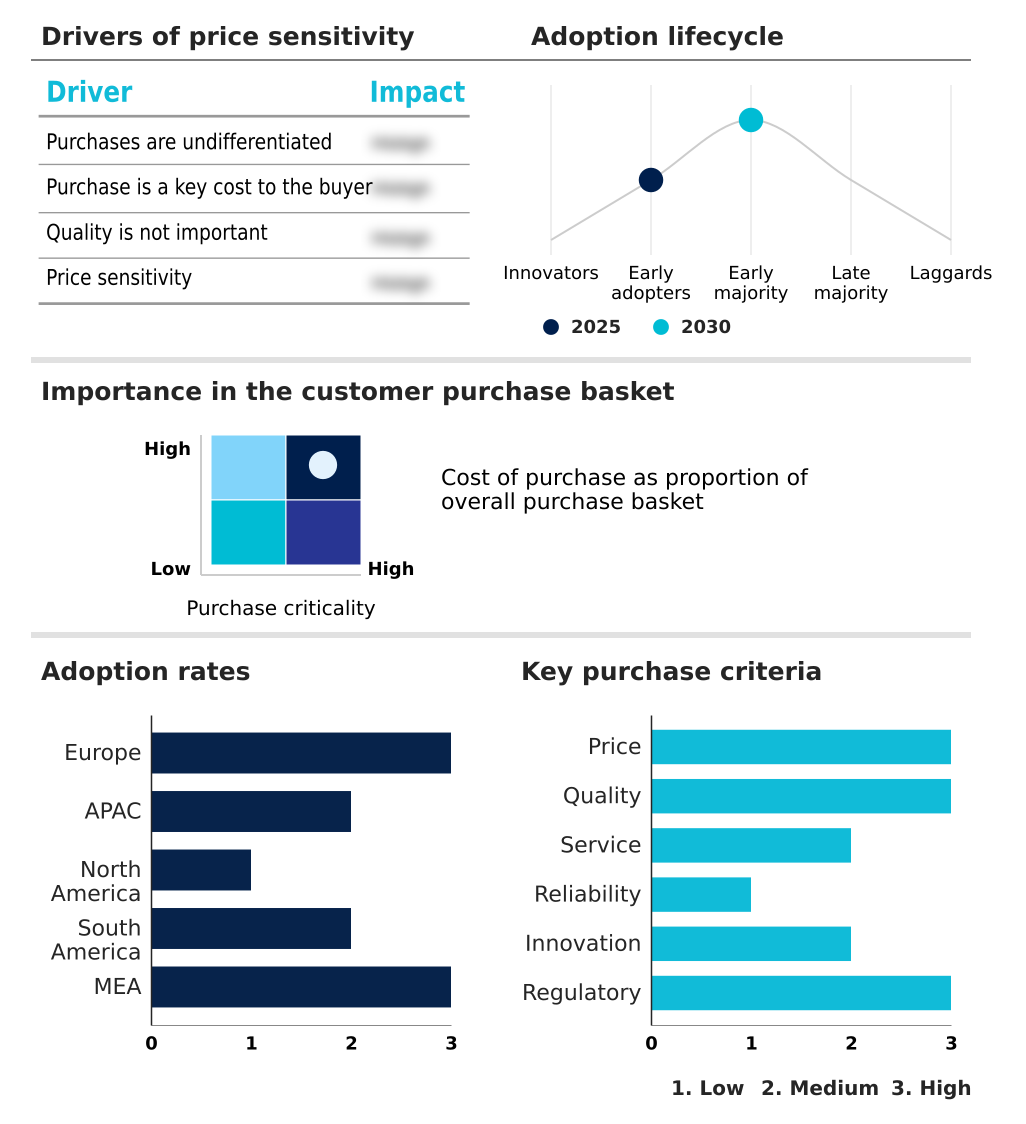
Customer Landscape of Food Industry Vacuum Cooling Equipment Industry

Competitive Landscape

Companies are implementing various strategies, such as strategic alliances, food industry vacuum cooling equipment market forecast, partnerships, mergers and acquisitions, geographical expansion, and product/service launches, to enhance their presence in the industry.

Agrimaint Inc. - Focuses on delivering advanced, energy-efficient rapid cooling systems designed to optimize post-harvest produce preservation, enhance industrial bakery throughput, and ensure stringent food safety compliance for prepared meals.

The industry research and growth report includes detailed analyses of the competitive landscape of the market and information about key companies, including:

  • Agrimaint Inc.
  • Allcold
  • Blentech Corp.
  • Cold Change Group
  • DC Norris and Co. Ltd.
  • Dongguan COLDMAX Ltd.
  • Durrer Spezialmaschinen AG
  • Focusun Refrigeration Corp.
  • Huaxian Technology Co. Ltd.
  • ICEUPS Refrigeration Equipment
  • Innomation
  • KoolJet
  • Revent International AB
  • Southern Vacuum Cooling Inc.
  • TRJ REFRIGERATION INC.
  • Vacuum Cooling and Baking
  • Vacuum Fresh
  • Vegfor Cooling Technology Ltd.
  • Weber Vacuum Group
  • WEC Group Ltd.

Qualitative and quantitative analysis of companies has been conducted to help clients understand the wider business environment as well as the strengths and weaknesses of key industry players. Data is qualitatively analyzed to categorize companies as pure play, category-focused, industry-focused, and diversified; it is quantitatively analyzed to categorize companies as dominant, leading, strong, tentative, and weak.

Recent Development and News in Food industry vacuum cooling equipment market

  • In the Industrial Machinery and Supplies and Components industry, the rigorous enforcement of energy efficiency directives has compelled heavy equipment manufacturers to transition toward variable speed drives and premium-efficiency motors, directly impacting Food Industry Vacuum Cooling Equipment demand by accelerating the replacement of legacy blast chillers with energy-optimized rapid depressurization chambers.
  • The widespread adoption of predictive maintenance architectures powered by Industrial Internet of Things sensors has enabled continuous monitoring of compressor vibration and thermal signatures, directly impacting Food Industry Vacuum Cooling Equipment demand by reducing unplanned downtime for high-capacity pallet chilling infrastructure by up to 20%.
  • Stringent global mandates targeting the phase-down of high-global warming potential hydrofluorocarbons have forced refrigeration component suppliers to engineer systems compatible with natural refrigerants, directly impacting Food Industry Vacuum Cooling Equipment demand by requiring food processors to overhaul existing commercial processing lines.
  • The rapid integration of stringent hygienic design standards mandated by food safety authorities has forced industrial pump and valve manufacturers to redesign fluid handling components, directly impacting Food Industry Vacuum Cooling Equipment demand by establishing new sanitation baselines for food preparation machinery.

Dive into Technavio’s robust research methodology, blending expert interviews, extensive data synthesis, and validated models for unparalleled Food Industry Vacuum Cooling Equipment Market insights. See full methodology.

Market Scope
Page number 294
Base year 2025
Historic period 2020-2024
Forecast period 2026-2030
Growth momentum & CAGR Accelerate at a CAGR of 3.9%
Market growth 2026-2030 USD 7578.5 thousand
Market structure Fragmented
YoY growth 2025-2026(%) 3.7%
Key countries Germany, UK, France, Italy, Spain, The Netherlands, China, Japan, India, South Korea, Australia, Indonesia, US, Canada, Mexico, Brazil, Argentina, Chile, Saudi Arabia, UAE, South Africa, Israel and Turkey
Competitive landscape Leading Companies, Market Positioning of Companies, Competitive Strategies, and Industry Risks

Request Free Sample

Research Analyst Overview

  • Continuous modernization defines the Food Industry Vacuum Cooling Equipment landscape, driven by corporate imperatives to optimize processing velocity and ensure strict hygienic compliance. Food processors are increasingly leveraging the flash evaporation principle to achieve rapid thermal dissipation across dense product batches, dramatically minimizing bacterial proliferation risks.
  • The transition toward intelligent thermodynamic pressure reduction mechanisms allows high-volume facilities to integrate automated rapid cooling directly into continuous workflows. By implementing advanced smart pressure sensor networks and oil-free dry vacuum pump technology, commercial operators have achieved a 30% reduction in processing time compared to traditional ambient cooling methods.
  • This acceleration directly influences strategic budgeting and product formulation decisions, allowing manufacturers to eliminate synthetic preservatives while maintaining extended shelf life. Furthermore, integrating a closed loop heat recovery system enables plant managers to capture waste condenser energy, lowering total utility expenditures.
  • Driven by variable frequency drive architecture, these sophisticated cooling chambers provide the operational resilience necessary to navigate tightening energy regulations and meet international food safety benchmarks without disrupting supply chain continuity.

What are the Key Data Covered in this Food Industry Vacuum Cooling Equipment Market Research and Growth Report?

  • What is the expected growth of the Food Industry Vacuum Cooling Equipment Market between 2026 and 2030?

    • USD 7.58 million, at a CAGR of 3.9%

  • What segmentation does the market report cover?

    • The report is segmented by Type (Air cooled vacuum cooler, and Water cooled vacuum cooler), Application (Baked products, Meat products, Fruits and vegetables, and Readymade food), Product Type (Vertical, and Horizontal) and Geography (Europe, APAC, North America, South America, Middle East and Africa)

  • Which regions are analyzed in the report?

    • Europe, APAC, North America, South America and Middle East and Africa

  • What are the key growth drivers and market challenges?

    • Rapid expansion of commercial bakery operations and industrial batch efficiency needs, High initial capital outlays and financing constraints

  • Who are the major players in the Food Industry Vacuum Cooling Equipment Market?

    • Agrimaint Inc., Allcold, Blentech Corp., Cold Change Group, DC Norris and Co. Ltd., Dongguan COLDMAX Ltd., Durrer Spezialmaschinen AG, Focusun Refrigeration Corp., Huaxian Technology Co. Ltd., ICEUPS Refrigeration Equipment, Innomation, KoolJet, Revent International AB, Southern Vacuum Cooling Inc., TRJ REFRIGERATION INC., Vacuum Cooling and Baking, Vacuum Fresh, Vegfor Cooling Technology Ltd., Weber Vacuum Group and WEC Group Ltd.

Market Research Insights

  • The Food Industry Vacuum Cooling Equipment ecosystem is undergoing rapid modernization as enterprises prioritize precise thermal regulation for perishable horticultural crop preservation and high-throughput ready-to-eat meal preparation. By deploying automated inline rapid chilling infrastructure, commercial bakery processing facilities have successfully reduced cooling cycle durations by 65%, enabling immediate packaging workflows.
  • Furthermore, institutional catering facility operation networks utilizing advanced vacuum depressurization systems report a 22% decrease in overall energy consumption compared to conventional blast chillers. These operational enhancements directly align with corporate sustainability mandates, allowing manufacturers to optimize batch efficiency, mitigate post-harvest spoilage, and achieve a 15% improvement in supply chain margin retention without compromising rigorous food safety compliance.

We can help! Our analysts can customize this food industry vacuum cooling equipment market research report to meet your requirements.

Get in touch

1. Executive Summary

1.1 Market overview

Executive Summary - Chart on Market Overview
Executive Summary - Data Table on Market Overview
Executive Summary - Chart on Global Market Characteristics
Executive Summary - Chart on Market by Geography
Executive Summary - Chart on Market Segmentation by Type
Executive Summary - Chart on Market Segmentation by Application
Executive Summary - Chart on Market Segmentation by Product Type
Executive Summary - Chart on Incremental Growth
Executive Summary - Data Table on Incremental Growth
Executive Summary - Chart on Company Market Positioning

2. Technavio Analysis

2.1 Analysis of price sensitivity, lifecycle, customer purchase basket, adoption rates, and purchase criteria

2.2 Criticality of inputs and Factors of differentiation

Chart on Overview on criticality of inputs and factors of differentiation

2.3 Factors of disruption

Chart on Overview on factors of disruption

2.4 Impact of drivers and challenges

Chart on Impact of drivers and challenges in 2025 and 2030

3. Market Landscape

3.1 Market ecosystem

Chart on Parent Market
Data Table on - Parent Market

3.2 Market characteristics

Chart on Market characteristics analysis

3.3 Value chain analysis

Chart on Value chain analysis

4. Market Sizing

4.1 Market definition

Data Table on Offerings of companies included in the market definition

4.2 Market segment analysis

Market segments

4.3 Market size 2025

4.4 Market outlook: Forecast for 2025-2030

Chart on Global - Market size and forecast 2025-2030 ($ thousand)
Data Table on Global - Market size and forecast 2025-2030 ($ thousand)
Chart on Global Market: Year-over-year growth 2025-2030 (%)
Data Table on Global Market: Year-over-year growth 2025-2030 (%)

5. Historic Market Size

5.1 Global Food Industry Vacuum Cooling Equipment Market 2020 - 2024

Historic Market Size - Data Table on Global Food Industry Vacuum Cooling Equipment Market 2020 - 2024 ($ thousand)

5.2 Type segment analysis 2020 - 2024

Historic Market Size - Type Segment 2020 - 2024 ($ thousand)

5.3 Application segment analysis 2020 - 2024

Historic Market Size - Application Segment 2020 - 2024 ($ thousand)

5.4 Product Type segment analysis 2020 - 2024

Historic Market Size - Product Type Segment 2020 - 2024 ($ thousand)

5.5 Geography segment analysis 2020 - 2024

Historic Market Size - Geography Segment 2020 - 2024 ($ thousand)

5.6 Country segment analysis 2020 - 2024

Historic Market Size - Country Segment 2020 - 2024 ($ thousand)

6. Qualitative Analysis

6.1 Impact of AI on Global Food Industry Vacuum Cooling Equipment Market

6.2 Impact of geopolitical conflicts on Global Food Industry Vacuum Cooling Equipment Market

7. Five Forces Analysis

7.1 Five forces summary

Five forces analysis - Comparison between 2025 and 2030

7.2 Bargaining power of buyers

Bargaining power of buyers - Impact of key factors 2025 and 2030

7.3 Bargaining power of suppliers

Bargaining power of suppliers - Impact of key factors in 2025 and 2030

7.4 Threat of new entrants

Threat of new entrants - Impact of key factors in 2025 and 2030

7.5 Threat of substitutes

Threat of substitutes - Impact of key factors in 2025 and 2030

7.6 Threat of rivalry

Threat of rivalry - Impact of key factors in 2025 and 2030

7.7 Market condition

Chart on Market condition - Five forces 2025 and 2030

8. Market Segmentation by Type

8.1 Market segments

Chart on Type - Market share 2025-2030 (%)
Data Table on Type - Market share 2025-2030 (%)

8.2 Comparison by Type

Chart on Comparison by Type
Data Table on Comparison by Type

8.3 Air cooled vacuum cooler - Market size and forecast 2025-2030

Chart on Air cooled vacuum cooler - Market size and forecast 2025-2030 ($ thousand)
Data Table on Air cooled vacuum cooler - Market size and forecast 2025-2030 ($ thousand)
Chart on Air cooled vacuum cooler - Year-over-year growth 2025-2030 (%)
Data Table on Air cooled vacuum cooler - Year-over-year growth 2025-2030 (%)

8.4 Water cooled vacuum cooler - Market size and forecast 2025-2030

Chart on Water cooled vacuum cooler - Market size and forecast 2025-2030 ($ thousand)
Data Table on Water cooled vacuum cooler - Market size and forecast 2025-2030 ($ thousand)
Chart on Water cooled vacuum cooler - Year-over-year growth 2025-2030 (%)
Data Table on Water cooled vacuum cooler - Year-over-year growth 2025-2030 (%)

8.5 Market opportunity by Type

Market opportunity by Type ($ thousand)
Data Table on Market opportunity by Type ($ thousand)

9. Market Segmentation by Application

9.1 Market segments

Chart on Application - Market share 2025-2030 (%)
Data Table on Application - Market share 2025-2030 (%)

9.2 Comparison by Application

Chart on Comparison by Application
Data Table on Comparison by Application

9.3 Baked products - Market size and forecast 2025-2030

Chart on Baked products - Market size and forecast 2025-2030 ($ thousand)
Data Table on Baked products - Market size and forecast 2025-2030 ($ thousand)
Chart on Baked products - Year-over-year growth 2025-2030 (%)
Data Table on Baked products - Year-over-year growth 2025-2030 (%)

9.4 Meat products - Market size and forecast 2025-2030

Chart on Meat products - Market size and forecast 2025-2030 ($ thousand)
Data Table on Meat products - Market size and forecast 2025-2030 ($ thousand)
Chart on Meat products - Year-over-year growth 2025-2030 (%)
Data Table on Meat products - Year-over-year growth 2025-2030 (%)

9.5 Fruits and vegetables - Market size and forecast 2025-2030

Chart on Fruits and vegetables - Market size and forecast 2025-2030 ($ thousand)
Data Table on Fruits and vegetables - Market size and forecast 2025-2030 ($ thousand)
Chart on Fruits and vegetables - Year-over-year growth 2025-2030 (%)
Data Table on Fruits and vegetables - Year-over-year growth 2025-2030 (%)

9.6 Readymade food - Market size and forecast 2025-2030

Chart on Readymade food - Market size and forecast 2025-2030 ($ thousand)
Data Table on Readymade food - Market size and forecast 2025-2030 ($ thousand)
Chart on Readymade food - Year-over-year growth 2025-2030 (%)
Data Table on Readymade food - Year-over-year growth 2025-2030 (%)

9.7 Market opportunity by Application

Market opportunity by Application ($ thousand)
Data Table on Market opportunity by Application ($ thousand)

10. Market Segmentation by Product Type

10.1 Market segments

Chart on Product Type - Market share 2025-2030 (%)
Data Table on Product Type - Market share 2025-2030 (%)

10.2 Comparison by Product Type

Chart on Comparison by Product Type
Data Table on Comparison by Product Type

10.3 Vertical - Market size and forecast 2025-2030

Chart on Vertical - Market size and forecast 2025-2030 ($ thousand)
Data Table on Vertical - Market size and forecast 2025-2030 ($ thousand)
Chart on Vertical - Year-over-year growth 2025-2030 (%)
Data Table on Vertical - Year-over-year growth 2025-2030 (%)

10.4 Horizontal - Market size and forecast 2025-2030

Chart on Horizontal - Market size and forecast 2025-2030 ($ thousand)
Data Table on Horizontal - Market size and forecast 2025-2030 ($ thousand)
Chart on Horizontal - Year-over-year growth 2025-2030 (%)
Data Table on Horizontal - Year-over-year growth 2025-2030 (%)

10.5 Market opportunity by Product Type

Market opportunity by Product Type ($ thousand)
Data Table on Market opportunity by Product Type ($ thousand)

11. Customer Landscape

11.1 Customer landscape overview

Analysis of price sensitivity, lifecycle, customer purchase basket, adoption rates, and purchase criteria

12. Geographic Landscape

12.1 Geographic segmentation

Chart on Market share by geography 2025-2030 (%)
Data Table on Market share by geography 2025-2030 (%)

12.2 Geographic comparison

Chart on Geographic comparison
Data Table on Geographic comparison

12.3 Europe - Market size and forecast 2025-2030

Chart on Europe - Market size and forecast 2025-2030 ($ thousand)
Data Table on Europe - Market size and forecast 2025-2030 ($ thousand)
Chart on Europe - Year-over-year growth 2025-2030 (%)
Data Table on Europe - Year-over-year growth 2025-2030 (%)
Chart on Regional Comparison - Europe
Data Table on Regional Comparison - Europe

12.3.1 Germany - Market size and forecast 2025-2030

Chart on Germany - Market size and forecast 2025-2030 ($ thousand)
Data Table on Germany - Market size and forecast 2025-2030 ($ thousand)
Chart on Germany - Year-over-year growth 2025-2030 (%)
Data Table on Germany - Year-over-year growth 2025-2030 (%)

12.3.2 UK - Market size and forecast 2025-2030

Chart on UK - Market size and forecast 2025-2030 ($ thousand)
Data Table on UK - Market size and forecast 2025-2030 ($ thousand)
Chart on UK - Year-over-year growth 2025-2030 (%)
Data Table on UK - Year-over-year growth 2025-2030 (%)

12.3.3 France - Market size and forecast 2025-2030

Chart on France - Market size and forecast 2025-2030 ($ thousand)
Data Table on France - Market size and forecast 2025-2030 ($ thousand)
Chart on France - Year-over-year growth 2025-2030 (%)
Data Table on France - Year-over-year growth 2025-2030 (%)

12.3.4 Italy - Market size and forecast 2025-2030

Chart on Italy - Market size and forecast 2025-2030 ($ thousand)
Data Table on Italy - Market size and forecast 2025-2030 ($ thousand)
Chart on Italy - Year-over-year growth 2025-2030 (%)
Data Table on Italy - Year-over-year growth 2025-2030 (%)

12.3.5 Spain - Market size and forecast 2025-2030

Chart on Spain - Market size and forecast 2025-2030 ($ thousand)
Data Table on Spain - Market size and forecast 2025-2030 ($ thousand)
Chart on Spain - Year-over-year growth 2025-2030 (%)
Data Table on Spain - Year-over-year growth 2025-2030 (%)

12.3.6 The Netherlands - Market size and forecast 2025-2030

Chart on The Netherlands - Market size and forecast 2025-2030 ($ thousand)
Data Table on The Netherlands - Market size and forecast 2025-2030 ($ thousand)
Chart on The Netherlands - Year-over-year growth 2025-2030 (%)
Data Table on The Netherlands - Year-over-year growth 2025-2030 (%)

12.4 APAC - Market size and forecast 2025-2030

Chart on APAC - Market size and forecast 2025-2030 ($ thousand)
Data Table on APAC - Market size and forecast 2025-2030 ($ thousand)
Chart on APAC - Year-over-year growth 2025-2030 (%)
Data Table on APAC - Year-over-year growth 2025-2030 (%)
Chart on Regional Comparison - APAC
Data Table on Regional Comparison - APAC

12.4.1 China - Market size and forecast 2025-2030

Chart on China - Market size and forecast 2025-2030 ($ thousand)
Data Table on China - Market size and forecast 2025-2030 ($ thousand)
Chart on China - Year-over-year growth 2025-2030 (%)
Data Table on China - Year-over-year growth 2025-2030 (%)

12.4.2 Japan - Market size and forecast 2025-2030

Chart on Japan - Market size and forecast 2025-2030 ($ thousand)
Data Table on Japan - Market size and forecast 2025-2030 ($ thousand)
Chart on Japan - Year-over-year growth 2025-2030 (%)
Data Table on Japan - Year-over-year growth 2025-2030 (%)

12.4.3 India - Market size and forecast 2025-2030

Chart on India - Market size and forecast 2025-2030 ($ thousand)
Data Table on India - Market size and forecast 2025-2030 ($ thousand)
Chart on India - Year-over-year growth 2025-2030 (%)
Data Table on India - Year-over-year growth 2025-2030 (%)

12.4.4 South Korea - Market size and forecast 2025-2030

Chart on South Korea - Market size and forecast 2025-2030 ($ thousand)
Data Table on South Korea - Market size and forecast 2025-2030 ($ thousand)
Chart on South Korea - Year-over-year growth 2025-2030 (%)
Data Table on South Korea - Year-over-year growth 2025-2030 (%)

12.4.5 Australia - Market size and forecast 2025-2030

Chart on Australia - Market size and forecast 2025-2030 ($ thousand)
Data Table on Australia - Market size and forecast 2025-2030 ($ thousand)
Chart on Australia - Year-over-year growth 2025-2030 (%)
Data Table on Australia - Year-over-year growth 2025-2030 (%)

12.4.6 Indonesia - Market size and forecast 2025-2030

Chart on Indonesia - Market size and forecast 2025-2030 ($ thousand)
Data Table on Indonesia - Market size and forecast 2025-2030 ($ thousand)
Chart on Indonesia - Year-over-year growth 2025-2030 (%)
Data Table on Indonesia - Year-over-year growth 2025-2030 (%)

12.5 North America - Market size and forecast 2025-2030

Chart on North America - Market size and forecast 2025-2030 ($ thousand)
Data Table on North America - Market size and forecast 2025-2030 ($ thousand)
Chart on North America - Year-over-year growth 2025-2030 (%)
Data Table on North America - Year-over-year growth 2025-2030 (%)
Chart on Regional Comparison - North America
Data Table on Regional Comparison - North America

12.5.1 US - Market size and forecast 2025-2030

Chart on US - Market size and forecast 2025-2030 ($ thousand)
Data Table on US - Market size and forecast 2025-2030 ($ thousand)
Chart on US - Year-over-year growth 2025-2030 (%)
Data Table on US - Year-over-year growth 2025-2030 (%)

12.5.2 Canada - Market size and forecast 2025-2030

Chart on Canada - Market size and forecast 2025-2030 ($ thousand)
Data Table on Canada - Market size and forecast 2025-2030 ($ thousand)
Chart on Canada - Year-over-year growth 2025-2030 (%)
Data Table on Canada - Year-over-year growth 2025-2030 (%)

12.5.3 Mexico - Market size and forecast 2025-2030

Chart on Mexico - Market size and forecast 2025-2030 ($ thousand)
Data Table on Mexico - Market size and forecast 2025-2030 ($ thousand)
Chart on Mexico - Year-over-year growth 2025-2030 (%)
Data Table on Mexico - Year-over-year growth 2025-2030 (%)

12.6 South America - Market size and forecast 2025-2030

Chart on South America - Market size and forecast 2025-2030 ($ thousand)
Data Table on South America - Market size and forecast 2025-2030 ($ thousand)
Chart on South America - Year-over-year growth 2025-2030 (%)
Data Table on South America - Year-over-year growth 2025-2030 (%)
Chart on Regional Comparison - South America
Data Table on Regional Comparison - South America

12.6.1 Brazil - Market size and forecast 2025-2030

Chart on Brazil - Market size and forecast 2025-2030 ($ thousand)
Data Table on Brazil - Market size and forecast 2025-2030 ($ thousand)
Chart on Brazil - Year-over-year growth 2025-2030 (%)
Data Table on Brazil - Year-over-year growth 2025-2030 (%)

12.6.2 Argentina - Market size and forecast 2025-2030

Chart on Argentina - Market size and forecast 2025-2030 ($ thousand)
Data Table on Argentina - Market size and forecast 2025-2030 ($ thousand)
Chart on Argentina - Year-over-year growth 2025-2030 (%)
Data Table on Argentina - Year-over-year growth 2025-2030 (%)

12.6.3 Chile - Market size and forecast 2025-2030

Chart on Chile - Market size and forecast 2025-2030 ($ thousand)
Data Table on Chile - Market size and forecast 2025-2030 ($ thousand)
Chart on Chile - Year-over-year growth 2025-2030 (%)
Data Table on Chile - Year-over-year growth 2025-2030 (%)

12.7 Middle East and Africa - Market size and forecast 2025-2030

Chart on Middle East and Africa - Market size and forecast 2025-2030 ($ thousand)
Data Table on Middle East and Africa - Market size and forecast 2025-2030 ($ thousand)
Chart on Middle East and Africa - Year-over-year growth 2025-2030 (%)
Data Table on Middle East and Africa - Year-over-year growth 2025-2030 (%)
Chart on Regional Comparison - Middle East and Africa
Data Table on Regional Comparison - Middle East and Africa

12.7.1 Saudi Arabia - Market size and forecast 2025-2030

Chart on Saudi Arabia - Market size and forecast 2025-2030 ($ thousand)
Data Table on Saudi Arabia - Market size and forecast 2025-2030 ($ thousand)
Chart on Saudi Arabia - Year-over-year growth 2025-2030 (%)
Data Table on Saudi Arabia - Year-over-year growth 2025-2030 (%)

12.7.2 UAE - Market size and forecast 2025-2030

Chart on UAE - Market size and forecast 2025-2030 ($ thousand)
Data Table on UAE - Market size and forecast 2025-2030 ($ thousand)
Chart on UAE - Year-over-year growth 2025-2030 (%)
Data Table on UAE - Year-over-year growth 2025-2030 (%)

12.7.3 South Africa - Market size and forecast 2025-2030

Chart on South Africa - Market size and forecast 2025-2030 ($ thousand)
Data Table on South Africa - Market size and forecast 2025-2030 ($ thousand)
Chart on South Africa - Year-over-year growth 2025-2030 (%)
Data Table on South Africa - Year-over-year growth 2025-2030 (%)

12.7.4 Israel - Market size and forecast 2025-2030

Chart on Israel - Market size and forecast 2025-2030 ($ thousand)
Data Table on Israel - Market size and forecast 2025-2030 ($ thousand)
Chart on Israel - Year-over-year growth 2025-2030 (%)
Data Table on Israel - Year-over-year growth 2025-2030 (%)

12.7.5 Turkey - Market size and forecast 2025-2030

Chart on Turkey - Market size and forecast 2025-2030 ($ thousand)
Data Table on Turkey - Market size and forecast 2025-2030 ($ thousand)
Chart on Turkey - Year-over-year growth 2025-2030 (%)
Data Table on Turkey - Year-over-year growth 2025-2030 (%)

12.8 Market opportunity by geography

Market opportunity by geography ($ thousand)
Data Tables on Market opportunity by geography ($ thousand)

13. Drivers, Challenges, and Opportunity

13.1 Market drivers

Rapid expansion of commercial bakery operations and industrial batch efficiency needs
Sustained demand for fresh produce quality preservation and export logistics
Global corporate commitments to energy efficiency and supply chain decarbonization

13.2 Market challenges

High initial capital outlays and financing constraints
Technical integration hurdles and operational maintenance costs
Product matrix limitations and moisture loss sensitivity

13.3 Impact of drivers and challenges

Impact of drivers and challenges in 2025 and 2030

13.4 Market opportunities

Surging global demand for fresh perishable foodstuff
Aggressive institutional mandates for food waste reduction
Expansion of organized retail and cold chains

14. Competitive Landscape

14.1 Overview

14.2

Overview on criticality of inputs and factors of differentiation

14.3 Landscape disruption

Overview on factors of disruption

14.4 Industry risks

Impact of key risks on business

15. Competitive Analysis

15.1 Companies profiled

Companies covered

15.2 Company ranking index

15.3 Market positioning of companies

Matrix on companies position and classification

15.4 Agrimaint Inc.

Agrimaint Inc. - Overview
Agrimaint Inc. - Product / Service
Agrimaint Inc. - Key offerings
SWOT

15.5 Allcold

Allcold - Overview
Allcold - Product / Service
Allcold - Key offerings
SWOT

15.6 Blentech Corp.

Blentech Corp. - Overview
Blentech Corp. - Product / Service
Blentech Corp. - Key offerings
SWOT

15.7 Cold Change Group

Cold Change Group - Overview
Cold Change Group - Product / Service
Cold Change Group - Key offerings
SWOT

15.8 DC Norris and Co. Ltd.

DC Norris and Co. Ltd. - Overview
DC Norris and Co. Ltd. - Product / Service
DC Norris and Co. Ltd. - Key offerings
SWOT

15.9 Dongguan COLDMAX Ltd.

Dongguan COLDMAX Ltd. - Overview
Dongguan COLDMAX Ltd. - Product / Service
Dongguan COLDMAX Ltd. - Key offerings
SWOT

15.10 Durrer Spezialmaschinen AG

Durrer Spezialmaschinen AG - Overview
Durrer Spezialmaschinen AG - Product / Service
Durrer Spezialmaschinen AG - Key offerings
SWOT

15.11 Focusun Refrigeration Corp.

Focusun Refrigeration Corp. - Overview
Focusun Refrigeration Corp. - Product / Service
Focusun Refrigeration Corp. - Key offerings
SWOT

15.12 Huaxian Technology Co. Ltd.

Huaxian Technology Co. Ltd. - Overview
Huaxian Technology Co. Ltd. - Product / Service
Huaxian Technology Co. Ltd. - Key offerings
SWOT

15.13 ICEUPS Refrigeration Equipment

ICEUPS Refrigeration Equipment - Overview
ICEUPS Refrigeration Equipment - Product / Service
ICEUPS Refrigeration Equipment - Key offerings
SWOT

15.14 Innomation

Innomation - Overview
Innomation - Product / Service
Innomation - Key offerings
SWOT

15.15 KoolJet

KoolJet - Overview
KoolJet - Product / Service
KoolJet - Key offerings
SWOT

15.16 Revent International AB

Revent International AB - Overview
Revent International AB - Product / Service
Revent International AB - Key offerings
SWOT

15.17 Southern Vacuum Cooling Inc.

Southern Vacuum Cooling Inc. - Overview
Southern Vacuum Cooling Inc. - Product / Service
Southern Vacuum Cooling Inc. - Key offerings
SWOT

15.18 WEC Group Ltd.

WEC Group Ltd. - Overview
WEC Group Ltd. - Product / Service
WEC Group Ltd. - Key offerings
SWOT

16. Appendix

16.1 Scope of the report

Market definition
Objectives
Notes and caveats

16.2 Inclusions and exclusions checklist

Inclusions checklist
Exclusions checklist

16.3 Currency conversion rates for US$

16.4 Research methodology

16.5 Data procurement

Information sources

16.6 Data validation

16.7 Validation techniques employed for market sizing

16.8 Data synthesis

16.9 360 degree market analysis

16.10 List of abbreviations

Research Methodology

Technavio presents a detailed picture of the market by way of study, synthesis, and summation of data from multiple sources. The analysts have presented the various facets of the market with a particular focus on identifying the key industry influencers. The data thus presented is comprehensive, reliable, and the result of extensive research, both primary and secondary.

INFORMATION SOURCES

Primary sources

  • Manufacturers and suppliers
  • Channel partners
  • Industry experts
  • Strategic decision makers

Secondary sources

  • Industry journals and periodicals
  • Government data
  • Financial reports of key industry players
  • Historical data
  • Press releases

DATA ANALYSIS

Data Synthesis

  • Collation of data
  • Estimation of key figures
  • Analysis of derived insights

Data Validation

  • Triangulation with data models
  • Reference against proprietary databases
  • Corroboration with industry experts

REPORT WRITING

Qualitative

  • Market drivers
  • Market challenges
  • Market trends
  • Five forces analysis

Quantitative

  • Market size and forecast
  • Market segmentation
  • Geographical insights
  • Competitive landscape

Interested in this report?

Get your sample now to see our research methodology and insights!

Download Now

Frequently Asked Questions

Food Industry Vacuum Cooling Equipment market growth will increase by USD 7578.5 thousand thousand during 2026-2030.

The Food Industry Vacuum Cooling Equipment market is expected to grow at a CAGR of 3.9% during 2026-2030.

Food Industry Vacuum Cooling Equipment market is segmented by Type (Air cooled vacuum cooler, Water cooled vacuum cooler) Application (Baked products, Meat products, Fruits and vegetables, Readymade food) Product type (Vertical, Horizontal)

Agrimaint Inc., Allcold, Blentech Corp., Cold Change Group, DC Norris and Co. Ltd., Dongguan COLDMAX Ltd., Durrer Spezialmaschinen AG, Focusun Refrigeration Corp., Huaxian Technology Co. Ltd., ICEUPS Refrigeration Equipment, Innomation, KoolJet, Revent International AB, Southern Vacuum Cooling Inc., TRJ REFRIGERATION INC., Vacuum Cooling and Baking, Vacuum Fresh, Vegfor Cooling Technology Ltd., Weber Vacuum Group, WEC Group Ltd. are a few of the key vendors in the Food Industry Vacuum Cooling Equipment market.

Europe will register the highest growth rate of 38.3% among the other regions. Therefore, the Food Industry Vacuum Cooling Equipment market in Europe is expected to garner significant business opportunities for the vendors during the forecast period.

Germany, UK, France, Italy, Spain, The Netherlands, China, Japan, India, South Korea, Australia, Indonesia, US, Canada, Mexico, Brazil, Argentina, Chile, Saudi Arabia, UAE, South Africa, Israel, Turkey

  • Rapid expansion of commercial bakery operations and industrial batch efficiency needs is the driving factor this market.

The Food Industry Vacuum Cooling Equipment market vendors should focus on grabbing business opportunities from the Type segment as it accounted for the largest market share in the base year.
RIA - Research AI Assistant
Ask RIA
