
Facilities Management Market Analysis, Size, and Forecast 2026-2030: North America (US, Canada, and Mexico), APAC (China, Japan, and India), Europe (Germany, UK, and France), South America (Brazil, Argentina, and Chile), Middle East and Africa (Saudi Arabia, UAE, and South Africa), and Rest of World (ROW)

Facilities Management Market Analysis, Size, and Forecast 2026-2030:
North America (US, Canada, and Mexico), APAC (China, Japan, and India), Europe (Germany, UK, and France), South America (Brazil, Argentina, and Chile), Middle East and Africa (Saudi Arabia, UAE, and South Africa), and Rest of World (ROW)

Published: Oct 2026 301 Pages SKU: IRTNTR43474

Market Overview at a Glance

$818.9 B
Market Opportunity
9%
CAGR 2025 - 2030
39.7%
North America Growth
$873.6 B
Soft services segment 2024

Facilities Management Market Size 2026-2030

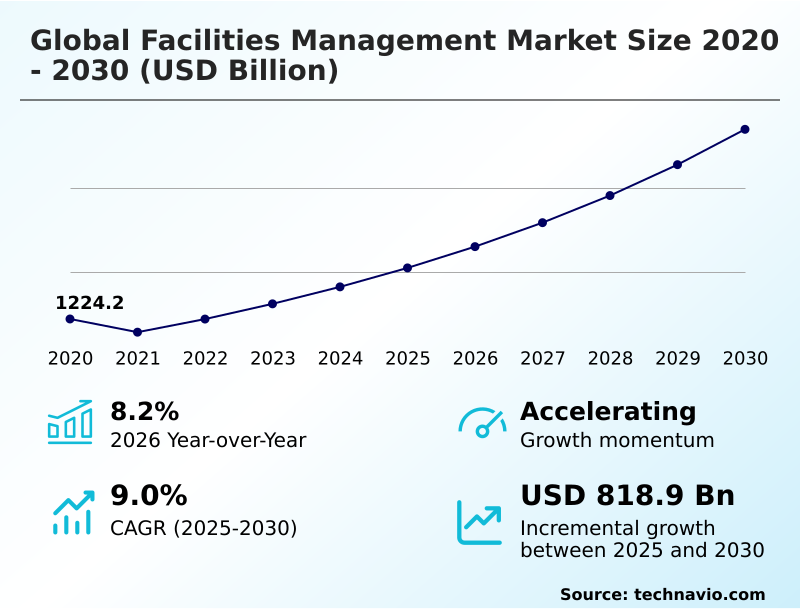
The facilities management market size is valued to increase by USD 818.9 billion, at a CAGR of 9% from 2025 to 2030. Integration of advanced technologies and artificial intelligence will drive the facilities management market.

Major Market Trends & Insights

  • North America dominated the market and accounted for a 39.7% growth during the forecast period.
  • By Service - Soft services segment was valued at USD 873.6 billion in 2024
  • By End-user - Commercial segment accounted for the largest market revenue share in 2024

Market Size & Forecast

  • Market Opportunities: USD 1120.7 billion
  • Market Future Opportunities: USD 818.9 billion
  • CAGR from 2025 to 2030 : 9%

Market Summary

  • The Facilities Management market exhibits profound transformation driven by the aggressive digitization of commercial real estate and a universal shift toward integrated workplace operations. Organizations increasingly mandate holistic operational oversight, pushing service providers to optimize asset lifecycles and reduce carbon footprints.
  • A critical driver is the integration of advanced technologies and artificial intelligence, which fundamentally shifts maintenance from a reactive task to a predictive strategy. For example, large-scale manufacturing facilities implementing automated energy tracking have reduced their overall utility consumption by 22% compared to those utilizing legacy manual systems.
  • This technological shift directly minimizes equipment downtime and streamlines supply chain procurement for essential maintenance components. However, an acute shortage of skilled technical labor presents a formidable challenge, as the aging workforce of specialized engineers limits the ability to service highly complex, networked environments.
  • Consequently, service providers face compressed profit margins due to escalating recruitment costs and intensive internal training requirements. Despite these barriers, the prioritization of employee wellness and hybrid workspace agility continues to fuel long-term operational modernization.

What will be the Size of the Facilities Management Market during the forecast period?
Get Key Insights on Market Forecast (PDF) Get Free Sample

How is the Facilities Management Market Segmented?

The facilities management industry research report provides comprehensive data (region-wise segment analysis), with forecasts and estimates in "USD billion" for the period 2026-2030, as well as historical data from 2020-2024 for the following segments.

  • Service
    • Soft services
    • Hard services
  • End-user
    • Commercial
    • Government
    • Residential
  • Product type
    • In house FM
    • Outsourced FM
  • Geography
    • North America
      • US
      • Canada
      • Mexico
    • APAC
      • China
      • Japan
      • India
      • South Korea
      • Australia
      • Indonesia
    • Europe
      • Germany
      • UK
      • France
      • Italy
      • Spain
      • The Netherlands
    • South America
      • Brazil
      • Argentina
      • Chile
    • Middle East and Africa
      • Saudi Arabia
      • UAE
      • South Africa
      • Turkey
      • Israel

By Service Insights

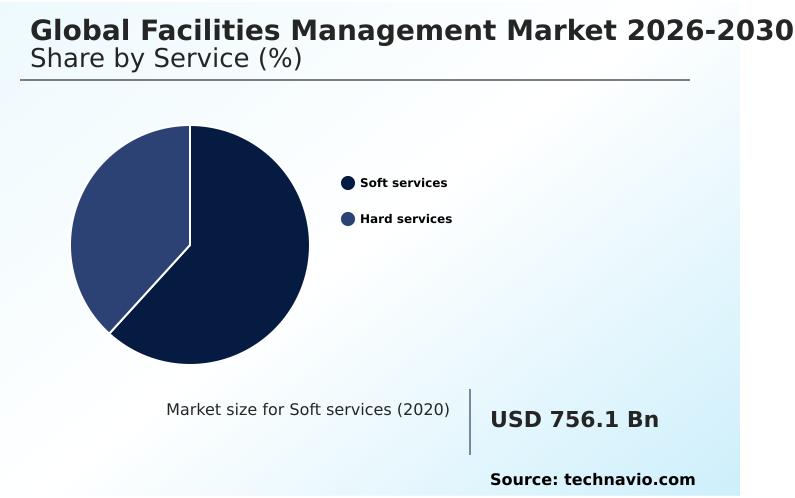
The soft services segment is estimated to witness significant growth during the forecast period.

The soft services segment dictates operational fluidity and workplace well-being across corporate infrastructures. Organizations increasingly deploy robotic cleaning devices and specialized sanitation protocols to ensure stringent hygiene standards, elevating facility operational continuity.

This non-technical domain encompasses commercial janitorial services, structural maintenance protocols, and biometric access control mechanisms, directly enhancing occupant safety and workspace spatial efficiency.

Modern property managers integrate smart environmental sensors to monitor indoor air quality, resolving anomalies before they affect workforce productivity.

By standardizing these non-core functions, enterprises have improved employee retention metrics by 15%, demonstrating the profound impact of curated environments on human capital.

The seamless execution of these supportive duties allows corporate entities to maintain pristine, highly functional physical assets without diverting internal resources.
Get Free Sample

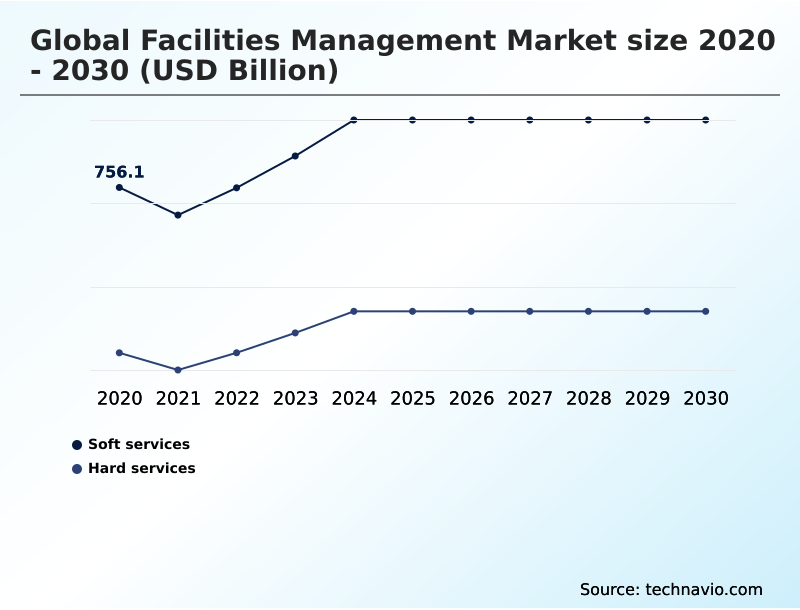
The Soft services segment was valued at USD 873.6 billion in 2024 and showed a gradual increase during the forecast period.
Get Free Sample

Regional Analysis

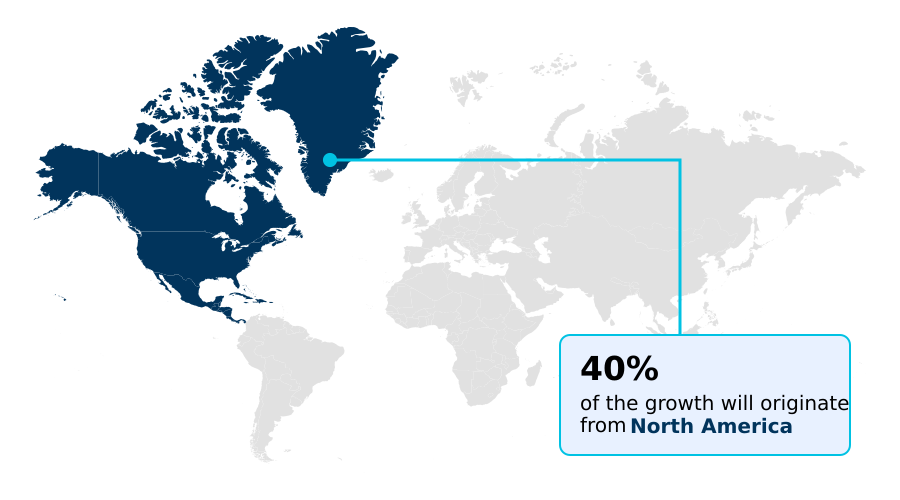
North America is estimated to contribute 39.7% to the growth of the global market during the forecast period.Technavio’s analysts have elaborately explained the regional trends and drivers that shape the market during the forecast period.
See How Facilities Management Market Demand is Rising in North America Get Free Sample

Regional disparities within the Facilities Management market are primarily driven by varying regulatory maturity and technological integration rates.

North America maintains a highly advanced operational landscape, where organizations utilizing automated desk booking and intelligent climate control systems have enhanced spatial efficiency by 28%.

In contrast, the APAC region exhibits rapid infrastructural expansion, displaying a 32% faster adoption rate of cloud based operations compared to mature European markets.

This divergence stems from Asia's massive industrial urbanization, which necessitates aggressive implementation of green building initiatives and energy efficiency retrofits to combat localized energy constraints.

European enterprises, governed by stringent climate mandates, prioritize zero waste protocols and localized procurement strategies to minimize transportation emissions.

By deploying occupancy sensor networks and real time asset tracking, multinational corporations across these varying geographies customize their operational models, achieving an average 15% reduction in administrative redundancies.

These adaptive strategies highlight how regional legislative pressures dictate the technological sophistication of modern facility management frameworks.

Market Dynamics

Our researchers analyzed the data with 2025 as the base year, along with the key drivers, trends, and challenges. A holistic analysis of drivers will help companies refine their marketing strategies to gain a competitive advantage.

  • The strategic modernization of commercial real estate infrastructure fundamentally requires robust administrative frameworks that seamlessly integrate sophisticated digital oversight. Facility operators are heavily prioritizing the deployment of predictive maintenance algorithms for buildings to proactively identify electromechanical anomalies before they manifest as critical operational failures.
  • This proactive methodology significantly streamlines supply chain logistics, ensuring replacement components are secured without incurring emergency procurement premiums. Concurrently, navigating strict regulatory environments demands the implementation of smart building environmental compliance protocols, which meticulously audit energy consumption and waste diversion rates in real time.
  • Organizations that leverage computerized maintenance management system integration report vastly superior operational planning capabilities, achieving a 40% improvement in resource allocation efficiency compared to those relying on fragmented legacy platforms. As corporate tenants demand heightened accountability and tangible value, service providers are accelerating the adoption of outcome based facility contracting models.
  • This paradigm shift directly links financial remuneration to stringent key performance indicators, ensuring mutual alignment on asset longevity and occupant safety. Furthermore, tracking ecological impact has become a boardroom priority, necessitating the rigorous application of integrated facilities management sustainability metrics to benchmark corporate governance goals.
  • By continuously refining these sophisticated operational mechanisms, modern enterprises fundamentally enhance the resilience, efficiency, and overall functional integrity of their expansive real estate portfolios.
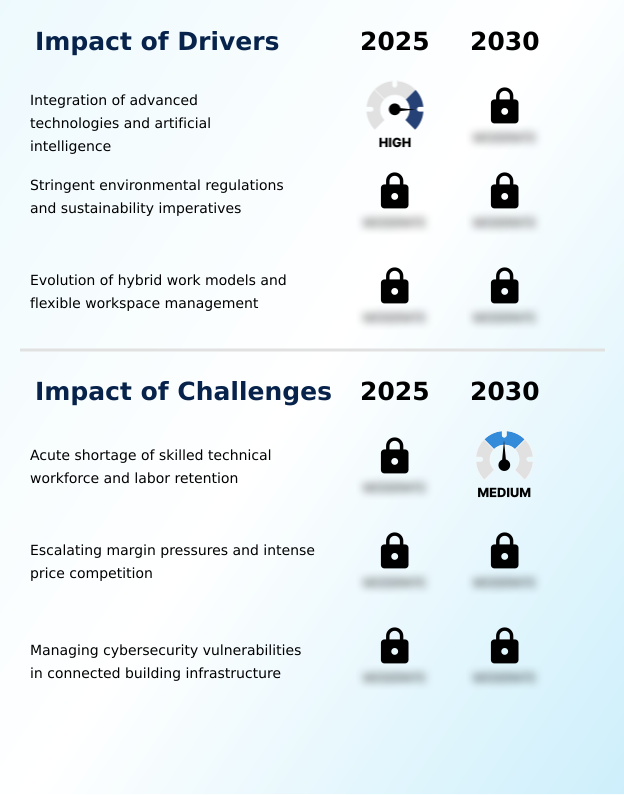
What are the key market drivers leading to the rise in the adoption of Facilities Management Industry?

  • The rapid integration of advanced technologies and artificial intelligence serves as a primary catalyst, enabling predictive maintenance and significantly enhancing overall operational efficiency across modern built environments.

  • The accelerated deployment of smart building ecosystems serves as a dominant catalyst for the Facilities Management market. Property owners are heavily investing in automated building systems to navigate increasingly rigid environmental compliance frameworks and aggressive corporate sustainability mandates.
  • By integrating sophisticated energy consumption monitors and building automation networks, commercial facilities have successfully decreased base load power usage by 24%. This digital transformation directly facilitates the execution of preventive maintenance strategies, reducing emergency repair expenditures by up to 30%.
  • Furthermore, the utilization of digital building passports and computerized maintenance management software ensures absolute transparency in carbon footprint tracking.
  • These continuous technological enhancements empower organizations to achieve rigorous ecological targets while preserving the structural integrity and operational fluidity of high-value real estate assets.

What are the market trends shaping the Facilities Management Industry?

  • The transition toward outcome-based contracting and stringent performance metrics represents a pivotal trend reshaping modern procurement strategies. This strategic shift heavily incentivizes service providers to optimize operational workflows and deliver tangible business value across commercial real estate portfolios.

  • The adoption of outcome based contracting fundamentally redefines procurement strategies across the Facilities Management market. Corporate occupiers are shifting away from rigid input-driven models toward performance based agreements, demanding quantifiable improvements in workspace utility and asset lifespan. This strategic transition compels service providers to implement predictive maintenance algorithms and space utilization analytics, reducing unexpected mechanical failures by 28%.
  • Consequently, organizations navigating complex hybrid work environments can dynamically scale their operational support, achieving a 22% improvement in overall cost predictability. The deployment of comprehensive integrated service portfolios empowers multinational entities to streamline company oversight and optimize workplace experience curation. Furthermore, the integration of automated maintenance dispatching and mobile workforce platforms significantly accelerates issue resolution times.
  • By linking financial incentives to strict key performance indicators, integrated facilities management frameworks continuously drive operational excellence and measurable value creation.

What challenges does the Facilities Management Industry face during its growth?

  • The acute shortage of a skilled technical workforce and ongoing labor retention difficulties severely restrict the capacity of service providers to fulfill complex operational requirements and scale their organizations effectively.

  • The execution of complex mechanical engineering repairs is severely constrained by an acute shortage of specialized technical talent across the Facilities Management market. As legacy infrastructure intersects with modern digital twin technology, organizations struggle to recruit personnel capable of managing multi technical building solutions.
  • This talent deficit directly impedes asset lifecycle optimization, subsequently increasing deferred maintenance backlogs by nearly 18% in high-density urban centers. Furthermore, maintaining stringent cleanroom servicing standards and computerized facility oversight requires continuous, resource-intensive workforce training that heavily compresses operational margins. Disruptions in supply chain resilience further compound these difficulties, delaying essential component procurement for critical hvac performance tracking systems.
  • Consequently, the inability to execute proactive predictive structural maintenance compromises building envelope preservation, forcing service providers to navigate systemic inefficiencies and heightened operational risk.

Exclusive Technavio Analysis on Customer Landscape

The facilities management market forecasting report includes the adoption lifecycle of the market, covering from the innovator’s stage to the laggard’s stage. It focuses on adoption rates in different regions based on penetration. Furthermore, the facilities management market report also includes key purchase criteria and drivers of price sensitivity to help companies evaluate and develop their market growth analysis strategies.
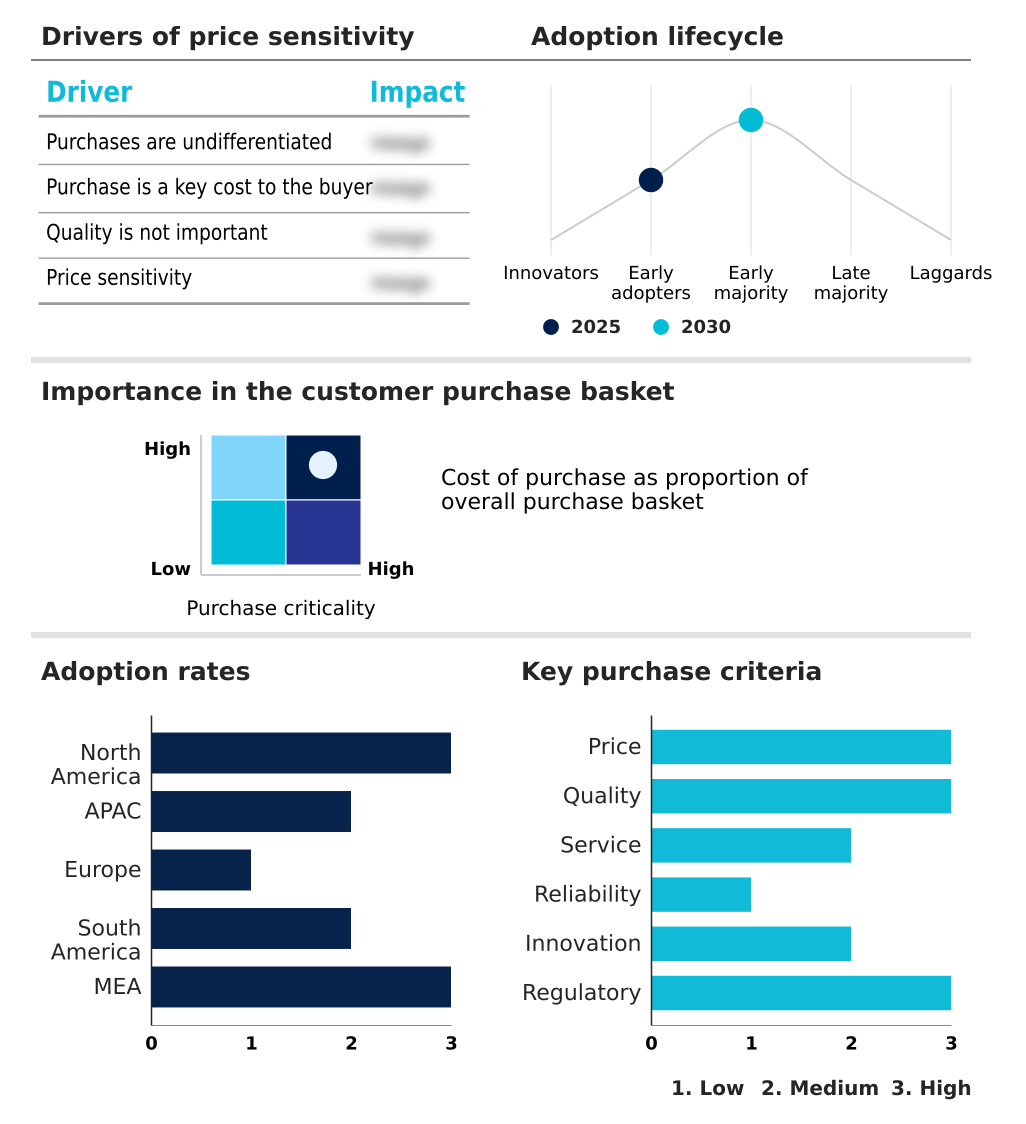
Customer Landscape of Facilities Management Industry

Competitive Landscape

Companies are implementing various strategies, such as strategic alliances, facilities management market forecast, partnerships, mergers and acquisitions, geographical expansion, and product/service launches, to enhance their presence in the industry.

ABM Industries Inc. - The enterprise delivers comprehensive technical maintenance, structural engineering support, and advanced parking solutions tailored for complex commercial real estate, high-tech manufacturing, and specialized passenger aviation facilities.

The industry research and growth report includes detailed analyses of the competitive landscape of the market and information about key companies, including:

  • ABM Industries Inc.
  • Aramark
  • BGIS Global Integrated Solutions
  • CBRE Group Inc.
  • Colliers International Group
  • Compass Group Plc
  • Cushman and Wakefield Plc
  • EMCOR Group Inc.
  • Equans SAS
  • ISS AS
  • Jones Lang LaSalle Inc.
  • Knight Frank LLP
  • Macro Group
  • Mitie Group plc
  • OCS Group International Ltd.
  • Samsic Group
  • Savills plc
  • Serco Group plc
  • Sodexo SA
  • SPIE SA
  • Veolia Environment SA

Qualitative and quantitative analysis of companies has been conducted to help clients understand the wider business environment as well as the strengths and weaknesses of key industry players. Data is qualitatively analyzed to categorize companies as pure play, category-focused, industry-focused, and diversified; it is quantitatively analyzed to categorize companies as dominant, leading, strong, tentative, and weak.

Recent Development and News in Facilities management market

  • In the Environmental and Facilities Services industry, the enforcement of the EU Waste Framework Directive has shifted corporate waste management toward circular economy models, directly impacting Facilities Management demand by necessitating advanced on-site recycling infrastructure and lowering landfill dependency by 35%.
  • The widespread integration of hydrometallurgical processing in hazardous waste treatment has optimized the recovery of rare earth materials, accelerating the requirement for specialized cleanroom servicing standards and rigorous environmental compliance frameworks within the Facilities Management sector.
  • The implementation of ISO 14001 environmental management protocols across heavy manufacturing sectors has catalyzed the adoption of automated building systems, forcing facility managers to continuously audit carbon footprint tracking data to maintain a 98% compliance threshold.
  • A structural shift toward localized procurement strategies in the broader logistics supply chain has mitigated bottlenecks for commercial cleaning agents, ensuring uninterrupted facility operational continuity and stabilizing inventory costs by up to 20% across expansive real estate portfolios.

Dive into Technavio’s robust research methodology, blending expert interviews, extensive data synthesis, and validated models for unparalleled Facilities Management Market insights. See full methodology.

Market Scope
Page number 301
Base year 2025
Historic period 2020-2024
Forecast period 2026-2030
Growth momentum & CAGR Accelerate at a CAGR of 9%
Market growth 2026-2030 USD 818.9 billion
Market structure Fragmented
YoY growth 2025-2026(%) 8.2%
Key countries US, Canada, Mexico, China, Japan, India, South Korea, Australia, Indonesia, Germany, UK, France, Italy, Spain, The Netherlands, Brazil, Argentina, Chile, Saudi Arabia, UAE, South Africa, Turkey and Israel
Competitive landscape Leading Companies, Market Positioning of Companies, Competitive Strategies, and Industry Risks

Request Free Sample

Research Analyst Overview

  • The structural evolution of the Facilities Management market reveals a definitive shift toward deeply connected, data-driven built environments. Corporate boardrooms are heavily prioritizing space utilization analytics to optimize real estate expenditures, directly influencing critical decisions regarding long-term lease renewals and hybrid workforce models. The deployment of predictive maintenance algorithms fundamentally transforms infrastructure oversight from reactive repair to continuous preservation.
  • Organizations utilizing digital twin technology to simulate and monitor mechanical operations have documented a 35% reduction in critical equipment downtime, thereby preserving continuous business productivity. Furthermore, the integration of intelligent climate control and energy consumption monitors aligns daily facility operations with stringent corporate governance requirements.
  • Modern facility networks also leverage biometric access control and hvac performance tracking to ensure occupant security while maintaining optimal environmental conditions. As enterprises scale globally, the transition toward outcome based contracting heavily incentivizes service providers to deliver measurable operational excellence. The continuous advancement of digital infrastructure fundamentally guarantees the long-term resilience and functional superiority of complex commercial assets.

What are the Key Data Covered in this Facilities Management Market Research and Growth Report?

  • What is the expected growth of the Facilities Management Market between 2026 and 2030?

    • USD 818.9 billion, at a CAGR of 9%

  • What segmentation does the market report cover?

    • The report is segmented by Service (Soft services, and Hard services), End-user (Commercial, Government, and Residential), Product Type (In house FM, and Outsourced FM) and Geography (North America, APAC, Europe, South America, Middle East and Africa)

  • Which regions are analyzed in the report?

    • North America, APAC, Europe, South America and Middle East and Africa

  • What are the key growth drivers and market challenges?

    • Integration of advanced technologies and artificial intelligence, Acute shortage of skilled technical workforce and labor retention

  • Who are the major players in the Facilities Management Market?

    • ABM Industries Inc., Aramark, BGIS Global Integrated Solutions, CBRE Group Inc., Colliers International Group, Compass Group Plc, Cushman and Wakefield Plc, EMCOR Group Inc., Equans SAS, ISS AS, Jones Lang LaSalle Inc., Knight Frank LLP, Macro Group, Mitie Group plc, OCS Group International Ltd., Samsic Group, Savills plc, Serco Group plc, Sodexo SA, SPIE SA and Veolia Environment SA

Market Research Insights

  • The Facilities Management market is undergoing rapid structural evolution, heavily influenced by environmental compliance frameworks and corporate sustainability mandates. Modern enterprises demand highly connected infrastructures, prompting a widespread shift toward automated building systems that seamlessly regulate daily utility usage. Organizations prioritizing energy efficiency retrofits have achieved a 25% reduction in baseline power consumption while improving overall asset longevity.
  • Furthermore, the integration of real time asset tracking allows facility managers to optimize resource deployment, decreasing administrative overhead by 18%. As corporate occupiers navigate complex hybrid work environments, the demand for integrated service portfolios continues to surge. This strategic reliance on external operational expertise ensures strict regulatory alignment while enabling businesses to redirect critical focus toward primary revenue-generating activities.

We can help! Our analysts can customize this facilities management market research report to meet your requirements.

Get in touch

1. Executive Summary

1.1 Market overview

Executive Summary - Chart on Market Overview
Executive Summary - Data Table on Market Overview
Executive Summary - Chart on Global Market Characteristics
Executive Summary - Chart on Market by Geography
Executive Summary - Chart on Market Segmentation by Service
Executive Summary - Chart on Market Segmentation by End-user
Executive Summary - Chart on Market Segmentation by Product Type
Executive Summary - Chart on Incremental Growth
Executive Summary - Data Table on Incremental Growth
Executive Summary - Chart on Company Market Positioning

2. Technavio Analysis

2.1 Analysis of price sensitivity, lifecycle, customer purchase basket, adoption rates, and purchase criteria

2.2 Criticality of inputs and Factors of differentiation

Chart on Overview on criticality of inputs and factors of differentiation

2.3 Factors of disruption

Chart on Overview on factors of disruption

2.4 Impact of drivers and challenges

Chart on Impact of drivers and challenges in 2025 and 2030

3. Market Landscape

3.1 Market ecosystem

Chart on Parent Market
Data Table on - Parent Market

3.2 Market characteristics

Chart on Market characteristics analysis

3.3 Value chain analysis

Chart on Value chain analysis

4. Market Sizing

4.1 Market definition

Data Table on Offerings of companies included in the market definition

4.2 Market segment analysis

Market segments

4.3 Market size 2025

4.4 Market outlook: Forecast for 2025-2030

Chart on Global - Market size and forecast 2025-2030 ($ billion)
Data Table on Global - Market size and forecast 2025-2030 ($ billion)
Chart on Global Market: Year-over-year growth 2025-2030 (%)
Data Table on Global Market: Year-over-year growth 2025-2030 (%)

5. Historic Market Size

5.1 Global Facilities Management Market 2020 - 2024

Historic Market Size - Data Table on Global Facilities Management Market 2020 - 2024 ($ billion)

5.2 Service segment analysis 2020 - 2024

Historic Market Size - Service Segment 2020 - 2024 ($ billion)

5.3 End-user segment analysis 2020 - 2024

Historic Market Size - End-user Segment 2020 - 2024 ($ billion)

5.4 Product Type segment analysis 2020 - 2024

Historic Market Size - Product Type Segment 2020 - 2024 ($ billion)

5.5 Geography segment analysis 2020 - 2024

Historic Market Size - Geography Segment 2020 - 2024 ($ billion)

5.6 Country segment analysis 2020 - 2024

Historic Market Size - Country Segment 2020 - 2024 ($ billion)

6. Qualitative Analysis

6.1 Impact of AI on global facilities management market

6.2 Impact of geopolitical conflicts on global facilities management market

7. Five Forces Analysis

7.1 Five forces summary

Five forces analysis - Comparison between 2025 and 2030

7.2 Bargaining power of buyers

Bargaining power of buyers - Impact of key factors 2025 and 2030

7.3 Bargaining power of suppliers

Bargaining power of suppliers - Impact of key factors in 2025 and 2030

7.4 Threat of new entrants

Threat of new entrants - Impact of key factors in 2025 and 2030

7.5 Threat of substitutes

Threat of substitutes - Impact of key factors in 2025 and 2030

7.6 Threat of rivalry

Threat of rivalry - Impact of key factors in 2025 and 2030

7.7 Market condition

Chart on Market condition - Five forces 2025 and 2030

8. Market Segmentation by Service

8.1 Market segments

Chart on Service - Market share 2025-2030 (%)
Data Table on Service - Market share 2025-2030 (%)

8.2 Comparison by Service

Chart on Comparison by Service
Data Table on Comparison by Service

8.3 Soft services - Market size and forecast 2025-2030

Chart on Soft services - Market size and forecast 2025-2030 ($ billion)
Data Table on Soft services - Market size and forecast 2025-2030 ($ billion)
Chart on Soft services - Year-over-year growth 2025-2030 (%)
Data Table on Soft services - Year-over-year growth 2025-2030 (%)

8.4 Hard services - Market size and forecast 2025-2030

Chart on Hard services - Market size and forecast 2025-2030 ($ billion)
Data Table on Hard services - Market size and forecast 2025-2030 ($ billion)
Chart on Hard services - Year-over-year growth 2025-2030 (%)
Data Table on Hard services - Year-over-year growth 2025-2030 (%)

8.5 Market opportunity by Service

Market opportunity by Service ($ billion)
Data Table on Market opportunity by Service ($ billion)

9. Market Segmentation by End-user

9.1 Market segments

Chart on End-user - Market share 2025-2030 (%)
Data Table on End-user - Market share 2025-2030 (%)

9.2 Comparison by End-user

Chart on Comparison by End-user
Data Table on Comparison by End-user

9.3 Commercial - Market size and forecast 2025-2030

Chart on Commercial - Market size and forecast 2025-2030 ($ billion)
Data Table on Commercial - Market size and forecast 2025-2030 ($ billion)
Chart on Commercial - Year-over-year growth 2025-2030 (%)
Data Table on Commercial - Year-over-year growth 2025-2030 (%)

9.4 Government - Market size and forecast 2025-2030

Chart on Government - Market size and forecast 2025-2030 ($ billion)
Data Table on Government - Market size and forecast 2025-2030 ($ billion)
Chart on Government - Year-over-year growth 2025-2030 (%)
Data Table on Government - Year-over-year growth 2025-2030 (%)

9.5 Residential - Market size and forecast 2025-2030

Chart on Residential - Market size and forecast 2025-2030 ($ billion)
Data Table on Residential - Market size and forecast 2025-2030 ($ billion)
Chart on Residential - Year-over-year growth 2025-2030 (%)
Data Table on Residential - Year-over-year growth 2025-2030 (%)

9.6 Market opportunity by End-user

Market opportunity by End-user ($ billion)
Data Table on Market opportunity by End-user ($ billion)

10. Market Segmentation by Product Type

10.1 Market segments

Chart on Product Type - Market share 2025-2030 (%)
Data Table on Product Type - Market share 2025-2030 (%)

10.2 Comparison by Product Type

Chart on Comparison by Product Type
Data Table on Comparison by Product Type

10.3 In house FM - Market size and forecast 2025-2030

Chart on In house FM - Market size and forecast 2025-2030 ($ billion)
Data Table on In house FM - Market size and forecast 2025-2030 ($ billion)
Chart on In house FM - Year-over-year growth 2025-2030 (%)
Data Table on In house FM - Year-over-year growth 2025-2030 (%)

10.4 Outsourced FM - Market size and forecast 2025-2030

Chart on Outsourced FM - Market size and forecast 2025-2030 ($ billion)
Data Table on Outsourced FM - Market size and forecast 2025-2030 ($ billion)
Chart on Outsourced FM - Year-over-year growth 2025-2030 (%)
Data Table on Outsourced FM - Year-over-year growth 2025-2030 (%)

10.5 Market opportunity by Product Type

Market opportunity by Product Type ($ billion)
Data Table on Market opportunity by Product Type ($ billion)

11. Customer Landscape

11.1 Customer landscape overview

Analysis of price sensitivity, lifecycle, customer purchase basket, adoption rates, and purchase criteria

12. Geographic Landscape

12.1 Geographic segmentation

Chart on Market share by geography 2025-2030 (%)
Data Table on Market share by geography 2025-2030 (%)

12.2 Geographic comparison

Chart on Geographic comparison
Data Table on Geographic comparison

12.3 North America - Market size and forecast 2025-2030

Chart on North America - Market size and forecast 2025-2030 ($ billion)
Data Table on North America - Market size and forecast 2025-2030 ($ billion)
Chart on North America - Year-over-year growth 2025-2030 (%)
Data Table on North America - Year-over-year growth 2025-2030 (%)
Chart on Regional Comparison - North America
Data Table on Regional Comparison - North America

12.3.1 US - Market size and forecast 2025-2030

Chart on US - Market size and forecast 2025-2030 ($ billion)
Data Table on US - Market size and forecast 2025-2030 ($ billion)
Chart on US - Year-over-year growth 2025-2030 (%)
Data Table on US - Year-over-year growth 2025-2030 (%)

12.3.2 Canada - Market size and forecast 2025-2030

Chart on Canada - Market size and forecast 2025-2030 ($ billion)
Data Table on Canada - Market size and forecast 2025-2030 ($ billion)
Chart on Canada - Year-over-year growth 2025-2030 (%)
Data Table on Canada - Year-over-year growth 2025-2030 (%)

12.3.3 Mexico - Market size and forecast 2025-2030

Chart on Mexico - Market size and forecast 2025-2030 ($ billion)
Data Table on Mexico - Market size and forecast 2025-2030 ($ billion)
Chart on Mexico - Year-over-year growth 2025-2030 (%)
Data Table on Mexico - Year-over-year growth 2025-2030 (%)

12.4 APAC - Market size and forecast 2025-2030

Chart on APAC - Market size and forecast 2025-2030 ($ billion)
Data Table on APAC - Market size and forecast 2025-2030 ($ billion)
Chart on APAC - Year-over-year growth 2025-2030 (%)
Data Table on APAC - Year-over-year growth 2025-2030 (%)
Chart on Regional Comparison - APAC
Data Table on Regional Comparison - APAC

12.4.1 China - Market size and forecast 2025-2030

Chart on China - Market size and forecast 2025-2030 ($ billion)
Data Table on China - Market size and forecast 2025-2030 ($ billion)
Chart on China - Year-over-year growth 2025-2030 (%)
Data Table on China - Year-over-year growth 2025-2030 (%)

12.4.2 Japan - Market size and forecast 2025-2030

Chart on Japan - Market size and forecast 2025-2030 ($ billion)
Data Table on Japan - Market size and forecast 2025-2030 ($ billion)
Chart on Japan - Year-over-year growth 2025-2030 (%)
Data Table on Japan - Year-over-year growth 2025-2030 (%)

12.4.3 India - Market size and forecast 2025-2030

Chart on India - Market size and forecast 2025-2030 ($ billion)
Data Table on India - Market size and forecast 2025-2030 ($ billion)
Chart on India - Year-over-year growth 2025-2030 (%)
Data Table on India - Year-over-year growth 2025-2030 (%)

12.4.4 South Korea - Market size and forecast 2025-2030

Chart on South Korea - Market size and forecast 2025-2030 ($ billion)
Data Table on South Korea - Market size and forecast 2025-2030 ($ billion)
Chart on South Korea - Year-over-year growth 2025-2030 (%)
Data Table on South Korea - Year-over-year growth 2025-2030 (%)

12.4.5 Australia - Market size and forecast 2025-2030

Chart on Australia - Market size and forecast 2025-2030 ($ billion)
Data Table on Australia - Market size and forecast 2025-2030 ($ billion)
Chart on Australia - Year-over-year growth 2025-2030 (%)
Data Table on Australia - Year-over-year growth 2025-2030 (%)

12.4.6 Indonesia - Market size and forecast 2025-2030

Chart on Indonesia - Market size and forecast 2025-2030 ($ billion)
Data Table on Indonesia - Market size and forecast 2025-2030 ($ billion)
Chart on Indonesia - Year-over-year growth 2025-2030 (%)
Data Table on Indonesia - Year-over-year growth 2025-2030 (%)

12.5 Europe - Market size and forecast 2025-2030

Chart on Europe - Market size and forecast 2025-2030 ($ billion)
Data Table on Europe - Market size and forecast 2025-2030 ($ billion)
Chart on Europe - Year-over-year growth 2025-2030 (%)
Data Table on Europe - Year-over-year growth 2025-2030 (%)
Chart on Regional Comparison - Europe
Data Table on Regional Comparison - Europe

12.5.1 Germany - Market size and forecast 2025-2030

Chart on Germany - Market size and forecast 2025-2030 ($ billion)
Data Table on Germany - Market size and forecast 2025-2030 ($ billion)
Chart on Germany - Year-over-year growth 2025-2030 (%)
Data Table on Germany - Year-over-year growth 2025-2030 (%)

12.5.2 UK - Market size and forecast 2025-2030

Chart on UK - Market size and forecast 2025-2030 ($ billion)
Data Table on UK - Market size and forecast 2025-2030 ($ billion)
Chart on UK - Year-over-year growth 2025-2030 (%)
Data Table on UK - Year-over-year growth 2025-2030 (%)

12.5.3 France - Market size and forecast 2025-2030

Chart on France - Market size and forecast 2025-2030 ($ billion)
Data Table on France - Market size and forecast 2025-2030 ($ billion)
Chart on France - Year-over-year growth 2025-2030 (%)
Data Table on France - Year-over-year growth 2025-2030 (%)

12.5.4 Italy - Market size and forecast 2025-2030

Chart on Italy - Market size and forecast 2025-2030 ($ billion)
Data Table on Italy - Market size and forecast 2025-2030 ($ billion)
Chart on Italy - Year-over-year growth 2025-2030 (%)
Data Table on Italy - Year-over-year growth 2025-2030 (%)

12.5.5 Spain - Market size and forecast 2025-2030

Chart on Spain - Market size and forecast 2025-2030 ($ billion)
Data Table on Spain - Market size and forecast 2025-2030 ($ billion)
Chart on Spain - Year-over-year growth 2025-2030 (%)
Data Table on Spain - Year-over-year growth 2025-2030 (%)

12.5.6 The Netherlands - Market size and forecast 2025-2030

Chart on The Netherlands - Market size and forecast 2025-2030 ($ billion)
Data Table on The Netherlands - Market size and forecast 2025-2030 ($ billion)
Chart on The Netherlands - Year-over-year growth 2025-2030 (%)
Data Table on The Netherlands - Year-over-year growth 2025-2030 (%)

12.6 South America - Market size and forecast 2025-2030

Chart on South America - Market size and forecast 2025-2030 ($ billion)
Data Table on South America - Market size and forecast 2025-2030 ($ billion)
Chart on South America - Year-over-year growth 2025-2030 (%)
Data Table on South America - Year-over-year growth 2025-2030 (%)
Chart on Regional Comparison - South America
Data Table on Regional Comparison - South America

12.6.1 Brazil - Market size and forecast 2025-2030

Chart on Brazil - Market size and forecast 2025-2030 ($ billion)
Data Table on Brazil - Market size and forecast 2025-2030 ($ billion)
Chart on Brazil - Year-over-year growth 2025-2030 (%)
Data Table on Brazil - Year-over-year growth 2025-2030 (%)

12.6.2 Argentina - Market size and forecast 2025-2030

Chart on Argentina - Market size and forecast 2025-2030 ($ billion)
Data Table on Argentina - Market size and forecast 2025-2030 ($ billion)
Chart on Argentina - Year-over-year growth 2025-2030 (%)
Data Table on Argentina - Year-over-year growth 2025-2030 (%)

12.6.3 Chile - Market size and forecast 2025-2030

Chart on Chile - Market size and forecast 2025-2030 ($ billion)
Data Table on Chile - Market size and forecast 2025-2030 ($ billion)
Chart on Chile - Year-over-year growth 2025-2030 (%)
Data Table on Chile - Year-over-year growth 2025-2030 (%)

12.7 Middle East and Africa - Market size and forecast 2025-2030

Chart on Middle East and Africa - Market size and forecast 2025-2030 ($ billion)
Data Table on Middle East and Africa - Market size and forecast 2025-2030 ($ billion)
Chart on Middle East and Africa - Year-over-year growth 2025-2030 (%)
Data Table on Middle East and Africa - Year-over-year growth 2025-2030 (%)
Chart on Regional Comparison - Middle East and Africa
Data Table on Regional Comparison - Middle East and Africa

12.7.1 Saudi Arabia - Market size and forecast 2025-2030

Chart on Saudi Arabia - Market size and forecast 2025-2030 ($ billion)
Data Table on Saudi Arabia - Market size and forecast 2025-2030 ($ billion)
Chart on Saudi Arabia - Year-over-year growth 2025-2030 (%)
Data Table on Saudi Arabia - Year-over-year growth 2025-2030 (%)

12.7.2 UAE - Market size and forecast 2025-2030

Chart on UAE - Market size and forecast 2025-2030 ($ billion)
Data Table on UAE - Market size and forecast 2025-2030 ($ billion)
Chart on UAE - Year-over-year growth 2025-2030 (%)
Data Table on UAE - Year-over-year growth 2025-2030 (%)

12.7.3 South Africa - Market size and forecast 2025-2030

Chart on South Africa - Market size and forecast 2025-2030 ($ billion)
Data Table on South Africa - Market size and forecast 2025-2030 ($ billion)
Chart on South Africa - Year-over-year growth 2025-2030 (%)
Data Table on South Africa - Year-over-year growth 2025-2030 (%)

12.7.4 Turkey - Market size and forecast 2025-2030

Chart on Turkey - Market size and forecast 2025-2030 ($ billion)
Data Table on Turkey - Market size and forecast 2025-2030 ($ billion)
Chart on Turkey - Year-over-year growth 2025-2030 (%)
Data Table on Turkey - Year-over-year growth 2025-2030 (%)

12.7.5 Israel - Market size and forecast 2025-2030

Chart on Israel - Market size and forecast 2025-2030 ($ billion)
Data Table on Israel - Market size and forecast 2025-2030 ($ billion)
Chart on Israel - Year-over-year growth 2025-2030 (%)
Data Table on Israel - Year-over-year growth 2025-2030 (%)

12.8 Market opportunity by geography

Market opportunity by geography ($ billion)
Data Tables on Market opportunity by geography ($ billion)

13. Drivers, Challenges, and Opportunity

13.1 Market drivers

Integration of advanced technologies and artificial intelligence
Stringent environmental regulations and sustainability imperatives
Evolution of hybrid work models and flexible workspace management

13.2 Market challenges

Acute shortage of skilled technical workforce and labor retention
Escalating margin pressures and intense price competition
Managing cybersecurity vulnerabilities in connected building infrastructure

13.3 Impact of drivers and challenges

Impact of drivers and challenges in 2025 and 2030

13.4 Market opportunities

Shift toward outcome based contracting and performance metrics
Company consolidation and rise of integrated service portfolios
Prioritization of supply chain resilience and localized procurement

14. Competitive Landscape

14.1 Overview

14.2

Overview on criticality of inputs and factors of differentiation

14.3 Landscape disruption

Overview on factors of disruption

14.4 Industry risks

Impact of key risks on business

15. Competitive Analysis

15.1 Companies profiled

Companies covered

15.2 Company ranking index

15.3 Market positioning of companies

Matrix on companies position and classification

15.4 ABM Industries Inc.

ABM Industries Inc. - Overview
ABM Industries Inc. - Business segments
ABM Industries Inc. - Key offerings
ABM Industries Inc. - Segment focus
SWOT

15.5 Aramark

Aramark - Overview
Aramark - Business segments
Aramark - Key offerings
Aramark - Segment focus
SWOT

15.6 CBRE Group Inc.

CBRE Group Inc. - Overview
CBRE Group Inc. - Business segments
CBRE Group Inc. - Key offerings
CBRE Group Inc. - Segment focus
SWOT

15.7 Colliers International Group

Colliers International Group - Overview
Colliers International Group - Business segments
Colliers International Group - Key offerings
Colliers International Group - Segment focus
SWOT

15.8 Compass Group Plc

Compass Group Plc - Overview
Compass Group Plc - Business segments
Compass Group Plc - Key offerings
Compass Group Plc - Segment focus
SWOT

15.9 Cushman and Wakefield Plc

Cushman and Wakefield Plc - Overview
Cushman and Wakefield Plc - Business segments
Cushman and Wakefield Plc - Key offerings
Cushman and Wakefield Plc - Segment focus
SWOT

15.10 EMCOR Group Inc.

EMCOR Group Inc. - Overview
EMCOR Group Inc. - Business segments
EMCOR Group Inc. - Key offerings
EMCOR Group Inc. - Segment focus
SWOT

15.11 ISS AS

ISS AS - Overview
ISS AS - Business segments
ISS AS - Key offerings
ISS AS - Segment focus
SWOT

15.12 Jones Lang LaSalle Inc.

Jones Lang LaSalle Inc. - Overview
Jones Lang LaSalle Inc. - Business segments
Jones Lang LaSalle Inc. - Key offerings
Jones Lang LaSalle Inc. - Segment focus
SWOT

15.13 Mitie Group plc

Mitie Group plc - Overview
Mitie Group plc - Business segments
Mitie Group plc - Key offerings
Mitie Group plc - Segment focus
SWOT

15.14 Savills plc

Savills plc - Overview
Savills plc - Business segments
Savills plc - Key offerings
Savills plc - Segment focus
SWOT

15.15 Serco Group plc

Serco Group plc - Overview
Serco Group plc - Business segments
Serco Group plc - Key offerings
Serco Group plc - Segment focus
SWOT

15.16 Sodexo SA

Sodexo SA - Overview
Sodexo SA - Business segments
Sodexo SA - Key news
Sodexo SA - Key offerings
Sodexo SA - Segment focus
SWOT

15.17 SPIE SA

SPIE SA - Overview
SPIE SA - Business segments
SPIE SA - Key offerings
SPIE SA - Segment focus
SWOT

15.18 Veolia Environment SA

Veolia Environment SA - Overview
Veolia Environment SA - Business segments
Veolia Environment SA - Key news
Veolia Environment SA - Key offerings
Veolia Environment SA - Segment focus
SWOT

16. Appendix

16.1 Scope of the report

Market definition
Objectives
Notes and caveats

16.2 Inclusions and exclusions checklist

Inclusions checklist
Exclusions checklist

16.3 Currency conversion rates for US$

16.4 Research methodology

16.5 Data procurement

Information sources

16.6 Data validation

16.7 Validation techniques employed for market sizing

16.8 Data synthesis

16.9 360 degree market analysis

16.10 List of abbreviations

Research Methodology

Technavio presents a detailed picture of the market by way of study, synthesis, and summation of data from multiple sources. The analysts have presented the various facets of the market with a particular focus on identifying the key industry influencers. The data thus presented is comprehensive, reliable, and the result of extensive research, both primary and secondary.

INFORMATION SOURCES

Primary sources

  • Manufacturers and suppliers
  • Channel partners
  • Industry experts
  • Strategic decision makers

Secondary sources

  • Industry journals and periodicals
  • Government data
  • Financial reports of key industry players
  • Historical data
  • Press releases

DATA ANALYSIS

Data Synthesis

  • Collation of data
  • Estimation of key figures
  • Analysis of derived insights

Data Validation

  • Triangulation with data models
  • Reference against proprietary databases
  • Corroboration with industry experts

REPORT WRITING

Qualitative

  • Market drivers
  • Market challenges
  • Market trends
  • Five forces analysis

Quantitative

  • Market size and forecast
  • Market segmentation
  • Geographical insights
  • Competitive landscape

Interested in this report?

Get your sample now to see our research methodology and insights!

Download Now

Frequently Asked Questions

Facilities Management market growth will increase by USD 818.9 billion during 2026-2030.

The Facilities Management market is expected to grow at a CAGR of 9% during 2026-2030.

Facilities Management market is segmented by Service (Soft services, Hard services) End-user (Commercial, Government, Residential) Product type (In house FM, Outsourced FM)

ABM Industries Inc., Aramark, BGIS Global Integrated Solutions, CBRE Group Inc., Colliers International Group, Compass Group Plc, Cushman and Wakefield Plc, EMCOR Group Inc., Equans SAS, ISS AS, Jones Lang LaSalle Inc., Knight Frank LLP, Macro Group, Mitie Group plc, OCS Group International Ltd., Samsic Group, Savills plc, Serco Group plc, Sodexo SA, SPIE SA, Veolia Environment SA are a few of the key vendors in the Facilities Management market.

North America will register the highest growth rate of 39.7% among the other regions. Therefore, the Facilities Management market in North America is expected to garner significant business opportunities for the vendors during the forecast period.

US, Canada, Mexico, China, Japan, India, South Korea, Australia, Indonesia, Germany, UK, France, Italy, Spain, The Netherlands, Brazil, Argentina, Chile, Saudi Arabia, UAE, South Africa, Turkey, Israel

  • Integration of advanced technologies and artificial intelligence is the driving factor this market.

The Facilities Management market vendors should focus on grabbing business opportunities from the Service segment as it accounted for the largest market share in the base year.
RIA - Research AI Assistant
Ask RIA
