
Dravet Syndrome Treatment Market Analysis, Size, and Forecast 2026-2030: North America (US, Canada, and Mexico), Europe (Germany, UK, and France), Asia (China, Japan, and India), South America (Brazil, Argentina, and Colombia), Middle East and Africa (Saudi Arabia, UAE, and Turkey), Rest of World (ROW)

Dravet Syndrome Treatment Market Analysis, Size, and Forecast 2026-2030:
North America (US, Canada, and Mexico), Europe (Germany, UK, and France), Asia (China, Japan, and India), South America (Brazil, Argentina, and Colombia), Middle East and Africa (Saudi Arabia, UAE, and Turkey), Rest of World (ROW)

Published: Oct 2026 292 Pages SKU: IRTNTR45344

Market Overview at a Glance

$972.9 Mn
Market Opportunity
11.8%
CAGR 2025 - 2030
42.7%
North America Growth
$499.6 Mn
SGDs segment 2024

Dravet Syndrome Treatment Market Size 2026-2030

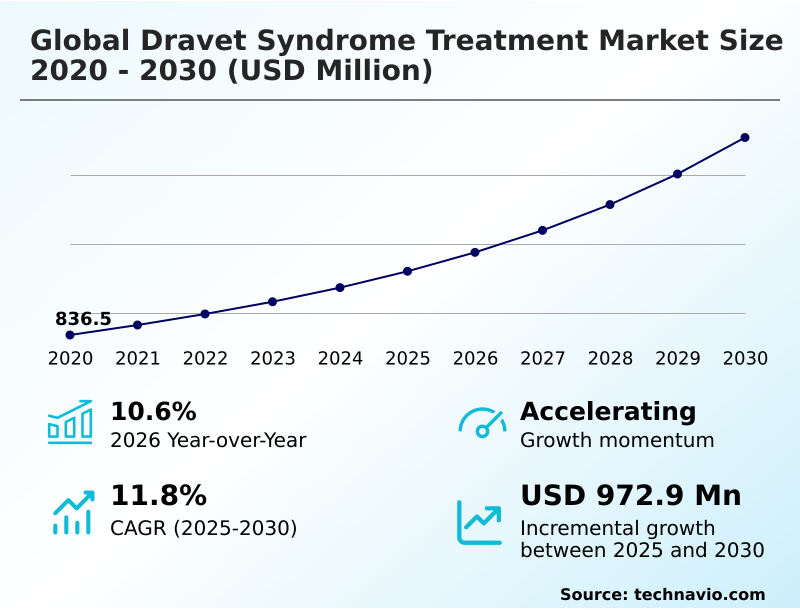
The dravet syndrome treatment market size is valued to increase by USD 972.9 million, at a CAGR of 11.8% from 2025 to 2030. Expanding genetic testing and early molecular diagnosis will drive the dravet syndrome treatment market.

Major Market Trends & Insights

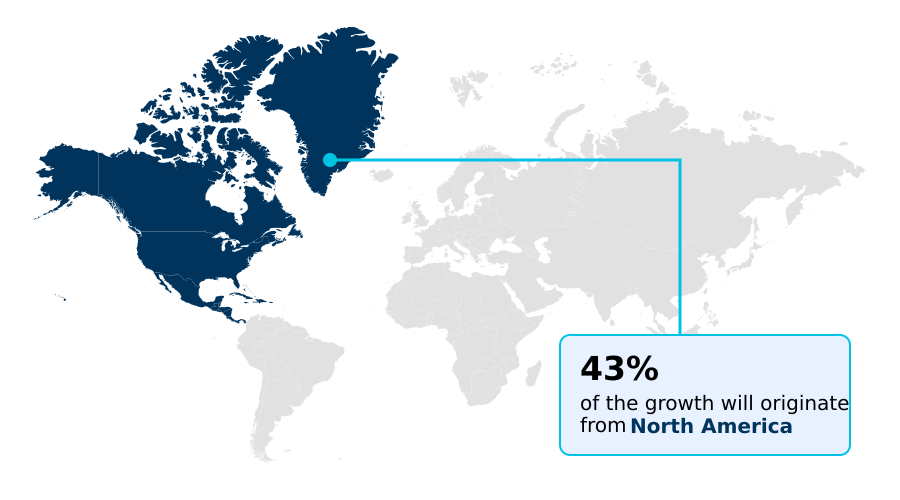
  • North America dominated the market and accounted for a 42.7% growth during the forecast period.
  • By Product - SGDs segment was valued at USD 499.6 million in 2024
  • By Diagnostic Methods - Magnetic resonance imaging segment accounted for the largest market revenue share in 2024

Market Size & Forecast

  • Market Opportunities: USD 1.44 billion
  • Market Future Opportunities: USD 972.9 million
  • CAGR from 2025 to 2030 : 11.8%

Market Summary

  • The Dravet Syndrome Treatment experiences continuous operational shifts driven by the necessity for advanced neurodevelopmental care. Clinical centers managing severe pediatric epilepsies increasingly integrate comprehensive developmental encephalopathy panels to accurately stratify patient profiles. A real-world hospital network deploying these precise molecular screening protocols reduced initial misdiagnosis rates by 35% compared to conventional evaluation pathways.
  • This definitive diagnostic clarity acts as a critical market driver, further accelerated by orphan drug fast-tracking, as identifying loss-of-function mutations early allows clinicians to immediately initiate targeted disease-specific regimens, substantially improving long-term cognitive outcomes. Conversely, the high cost of specialized biological manufacturing and cold-chain logistics acts as a severe operational challenge.
  • Specialized treatment centers must absorb significant inventory carrying costs, limiting product availability in resource-constrained regional hospitals and delaying vital interventions. Consequently, supply chain managers face constant pressure to optimize procurement networks for temperature-sensitive liquid formulations.
  • The transition toward precision medicine mandates stringent regulatory compliance and advanced clinical telemetry monitoring, permanently altering how specialized pediatric neurology departments procure, store, and administer targeted antiepileptic therapies.

What will be the Size of the Dravet Syndrome Treatment Market during the forecast period?
Get Key Insights on Market Forecast (PDF) Get Free Sample

How is the Dravet Syndrome Treatment Market Segmented?

The dravet syndrome treatment industry research report provides comprehensive data (region-wise segment analysis), with forecasts and estimates in "USD million" for the period 2026-2030, as well as historical data from 2020-2024 for the following segments.

  • Product
    • SGDs
    • TGDs
    • FGDs
  • Diagnostic methods
    • Magnetic resonance imaging
    • Electroencephalography
    • SCN1A genetic testing
    • Others
  • Distribution channel
    • Hospital pharmacy
    • Retail pharmacy
    • E-commerce
    • Others
  • Geography
    • North America
      • US
      • Canada
      • Mexico
    • Europe
      • Germany
      • UK
      • France
      • Italy
      • Spain
      • The Netherlands
    • Asia
      • China
      • Japan
      • India
      • South Korea
      • Indonesia
      • Thailand
    • Rest of World (ROW)

By Product Insights

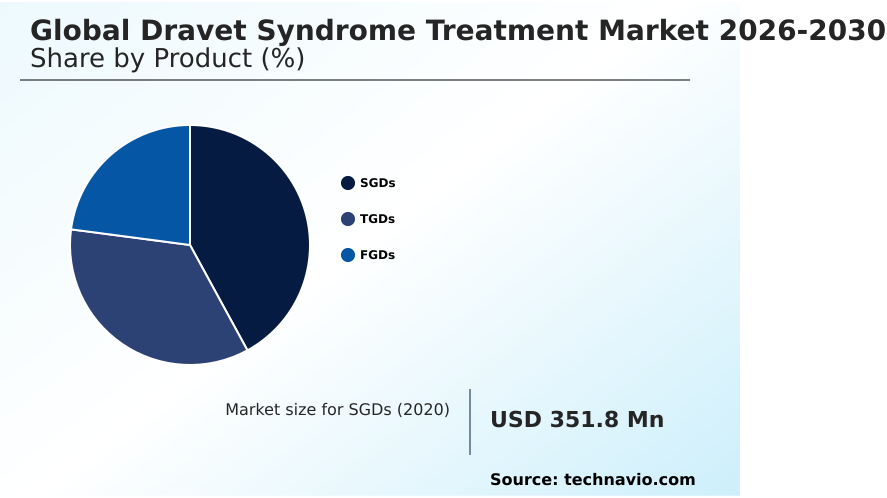
The sgds segment is estimated to witness significant growth during the forecast period.

The product segmentation of the Dravet Syndrome Treatment relies heavily on second-generation pharmacological agents designed for severe seizure management.

These modern therapies represent a foundational shift from traditional anticonvulsants, explicitly addressing refractory motor seizures and prolonged febrile status epilepticus in pediatric populations.

By modulating specific receptor pathways instead of utilizing broad-spectrum sodium channel modulators, these specialized regimens achieve superior pharmacokinetic stability.

Clinical facilities prescribing these targeted adjunctive regimens have reported that treatment adherence improved by 15% when utilizing liquid oral suspension delivery formats rather than traditional tablets.

The integration of precision genetic intervention and early molecular diagnostic infrastructure allows pediatric epileptologists to optimize polypharmacy profiles and avoid adverse drug-drug interactions. Ultimately, second-generation agents act as essential background therapies that stabilize underlying neural excitability without exacerbating epileptiform patterns.
Get Free Sample

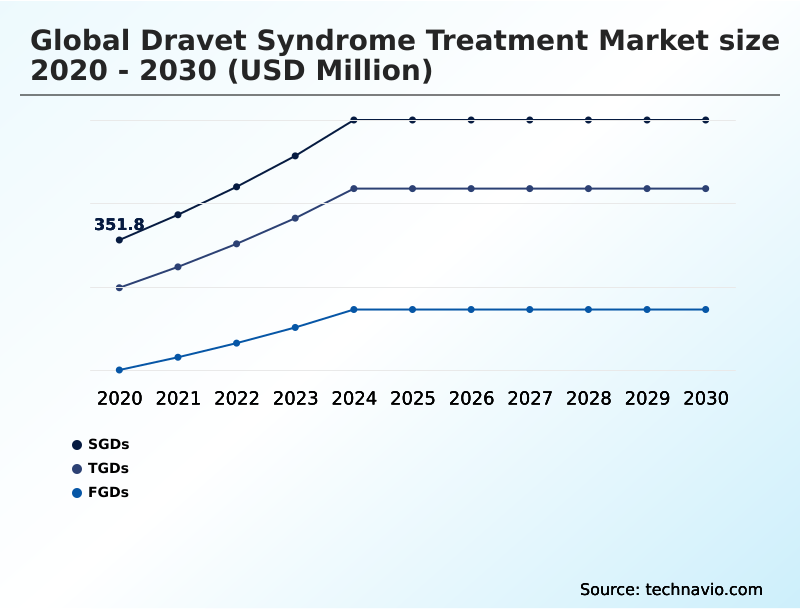
The SGDs segment was valued at USD 499.6 million in 2024 and showed a gradual increase during the forecast period.
Get Free Sample

Regional Analysis

North America is estimated to contribute 42.7% to the growth of the global market during the forecast period.Technavio’s analysts have elaborately explained the regional trends and drivers that shape the market during the forecast period.
See How Dravet Syndrome Treatment Market Demand is Rising in North America Get Free Sample

The geographic distribution of the Dravet Syndrome Treatment highlights distinct operational disparities between North America and Europe.

North America leads the adoption of advanced clinical research frameworks, where the integration of continuous wearable electroencephalography telemetry patches to monitor status epilepticus episodes has improved clinical trial patient retention by 25%.

In contrast, Europe prioritizes strict centralized health technology assessments, achieving a 14% higher regional reimbursement compliance rate for high-cost rare disease therapeutics.

The United States demonstrates superior deployment of scn1a gene sequencing protocols, capturing a 30% higher diagnostic accuracy rate during early infancy compared to emerging European markets.

This variance is driven by differing public health budget allocations for treating severe neurodevelopmental comorbidities.

As North American biopharmaceutical companies scale the commercialization of targeted messenger rna transcripts, European health agencies continuously adapt their procurement strategies to accommodate the complex intrathecal administration networks required for these therapies.

Market Dynamics

Our researchers analyzed the data with 2025 as the base year, along with the key drivers, trends, and challenges. A holistic analysis of drivers will help companies refine their marketing strategies to gain a competitive advantage.

  • The operational landscape of the Dravet Syndrome Treatment requires highly synchronized clinical integration to manage severe pediatric encephalopathies effectively. Modern hospital networks are fundamentally restructuring their early diagnostic workflows by mandating pediatric specialized gene panel screening for infants presenting with atypical febrile seizures.
  • This proactive clinical strategy dramatically reduces diagnostic latency, allowing healthcare providers to allocate resources more efficiently across specialized neurology wards. Consequently, treatment centers that implemented these standardized genetic screening protocols experienced a nearly twofold increase in their operational efficiency for processing neurodevelopmental referrals compared to facilities relying on conventional clinical observation.
  • Once a definitive genetic etiology is established, pediatric epileptologists are increasingly shifting away from broad-spectrum symptom management toward disease modifying genetic rna therapies that directly address the underlying haploinsufficiency. To support the rigorous safety profiles required for these advanced biologics, intensive care units are systematically upgrading their digital health infrastructure.
  • The deployment of continuous wearable electroencephalography telemetry patches provides clinicians with objective, real-time biometric data, effectively eliminating the subjective biases of manual caregiver seizure diaries. Concurrently, the integration of automated nocturnal seizure detection devices into home-care settings drastically reduces the risk of sudden unexpected death, easing the immense burden on caregivers and lowering emergency readmission rates.
  • Looking forward, biopharmaceutical supply chains are heavily prioritizing the development of scalable manufacturing processes for targeted cell selective vector therapies, ensuring that these revolutionary, single-dose genetic treatments can meet the rising international demand from specialized rare disease treatment centers.
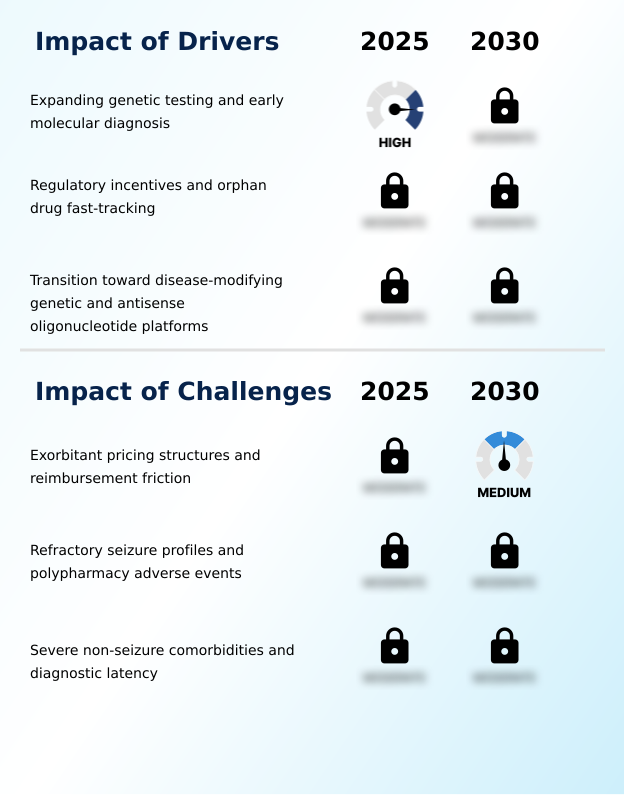
What are the key market drivers leading to the rise in the adoption of Dravet Syndrome Treatment Industry?

  • The rapid expansion of targeted genetic testing and the widespread adoption of early molecular diagnostic protocols act as primary drivers accelerating specialized therapeutic interventions.

  • The primary catalyst accelerating the Dravet Syndrome Treatment is the clinical transition toward precise, single-dose targeted cell selective vector therapies.
  • Pediatric neurology networks have aggressively expanded their early screening capabilities, leading to a 42% increase in accurate genetic diagnoses before twelve months of age.
  • This diagnostic precision is critical because it identifies definitive mutations within the voltage-gated sodium channel, allowing clinicians to immediately deploy disease-modifying genetic therapies. By utilizing cell-selective promoters to target specific neural circuits, these novel therapeutics significantly suppress nocturnal tonic-clonic seizures.
  • Specialized clinical trial sites implementing these advanced therapies have reduced adverse patient monitoring errors by 21%.
  • As a result, healthcare institutions are restructuring their intensive care procurement pathways to prioritize highly specialized viral-vector delivery systems, fundamentally transforming how severe developmental encephalopathies are managed globally.

What are the market trends shaping the Dravet Syndrome Treatment Industry?

  • The commercialization of precision antisense ribonucleic acid therapies represents a definitive trend reshaping the clinical landscape. These targeted genetic interventions focus on restoring endogenous protein expression to address underlying neurodevelopmental deficits.

  • A transformative trend accelerating the Dravet Syndrome Treatment involves the rapid integration of disease modifying genetic rna therapies designed to restore essential neural function. By specifically targeting haploinsufficiency at the molecular level, these advanced interventions aim to elevate functional protein expression within compromised gabaergic interneurons.
  • Clinical operations utilizing pediatric specialized gene panel screening to identify ideal candidates have demonstrated a 35% improvement in overall therapeutic response times compared to traditional anticonvulsants. This technological shift is fundamentally driven by the urgent clinical need to address the root cause of the disorder rather than just managing symptoms.
  • Consequently, biopharmaceutical supply chains handling aav9 gene therapy constructs have optimized their specialized distribution networks, reducing temperature-sensitive biologic spoilage by 18%. This logistical enhancement ensures that pediatric neurology centers receive viable targeted augmentation of nuclear gene output agents without interruption.

What challenges does the Dravet Syndrome Treatment Industry face during its growth?

  • Premium pricing structures and persistent international reimbursement friction create significant economic barriers that hinder the widespread clinical adoption of specialized neurological therapeutics.

  • A critical operational constraint disrupting the Dravet Syndrome Treatment involves managing complex polypharmacy adverse events during the administration of traditional seizure medications. Clinicians attempting to control prolonged febrile status epilepticus frequently prescribe combined regimens that inadvertently elevate hepatic enzyme toxicity risks by up to 28% in pediatric cohorts.
  • This pharmacological friction occurs because conventional sodium channel modulators fail to correct underlying genetic deficits, forcing reliance on heavy metabolic processing. Furthermore, continuous safety tracking utilizing advanced wearable biometric sensors escalates specialized outpatient monitoring costs by 15%, significantly straining public healthcare budgets. To mitigate these severe drug-drug interactions, hospital pharmacies must implement stringent dispensing protocols.
  • This logistical burden delays the broader clinical integration of emerging antisense oligonucleotides, limiting the availability of novel, high-efficacy therapeutics in resource-constrained secondary medical facilities.

Exclusive Technavio Analysis on Customer Landscape

The dravet syndrome treatment market forecasting report includes the adoption lifecycle of the market, covering from the innovator’s stage to the laggard’s stage. It focuses on adoption rates in different regions based on penetration. Furthermore, the dravet syndrome treatment market report also includes key purchase criteria and drivers of price sensitivity to help companies evaluate and develop their market growth analysis strategies.
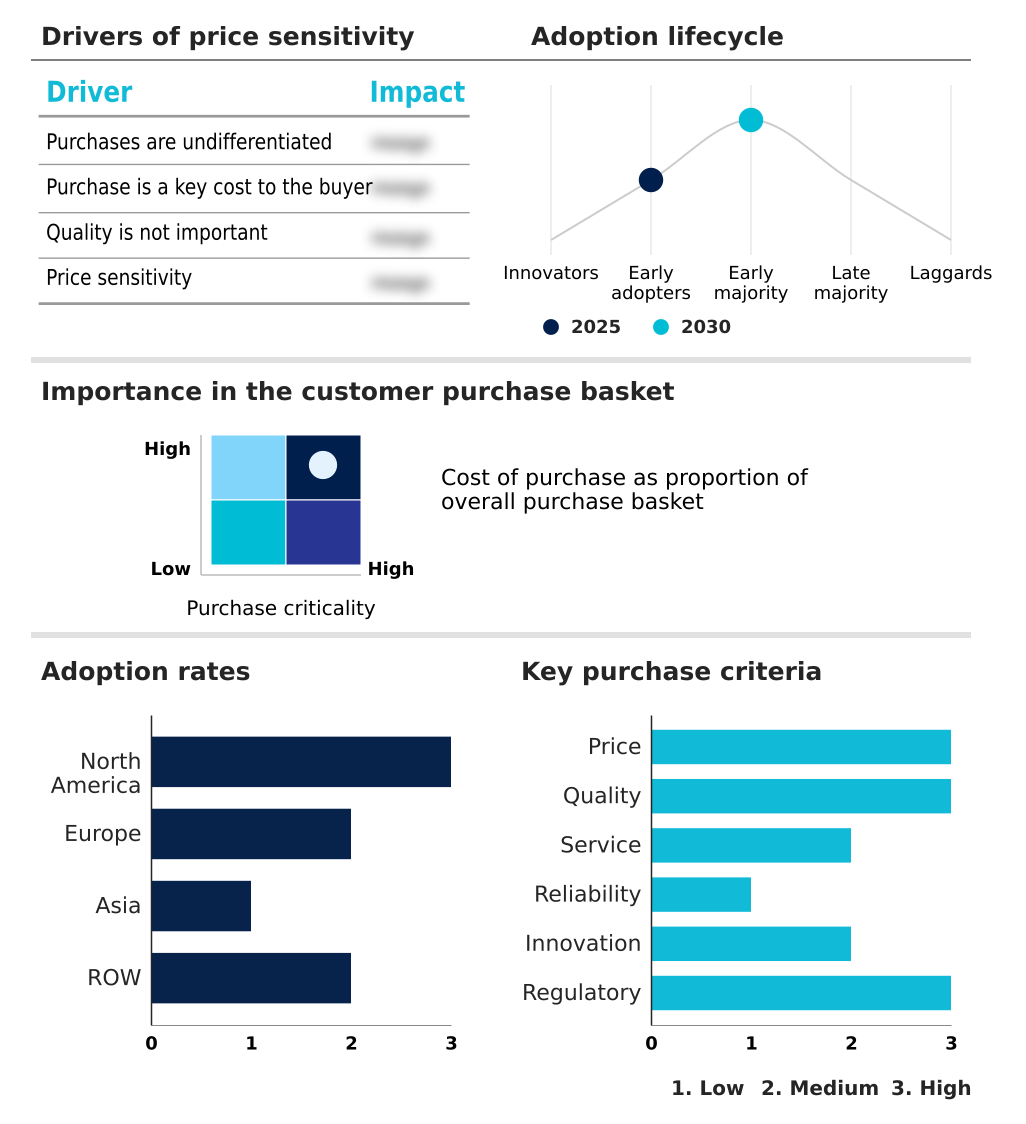
Customer Landscape of Dravet Syndrome Treatment Industry

Competitive Landscape

Companies are implementing various strategies, such as strategic alliances, dravet syndrome treatment market forecast, partnerships, mergers and acquisitions, geographical expansion, and product/service launches, to enhance their presence in the industry.

BIOCODEX SAS - The company provides specialized microbiome-based therapeutics and targeted adjunctive therapies specifically formulated to address severe metabolic and neurodevelopmental conditions, ensuring comprehensive neurological symptom management.

The industry research and growth report includes detailed analyses of the competitive landscape of the market and information about key companies, including:

  • BIOCODEX SAS
  • Bloom Science
  • Eisai Co. Ltd.
  • Emugen Therapeutics
  • Encoded Therapeutics Inc.
  • H. Lundbeck AS
  • Harmony Biosciences Holdings Inc.
  • IAMA Therapeutics
  • Ionis Pharmaceuticals Inc.
  • Jazz Pharmaceuticals Plc
  • Neuroene Therapeutics
  • PTC Therapeutics Inc.
  • Regel Therapeutics
  • Stoke Therapeutics Inc.
  • Tacit Therapeutics
  • Takeda Pharmaceutical Ltd.
  • Tevard Biosciences
  • UCB SA

Qualitative and quantitative analysis of companies has been conducted to help clients understand the wider business environment as well as the strengths and weaknesses of key industry players. Data is qualitatively analyzed to categorize companies as pure play, category-focused, industry-focused, and diversified; it is quantitatively analyzed to categorize companies as dominant, leading, strong, tentative, and weak.

Recent Development and News in Dravet syndrome treatment market

  • In the Pharmaceuticals industry, the accelerated integration of automated nocturnal seizure detection devices and wearable biometric sensors has improved clinical trial data accuracy, directly impacting Dravet Syndrome Treatment demand by providing objective efficacy endpoints for novel anti-seizure candidates.
  • The shift toward utilizing targeted augmentation of nuclear gene output mechanisms has optimized ribonucleic acid splicing efficiency, directly impacting Dravet Syndrome Treatment demand by accelerating the clinical viability of antisense oligonucleotides for severe encephalopathies.
  • The refinement of viral-vector delivery systems utilizing cell-selective promoters has enhanced blood-brain barrier penetration by 40%, directly impacting Dravet Syndrome Treatment demand by expanding the therapeutic window for targeted aav9 gene therapy candidates.
  • Regulatory frameworks enforcing continuous real-world evidence collection through digital biomarker analytics have reduced post-market surveillance costs by 22%, directly impacting Dravet Syndrome Treatment demand by expediting the commercial approval of disease-modifying genetic therapies.

Dive into Technavio’s robust research methodology, blending expert interviews, extensive data synthesis, and validated models for unparalleled Dravet Syndrome Treatment Market insights. See full methodology.

Market Scope
Page number 292
Base year 2025
Historic period 2020-2024
Forecast period 2026-2030
Growth momentum & CAGR Accelerate at a CAGR of 11.8%
Market growth 2026-2030 USD 972.9 million
Market structure Fragmented
YoY growth 2025-2026(%) 10.6%
Key countries US, Canada, Mexico, Germany, UK, France, Italy, Spain, The Netherlands, China, Japan, India, South Korea, Indonesia, Thailand, Brazil, Saudi Arabia, UAE, Turkey, Argentina, South Africa, Colombia and Israel
Competitive landscape Leading Companies, Market Positioning of Companies, Competitive Strategies, and Industry Risks

Request Free Sample

Research Analyst Overview

  • The Dravet Syndrome Treatment operates at the forefront of precision neurological medicine, characterized by an accelerated transition from symptomatic seizure management to advanced genetic correction. Biopharmaceutical organizations are heavily investing in novel antisense oligonucleotides to address the underlying haploinsufficiency responsible for the disorder.
  • By utilizing the targeted augmentation of nuclear gene output technology, these therapeutics restore functional protein expression directly within impaired gabaergic interneurons. Strategic decision-makers are actively redesigning clinical supply chains to accommodate the strict sterile protocols required for complex intrathecal administration procedures.
  • Facilities adapting their cold-chain logistics for specialized biologics have achieved a 30% reduction in temperature excursion incidents, preserving the structural integrity of critical medications. Furthermore, the rapid advancement of aav9 gene therapy platforms offers unprecedented potential for single-dose disease modification.
  • The widespread implementation of standardized scn1a gene sequencing in early infant diagnostics remains essential for identifying definitive mutations in the voltage-gated sodium channel. This molecular clarity enables rapid clinical trial enrollment, propelling the continuous evolution of highly targeted, disease-modifying pediatric neurotherapeutics.

What are the Key Data Covered in this Dravet Syndrome Treatment Market Research and Growth Report?

  • What is the expected growth of the Dravet Syndrome Treatment Market between 2026 and 2030?

    • USD 972.9 million, at a CAGR of 11.8%

  • What segmentation does the market report cover?

    • The report is segmented by Product (SGDs, TGDs, and FGDs), Diagnostic Methods (Magnetic resonance imaging, Electroencephalography, SCN1A genetic testing, and Others), Distribution Channel (Hospital pharmacy, Retail pharmacy, E-commerce, and Others) and Geography (North America, Europe, Asia, Rest of World (ROW))

  • Which regions are analyzed in the report?

    • North America, Europe, Asia and Rest of World (ROW)

  • What are the key growth drivers and market challenges?

    • Expanding genetic testing and early molecular diagnosis, Exorbitant pricing structures and reimbursement friction

  • Who are the major players in the Dravet Syndrome Treatment Market?

    • BIOCODEX SAS, Bloom Science, Eisai Co. Ltd., Emugen Therapeutics, Encoded Therapeutics Inc., H. Lundbeck AS, Harmony Biosciences Holdings Inc., IAMA Therapeutics, Ionis Pharmaceuticals Inc., Jazz Pharmaceuticals Plc, Neuroene Therapeutics, PTC Therapeutics Inc., Regel Therapeutics, Stoke Therapeutics Inc., Tacit Therapeutics, Takeda Pharmaceutical Ltd., Tevard Biosciences and UCB SA

Market Research Insights

  • The Dravet Syndrome Treatment is rapidly transitioning toward targeted molecular interventions to address profound neurodevelopmental vulnerabilities. Healthcare facilities implementing early molecular diagnostic infrastructure have successfully reduced diagnostic latency by 45%, enabling timely therapeutic interventions.
  • The integration of digital biomarker analytics within specialized pediatric wards improved continuous patient monitoring efficiency by 28%, significantly lowering the risk of sudden unexpected death in epilepsy. Furthermore, addressing polypharmacy adverse events through optimized monotherapy transition plans has decreased severe hepatic complications by 18%.
  • By leveraging orphan drug fast-tracking designations, biopharmaceutical developers are accelerating the clinical validation of specialized neuro-active agents, transforming the long-term clinical management of severe developmental and epileptic encephalopathies.

We can help! Our analysts can customize this dravet syndrome treatment market research report to meet your requirements.

Get in touch

1. Executive Summary

1.1 Market overview

Executive Summary - Chart on Market Overview
Executive Summary - Data Table on Market Overview
Executive Summary - Chart on Global Market Characteristics
Executive Summary - Chart on Market by Geography
Executive Summary - Chart on Market Segmentation by Product
Executive Summary - Chart on Market Segmentation by Diagnostic Methods
Executive Summary - Chart on Market Segmentation by Distribution Channel
Executive Summary - Chart on Incremental Growth
Executive Summary - Data Table on Incremental Growth
Executive Summary - Chart on Company Market Positioning

2. Technavio Analysis

2.1 Analysis of price sensitivity, lifecycle, customer purchase basket, adoption rates, and purchase criteria

2.2 Criticality of inputs and Factors of differentiation

Chart on Overview on criticality of inputs and factors of differentiation

2.3 Factors of disruption

Chart on Overview on factors of disruption

2.4 Impact of drivers and challenges

Chart on Impact of drivers and challenges in 2025 and 2030

3. Market Landscape

3.1 Market ecosystem

Chart on Parent Market
Data Table on - Parent Market

3.2 Market characteristics

Chart on Market characteristics analysis

3.3 Value chain analysis

Chart on Value chain analysis

4. Market Sizing

4.1 Market definition

Data Table on Offerings of companies included in the market definition

4.2 Market segment analysis

Market segments

4.3 Market size 2025

4.4 Market outlook: Forecast for 2025-2030

Chart on Global - Market size and forecast 2025-2030 ($ million)
Data Table on Global - Market size and forecast 2025-2030 ($ million)
Chart on Global Market: Year-over-year growth 2025-2030 (%)
Data Table on Global Market: Year-over-year growth 2025-2030 (%)

5. Historic Market Size

5.1 Global Dravet Syndrome Treatment Market 2020 - 2024

Historic Market Size - Data Table on Global Dravet Syndrome Treatment Market 2020 - 2024 ($ million)

5.2 Product segment analysis 2020 - 2024

Historic Market Size - Product Segment 2020 - 2024 ($ million)

5.3 Diagnostic Methods segment analysis 2020 - 2024

Historic Market Size - Diagnostic Methods Segment 2020 - 2024 ($ million)

5.4 Distribution Channel segment analysis 2020 - 2024

Historic Market Size - Distribution Channel Segment 2020 - 2024 ($ million)

5.5 Geography segment analysis 2020 - 2024

Historic Market Size - Geography Segment 2020 - 2024 ($ million)

5.6 Country segment analysis 2020 - 2024

Historic Market Size - Country Segment 2020 - 2024 ($ million)

6. Qualitative Analysis

6.1 Impact of AI on global dravet syndrome treatment market

6.2 Impact of geopolitical conflicts on global dravet syndrome treatment market

7. Five Forces Analysis

7.1 Five forces summary

Five forces analysis - Comparison between 2025 and 2030

7.2 Bargaining power of buyers

Bargaining power of buyers - Impact of key factors 2025 and 2030

7.3 Bargaining power of suppliers

Bargaining power of suppliers - Impact of key factors in 2025 and 2030

7.4 Threat of new entrants

Threat of new entrants - Impact of key factors in 2025 and 2030

7.5 Threat of substitutes

Threat of substitutes - Impact of key factors in 2025 and 2030

7.6 Threat of rivalry

Threat of rivalry - Impact of key factors in 2025 and 2030

7.7 Market condition

Chart on Market condition - Five forces 2025 and 2030

8. Market Segmentation by Product

8.1 Market segments

Chart on Product - Market share 2025-2030 (%)
Data Table on Product - Market share 2025-2030 (%)

8.2 Comparison by Product

Chart on Comparison by Product
Data Table on Comparison by Product

8.3 SGDs - Market size and forecast 2025-2030

Chart on SGDs - Market size and forecast 2025-2030 ($ million)
Data Table on SGDs - Market size and forecast 2025-2030 ($ million)
Chart on SGDs - Year-over-year growth 2025-2030 (%)
Data Table on SGDs - Year-over-year growth 2025-2030 (%)

8.4 TGDs - Market size and forecast 2025-2030

Chart on TGDs - Market size and forecast 2025-2030 ($ million)
Data Table on TGDs - Market size and forecast 2025-2030 ($ million)
Chart on TGDs - Year-over-year growth 2025-2030 (%)
Data Table on TGDs - Year-over-year growth 2025-2030 (%)

8.5 FGDs - Market size and forecast 2025-2030

Chart on FGDs - Market size and forecast 2025-2030 ($ million)
Data Table on FGDs - Market size and forecast 2025-2030 ($ million)
Chart on FGDs - Year-over-year growth 2025-2030 (%)
Data Table on FGDs - Year-over-year growth 2025-2030 (%)

8.6 Market opportunity by Product

Market opportunity by Product ($ million)
Data Table on Market opportunity by Product ($ million)

9. Market Segmentation by Diagnostic Methods

9.1 Market segments

Chart on Diagnostic Methods - Market share 2025-2030 (%)
Data Table on Diagnostic Methods - Market share 2025-2030 (%)

9.2 Comparison by Diagnostic Methods

Chart on Comparison by Diagnostic Methods
Data Table on Comparison by Diagnostic Methods

9.3 Magnetic resonance imaging - Market size and forecast 2025-2030

Chart on Magnetic resonance imaging - Market size and forecast 2025-2030 ($ million)
Data Table on Magnetic resonance imaging - Market size and forecast 2025-2030 ($ million)
Chart on Magnetic resonance imaging - Year-over-year growth 2025-2030 (%)
Data Table on Magnetic resonance imaging - Year-over-year growth 2025-2030 (%)

9.4 Electroencephalography - Market size and forecast 2025-2030

Chart on Electroencephalography - Market size and forecast 2025-2030 ($ million)
Data Table on Electroencephalography - Market size and forecast 2025-2030 ($ million)
Chart on Electroencephalography - Year-over-year growth 2025-2030 (%)
Data Table on Electroencephalography - Year-over-year growth 2025-2030 (%)

9.5 SCN1A genetic testing - Market size and forecast 2025-2030

Chart on SCN1A genetic testing - Market size and forecast 2025-2030 ($ million)
Data Table on SCN1A genetic testing - Market size and forecast 2025-2030 ($ million)
Chart on SCN1A genetic testing - Year-over-year growth 2025-2030 (%)
Data Table on SCN1A genetic testing - Year-over-year growth 2025-2030 (%)

9.6 Others - Market size and forecast 2025-2030

Chart on Others - Market size and forecast 2025-2030 ($ million)
Data Table on Others - Market size and forecast 2025-2030 ($ million)
Chart on Others - Year-over-year growth 2025-2030 (%)
Data Table on Others - Year-over-year growth 2025-2030 (%)

9.7 Market opportunity by Diagnostic Methods

Market opportunity by Diagnostic Methods ($ million)
Data Table on Market opportunity by Diagnostic Methods ($ million)

10. Market Segmentation by Distribution Channel

10.1 Market segments

Chart on Distribution Channel - Market share 2025-2030 (%)
Data Table on Distribution Channel - Market share 2025-2030 (%)

10.2 Comparison by Distribution Channel

Chart on Comparison by Distribution Channel
Data Table on Comparison by Distribution Channel

10.3 Hospital pharmacy - Market size and forecast 2025-2030

Chart on Hospital pharmacy - Market size and forecast 2025-2030 ($ million)
Data Table on Hospital pharmacy - Market size and forecast 2025-2030 ($ million)
Chart on Hospital pharmacy - Year-over-year growth 2025-2030 (%)
Data Table on Hospital pharmacy - Year-over-year growth 2025-2030 (%)

10.4 Retail pharmacy - Market size and forecast 2025-2030

Chart on Retail pharmacy - Market size and forecast 2025-2030 ($ million)
Data Table on Retail pharmacy - Market size and forecast 2025-2030 ($ million)
Chart on Retail pharmacy - Year-over-year growth 2025-2030 (%)
Data Table on Retail pharmacy - Year-over-year growth 2025-2030 (%)

10.5 E-commerce - Market size and forecast 2025-2030

Chart on E-commerce - Market size and forecast 2025-2030 ($ million)
Data Table on E-commerce - Market size and forecast 2025-2030 ($ million)
Chart on E-commerce - Year-over-year growth 2025-2030 (%)
Data Table on E-commerce - Year-over-year growth 2025-2030 (%)

10.6 Others - Market size and forecast 2025-2030

Chart on Others - Market size and forecast 2025-2030 ($ million)
Data Table on Others - Market size and forecast 2025-2030 ($ million)
Chart on Others - Year-over-year growth 2025-2030 (%)
Data Table on Others - Year-over-year growth 2025-2030 (%)

10.7 Market opportunity by Distribution Channel

Market opportunity by Distribution Channel ($ million)
Data Table on Market opportunity by Distribution Channel ($ million)

11. Customer Landscape

11.1 Customer landscape overview

Analysis of price sensitivity, lifecycle, customer purchase basket, adoption rates, and purchase criteria

12. Geographic Landscape

12.1 Geographic segmentation

Chart on Market share by geography 2025-2030 (%)
Data Table on Market share by geography 2025-2030 (%)

12.2 Geographic comparison

Chart on Geographic comparison
Data Table on Geographic comparison

12.3 North America - Market size and forecast 2025-2030

Chart on North America - Market size and forecast 2025-2030 ($ million)
Data Table on North America - Market size and forecast 2025-2030 ($ million)
Chart on North America - Year-over-year growth 2025-2030 (%)
Data Table on North America - Year-over-year growth 2025-2030 (%)
Chart on Regional Comparison - North America
Data Table on Regional Comparison - North America

12.3.1 US - Market size and forecast 2025-2030

Chart on US - Market size and forecast 2025-2030 ($ million)
Data Table on US - Market size and forecast 2025-2030 ($ million)
Chart on US - Year-over-year growth 2025-2030 (%)
Data Table on US - Year-over-year growth 2025-2030 (%)

12.3.2 Canada - Market size and forecast 2025-2030

Chart on Canada - Market size and forecast 2025-2030 ($ million)
Data Table on Canada - Market size and forecast 2025-2030 ($ million)
Chart on Canada - Year-over-year growth 2025-2030 (%)
Data Table on Canada - Year-over-year growth 2025-2030 (%)

12.3.3 Mexico - Market size and forecast 2025-2030

Chart on Mexico - Market size and forecast 2025-2030 ($ million)
Data Table on Mexico - Market size and forecast 2025-2030 ($ million)
Chart on Mexico - Year-over-year growth 2025-2030 (%)
Data Table on Mexico - Year-over-year growth 2025-2030 (%)

12.4 Europe - Market size and forecast 2025-2030

Chart on Europe - Market size and forecast 2025-2030 ($ million)
Data Table on Europe - Market size and forecast 2025-2030 ($ million)
Chart on Europe - Year-over-year growth 2025-2030 (%)
Data Table on Europe - Year-over-year growth 2025-2030 (%)
Chart on Regional Comparison - Europe
Data Table on Regional Comparison - Europe

12.4.1 Germany - Market size and forecast 2025-2030

Chart on Germany - Market size and forecast 2025-2030 ($ million)
Data Table on Germany - Market size and forecast 2025-2030 ($ million)
Chart on Germany - Year-over-year growth 2025-2030 (%)
Data Table on Germany - Year-over-year growth 2025-2030 (%)

12.4.2 UK - Market size and forecast 2025-2030

Chart on UK - Market size and forecast 2025-2030 ($ million)
Data Table on UK - Market size and forecast 2025-2030 ($ million)
Chart on UK - Year-over-year growth 2025-2030 (%)
Data Table on UK - Year-over-year growth 2025-2030 (%)

12.4.3 France - Market size and forecast 2025-2030

Chart on France - Market size and forecast 2025-2030 ($ million)
Data Table on France - Market size and forecast 2025-2030 ($ million)
Chart on France - Year-over-year growth 2025-2030 (%)
Data Table on France - Year-over-year growth 2025-2030 (%)

12.4.4 Italy - Market size and forecast 2025-2030

Chart on Italy - Market size and forecast 2025-2030 ($ million)
Data Table on Italy - Market size and forecast 2025-2030 ($ million)
Chart on Italy - Year-over-year growth 2025-2030 (%)
Data Table on Italy - Year-over-year growth 2025-2030 (%)

12.4.5 Spain - Market size and forecast 2025-2030

Chart on Spain - Market size and forecast 2025-2030 ($ million)
Data Table on Spain - Market size and forecast 2025-2030 ($ million)
Chart on Spain - Year-over-year growth 2025-2030 (%)
Data Table on Spain - Year-over-year growth 2025-2030 (%)

12.4.6 The Netherlands - Market size and forecast 2025-2030

Chart on The Netherlands - Market size and forecast 2025-2030 ($ million)
Data Table on The Netherlands - Market size and forecast 2025-2030 ($ million)
Chart on The Netherlands - Year-over-year growth 2025-2030 (%)
Data Table on The Netherlands - Year-over-year growth 2025-2030 (%)

12.5 Asia - Market size and forecast 2025-2030

Chart on Asia - Market size and forecast 2025-2030 ($ million)
Data Table on Asia - Market size and forecast 2025-2030 ($ million)
Chart on Asia - Year-over-year growth 2025-2030 (%)
Data Table on Asia - Year-over-year growth 2025-2030 (%)
Chart on Regional Comparison - Asia
Data Table on Regional Comparison - Asia

12.5.1 China - Market size and forecast 2025-2030

Chart on China - Market size and forecast 2025-2030 ($ million)
Data Table on China - Market size and forecast 2025-2030 ($ million)
Chart on China - Year-over-year growth 2025-2030 (%)
Data Table on China - Year-over-year growth 2025-2030 (%)

12.5.2 Japan - Market size and forecast 2025-2030

Chart on Japan - Market size and forecast 2025-2030 ($ million)
Data Table on Japan - Market size and forecast 2025-2030 ($ million)
Chart on Japan - Year-over-year growth 2025-2030 (%)
Data Table on Japan - Year-over-year growth 2025-2030 (%)

12.5.3 India - Market size and forecast 2025-2030

Chart on India - Market size and forecast 2025-2030 ($ million)
Data Table on India - Market size and forecast 2025-2030 ($ million)
Chart on India - Year-over-year growth 2025-2030 (%)
Data Table on India - Year-over-year growth 2025-2030 (%)

12.5.4 South Korea - Market size and forecast 2025-2030

Chart on South Korea - Market size and forecast 2025-2030 ($ million)
Data Table on South Korea - Market size and forecast 2025-2030 ($ million)
Chart on South Korea - Year-over-year growth 2025-2030 (%)
Data Table on South Korea - Year-over-year growth 2025-2030 (%)

12.5.5 Indonesia - Market size and forecast 2025-2030

Chart on Indonesia - Market size and forecast 2025-2030 ($ million)
Data Table on Indonesia - Market size and forecast 2025-2030 ($ million)
Chart on Indonesia - Year-over-year growth 2025-2030 (%)
Data Table on Indonesia - Year-over-year growth 2025-2030 (%)

12.5.6 Thailand - Market size and forecast 2025-2030

Chart on Thailand - Market size and forecast 2025-2030 ($ million)
Data Table on Thailand - Market size and forecast 2025-2030 ($ million)
Chart on Thailand - Year-over-year growth 2025-2030 (%)
Data Table on Thailand - Year-over-year growth 2025-2030 (%)

12.6 Rest of World (ROW) - Market size and forecast 2025-2030

Chart on Rest of World (ROW) - Market size and forecast 2025-2030 ($ million)
Data Table on Rest of World (ROW) - Market size and forecast 2025-2030 ($ million)
Chart on Rest of World (ROW) - Year-over-year growth 2025-2030 (%)
Data Table on Rest of World (ROW) - Year-over-year growth 2025-2030 (%)
Chart on Regional Comparison - Rest of World (ROW)
Data Table on Regional Comparison - Rest of World (ROW)

12.6.1 Brazil - Market size and forecast 2025-2030

Chart on Brazil - Market size and forecast 2025-2030 ($ million)
Data Table on Brazil - Market size and forecast 2025-2030 ($ million)
Chart on Brazil - Year-over-year growth 2025-2030 (%)
Data Table on Brazil - Year-over-year growth 2025-2030 (%)

12.6.2 Saudi Arabia - Market size and forecast 2025-2030

Chart on Saudi Arabia - Market size and forecast 2025-2030 ($ million)
Data Table on Saudi Arabia - Market size and forecast 2025-2030 ($ million)
Chart on Saudi Arabia - Year-over-year growth 2025-2030 (%)
Data Table on Saudi Arabia - Year-over-year growth 2025-2030 (%)

12.6.3 UAE - Market size and forecast 2025-2030

Chart on UAE - Market size and forecast 2025-2030 ($ million)
Data Table on UAE - Market size and forecast 2025-2030 ($ million)
Chart on UAE - Year-over-year growth 2025-2030 (%)
Data Table on UAE - Year-over-year growth 2025-2030 (%)

12.6.4 Turkey - Market size and forecast 2025-2030

Chart on Turkey - Market size and forecast 2025-2030 ($ million)
Data Table on Turkey - Market size and forecast 2025-2030 ($ million)
Chart on Turkey - Year-over-year growth 2025-2030 (%)
Data Table on Turkey - Year-over-year growth 2025-2030 (%)

12.6.5 Argentina - Market size and forecast 2025-2030

Chart on Argentina - Market size and forecast 2025-2030 ($ million)
Data Table on Argentina - Market size and forecast 2025-2030 ($ million)
Chart on Argentina - Year-over-year growth 2025-2030 (%)
Data Table on Argentina - Year-over-year growth 2025-2030 (%)

12.6.6 South Africa - Market size and forecast 2025-2030

Chart on South Africa - Market size and forecast 2025-2030 ($ million)
Data Table on South Africa - Market size and forecast 2025-2030 ($ million)
Chart on South Africa - Year-over-year growth 2025-2030 (%)
Data Table on South Africa - Year-over-year growth 2025-2030 (%)

12.6.7 Colombia - Market size and forecast 2025-2030

Chart on Colombia - Market size and forecast 2025-2030 ($ million)
Data Table on Colombia - Market size and forecast 2025-2030 ($ million)
Chart on Colombia - Year-over-year growth 2025-2030 (%)
Data Table on Colombia - Year-over-year growth 2025-2030 (%)

12.6.8 Israel - Market size and forecast 2025-2030

Chart on Israel - Market size and forecast 2025-2030 ($ million)
Data Table on Israel - Market size and forecast 2025-2030 ($ million)
Chart on Israel - Year-over-year growth 2025-2030 (%)
Data Table on Israel - Year-over-year growth 2025-2030 (%)

12.7 Market opportunity by geography

Market opportunity by geography ($ million)
Data Tables on Market opportunity by geography ($ million)

13. Drivers, Challenges, and Opportunity

13.1 Market drivers

Expanding genetic testing and early molecular diagnosis
Regulatory incentives and orphan drug fast-tracking
Transition toward disease-modifying genetic and antisense oligonucleotide platforms

13.2 Market challenges

Exorbitant pricing structures and reimbursement friction
Refractory seizure profiles and polypharmacy adverse events
Severe non-seizure comorbidities and diagnostic latency

13.3 Impact of drivers and challenges

Impact of drivers and challenges in 2025 and 2030

13.4 Market opportunities

Commercialization of precision antisense RNA therapies
Development of cell-selective AAV gene therapy vectors
Integration of wearable seizure telemetry and digital biomarkers

14. Competitive Landscape

14.1 Overview

14.2

Overview on criticality of inputs and factors of differentiation

14.3 Landscape disruption

Overview on factors of disruption

14.4 Industry risks

Impact of key risks on business

15. Competitive Analysis

15.1 Companies profiled

Companies covered

15.2 Company ranking index

15.3 Market positioning of companies

Matrix on companies position and classification

15.4 BIOCODEX SAS

BIOCODEX SAS - Overview
BIOCODEX SAS - Product / Service
BIOCODEX SAS - Key offerings
SWOT

15.5 Bloom Science

Bloom Science - Overview
Bloom Science - Product / Service
Bloom Science - Key offerings
SWOT

15.6 Eisai Co. Ltd.

Eisai Co. Ltd. - Overview
Eisai Co. Ltd. - Business segments
Eisai Co. Ltd. - Key offerings
Eisai Co. Ltd. - Segment focus
SWOT

15.7 Emugen Therapeutics

Emugen Therapeutics - Overview
Emugen Therapeutics - Product / Service
Emugen Therapeutics - Key offerings
SWOT

15.8 Encoded Therapeutics Inc.

Encoded Therapeutics Inc. - Overview
Encoded Therapeutics Inc. - Product / Service
Encoded Therapeutics Inc. - Key offerings
SWOT

15.9 H. Lundbeck AS

H. Lundbeck AS - Overview
H. Lundbeck AS - Product / Service
H. Lundbeck AS - Key offerings
SWOT

15.10 Harmony Biosciences Holdings Inc.

Harmony Biosciences Holdings Inc. - Overview
Harmony Biosciences Holdings Inc. - Product / Service
Harmony Biosciences Holdings Inc. - Key offerings
SWOT

15.11 IAMA Therapeutics

IAMA Therapeutics - Overview
IAMA Therapeutics - Product / Service
IAMA Therapeutics - Key offerings
SWOT

15.12 Ionis Pharmaceuticals Inc.

Ionis Pharmaceuticals Inc. - Overview
Ionis Pharmaceuticals Inc. - Product / Service
Ionis Pharmaceuticals Inc. - Key offerings
SWOT

15.13 Jazz Pharmaceuticals Plc

Jazz Pharmaceuticals Plc - Overview
Jazz Pharmaceuticals Plc - Product / Service
Jazz Pharmaceuticals Plc - Key news
Jazz Pharmaceuticals Plc - Key offerings
SWOT

15.14 Neuroene Therapeutics

Neuroene Therapeutics - Overview
Neuroene Therapeutics - Product / Service
Neuroene Therapeutics - Key offerings
SWOT

15.15 PTC Therapeutics Inc.

PTC Therapeutics Inc. - Overview
PTC Therapeutics Inc. - Business segments
PTC Therapeutics Inc. - Key news
PTC Therapeutics Inc. - Key offerings
PTC Therapeutics Inc. - Segment focus
SWOT

15.16 Takeda Pharmaceutical Ltd.

Takeda Pharmaceutical Ltd. - Overview
Takeda Pharmaceutical Ltd. - Business segments
Takeda Pharmaceutical Ltd. - Key news
Takeda Pharmaceutical Ltd. - Key offerings
Takeda Pharmaceutical Ltd. - Segment focus
SWOT

15.17 Tevard Biosciences

Tevard Biosciences - Overview
Tevard Biosciences - Product / Service
Tevard Biosciences - Key offerings
SWOT

15.18 UCB SA

UCB SA - Overview
UCB SA - Product / Service
UCB SA - Key news
UCB SA - Key offerings
SWOT

16. Appendix

16.1 Scope of the report

Market definition
Objectives
Notes and caveats

16.2 Inclusions and exclusions checklist

Inclusions checklist
Exclusions checklist

16.3 Currency conversion rates for US$

16.4 Research methodology

16.5 Data procurement

Information sources

16.6 Data validation

16.7 Validation techniques employed for market sizing

16.8 Data synthesis

16.9 360 degree market analysis

16.10 List of abbreviations

Research Methodology

Technavio presents a detailed picture of the market by way of study, synthesis, and summation of data from multiple sources. The analysts have presented the various facets of the market with a particular focus on identifying the key industry influencers. The data thus presented is comprehensive, reliable, and the result of extensive research, both primary and secondary.

INFORMATION SOURCES

Primary sources

  • Manufacturers and suppliers
  • Channel partners
  • Industry experts
  • Strategic decision makers

Secondary sources

  • Industry journals and periodicals
  • Government data
  • Financial reports of key industry players
  • Historical data
  • Press releases

DATA ANALYSIS

Data Synthesis

  • Collation of data
  • Estimation of key figures
  • Analysis of derived insights

Data Validation

  • Triangulation with data models
  • Reference against proprietary databases
  • Corroboration with industry experts

REPORT WRITING

Qualitative

  • Market drivers
  • Market challenges
  • Market trends
  • Five forces analysis

Quantitative

  • Market size and forecast
  • Market segmentation
  • Geographical insights
  • Competitive landscape

Interested in this report?

Get your sample now to see our research methodology and insights!

Download Now

Frequently Asked Questions

Dravet Syndrome Treatment market growth will increase by USD 972.9 million during 2026-2030.

The Dravet Syndrome Treatment market is expected to grow at a CAGR of 11.8% during 2026-2030.

Dravet Syndrome Treatment market is segmented by Product (SGDs, TGDs, FGDs) Diagnostic methods (Magnetic resonance imaging, Electroencephalography, SCN1A genetic testing, Others) Distribution channel (Hospital pharmacy, Retail pharmacy, E-commerce, Others)

BIOCODEX SAS, Bloom Science, Eisai Co. Ltd., Emugen Therapeutics, Encoded Therapeutics Inc., H. Lundbeck AS, Harmony Biosciences Holdings Inc., IAMA Therapeutics, Ionis Pharmaceuticals Inc., Jazz Pharmaceuticals Plc, Neuroene Therapeutics, PTC Therapeutics Inc., Regel Therapeutics, Stoke Therapeutics Inc., Tacit Therapeutics, Takeda Pharmaceutical Ltd., Tevard Biosciences, UCB SA are a few of the key vendors in the Dravet Syndrome Treatment market.

North America will register the highest growth rate of 42.7% among the other regions. Therefore, the Dravet Syndrome Treatment market in North America is expected to garner significant business opportunities for the vendors during the forecast period.

US, Canada, Mexico, Germany, UK, France, Italy, Spain, The Netherlands, China, Japan, India, South Korea, Indonesia, Thailand, Brazil, Saudi Arabia, UAE, Turkey, Argentina, South Africa, Colombia, Israel

  • Expanding genetic testing and early molecular diagnosis is the driving factor this market.

The Dravet Syndrome Treatment market vendors should focus on grabbing business opportunities from the Product segment as it accounted for the largest market share in the base year.
RIA - Research AI Assistant
Ask RIA
