Digital Textile Printing Market Analysis, Size, and Forecast 2026-2030: Europe (Germany, UK, and France), APAC (China, Japan, and India), North America (US, Canada, and Mexico), South America (Brazil and Argentina), Middle East and Africa (Saudi Arabia, UAE, and South Africa), and Rest of World (ROW)

Digital Textile Printing Market Analysis, Size, and Forecast 2026-2030:
Europe (Germany, UK, and France), APAC (China, Japan, and India), North America (US, Canada, and Mexico), South America (Brazil and Argentina), Middle East and Africa (Saudi Arabia, UAE, and South Africa), and Rest of World (ROW)

Published: Apr 2026 304 Pages SKU: IRTNTR45737

Market Overview at a Glance

$4.80 B
Market Opportunity
16.6%
CAGR 2025 - 2030
39.8%
Europe Growth
$1.94 B
Disperse ink segment 2024

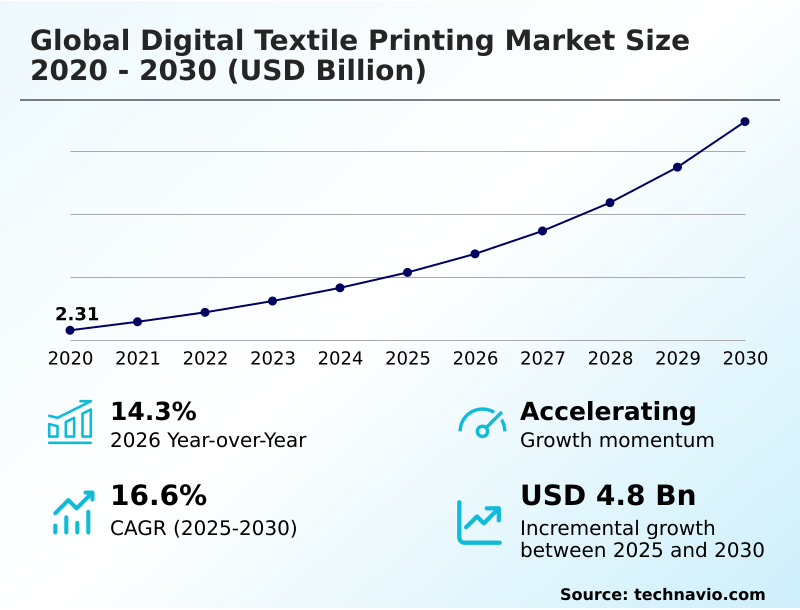
Digital Textile Printing Market Size 2026-2030

The digital textile printing market size is valued to increase by USD 4.80 billion, at a CAGR of 16.6% from 2025 to 2030. Increasing number of trade shows and exhibitions will drive the digital textile printing market.

Major Market Trends & Insights

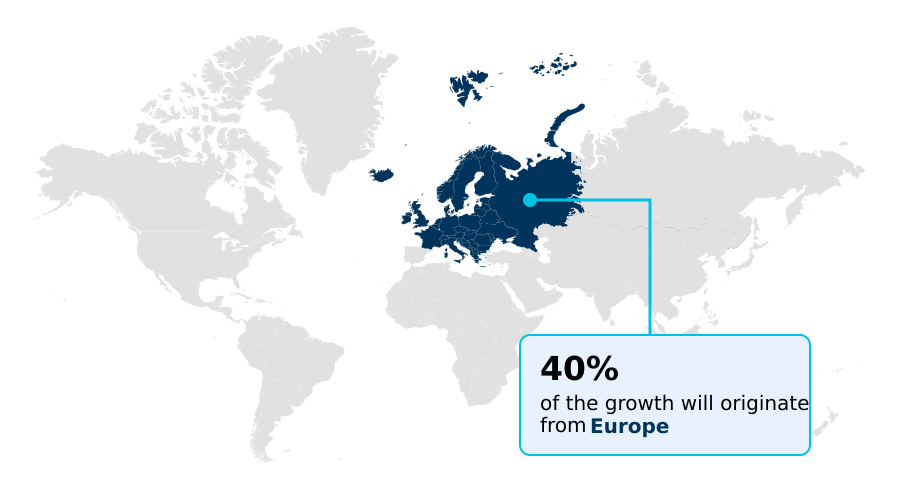
  • Europe dominated the market and accounted for a 39.8% growth during the forecast period.
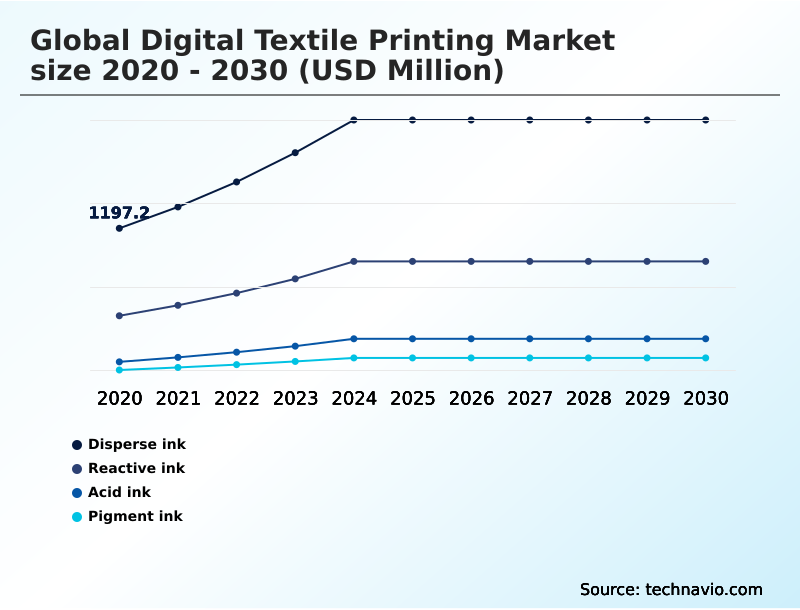
  • By Type - Disperse ink segment was valued at USD 1.94 billion in 2024
  • By Application - Clothing segment accounted for the largest market revenue share in 2024

Market Size & Forecast

  • Market Opportunities: USD 6.64 billion
  • Market Future Opportunities: USD 4.80 billion
  • CAGR from 2025 to 2030 : 16.6%

Market Summary

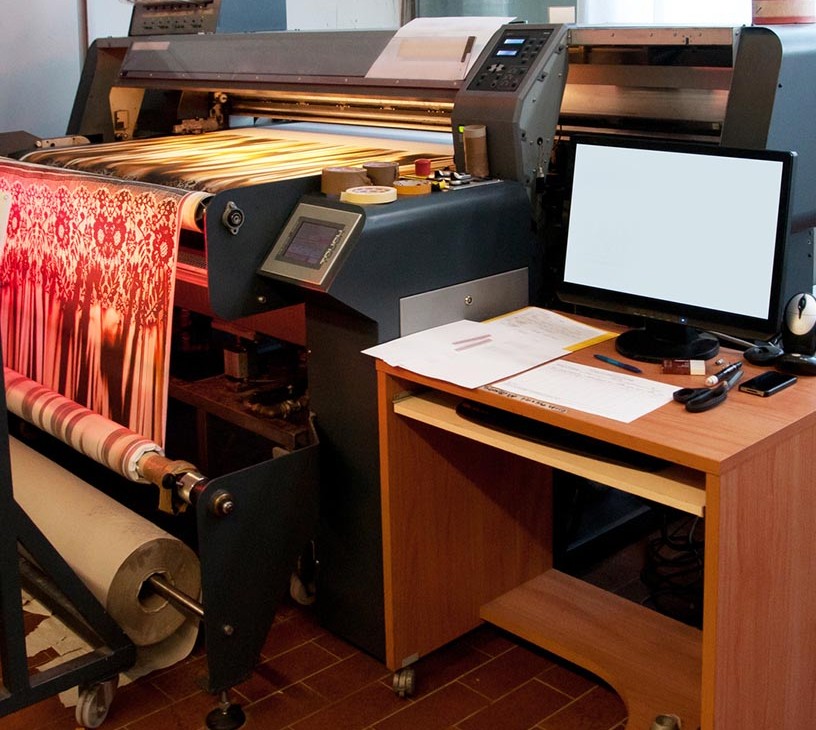
  • The digital textile printing market is defined by its capacity to merge high-speed production with mass customization, fundamentally reshaping the apparel, home decor, and advertising sectors. A key driver is the adoption of the roll-to-roll process, which enables industrial inkjet systems to achieve efficiency levels comparable to traditional methods while offering superior design flexibility.
  • This shift supports the rise of on-demand manufacturing, allowing businesses to minimize inventory and respond rapidly to consumer preferences. For instance, a fashion retailer can leverage a digital textile micro-factory to move a design from concept to a saleable garment in days rather than months, a critical advantage in fast-paced markets.
  • Market trends include the growing range of ink offerings, such as advanced pigment ink binders and water-based organic pigments, which enhance substrate compatibility and support sustainability mandates like GOTS compliance. Innovations in direct-to-garment printing and automated pre-treatment are lowering entry barriers.
  • However, the industry faces challenges from printing-related issues like color inconsistency and the high maintenance of industrial print heads, which can deter adoption among manufacturers accustomed to conventional, less technically demanding workflows.

What will be the Size of the Digital Textile Printing Market during the forecast period?

Get Key Insights on Market Forecast (PDF) Request Free Sample

How is the Digital Textile Printing Market Segmented?

The digital textile printing industry research report provides comprehensive data (region-wise segment analysis), with forecasts and estimates in "USD million" for the period 2026-2030, as well as historical data from 2020-2024 for the following segments.

  • Type
    • Disperse ink
    • Reactive ink
    • Acid ink
    • Pigment ink
  • Application
    • Clothing
    • Soft signage
    • Home textiles
    • Textiles
    • Others
  • Material
    • Polyester
    • Cotton
    • Others
  • Geography
    • Europe
      • Germany
      • UK
      • France
    • APAC
      • China
      • Japan
      • India
    • North America
      • US
      • Canada
      • Mexico
    • South America
      • Brazil
      • Argentina
    • Middle East and Africa
      • Saudi Arabia
      • UAE
      • South Africa
    • Rest of World (ROW)

By Type Insights

The disperse ink segment is estimated to witness significant growth during the forecast period.

The market is segmented by type, application, and geography. In the type segment, disperse ink is dominant due to its compatibility with synthetic fibers like polyester, achieved through dye-sublimation technology.

This process creates high-definition textile graphics with excellent vibrant color reproduction, essential for sports apparel printing and soft signage production.

Innovations in disperse ink formulations are critical, with advanced systems reducing maintenance cycles for nozzle clogging prevention by up to 20%.

Rigorous substrate compatibility testing ensures a high light-fastness rating, making these inks suitable for durable outdoor signage and industrial fabric printing.

The method also supports sustainability goals via reduced water consumption, improving textile prototyping speed for fast fashion enablement and on-demand fabric decoration.

Request Free Sample

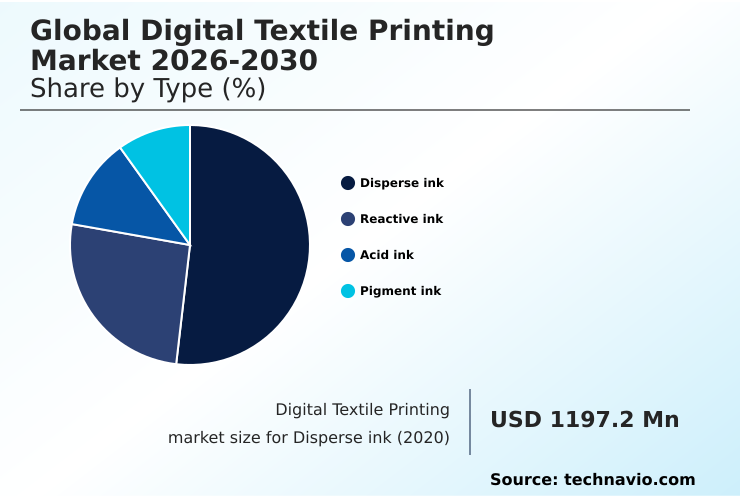
The Disperse ink segment was valued at USD 1.94 billion in 2024 and showed a gradual increase during the forecast period.

Request Free Sample

Regional Analysis

Europe is estimated to contribute 39.8% to the growth of the global market during the forecast period.Technavio’s analysts have elaborately explained the regional trends and drivers that shape the market during the forecast period.

See How Digital Textile Printing Market Demand is Rising in Europe Request Free Sample

The geographic landscape is characterized by distinct regional specializations and growth drivers. Europe leads in the adoption of high-end technologies for luxury fashion and home decor, focusing on OEKO-TEX certification and GOTS compliance.

Facilities in this region have reported a 15% increase in production efficiency by integrating advanced color management with automated finishing tools.

APAC remains the manufacturing powerhouse, where the transition to digital methods is driven by the need for both high-volume output and agile, short-run textile production for global brands.

North America is a major hub for print-on-demand manufacturing and soft signage production, leveraging digital workflows to reduce operational costs.

The adoption of localized textile manufacturing in this region has cut supply chain lead times by up to 50% for certain apparel lines. These regional dynamics reflect a global shift towards more efficient, sustainable, and customized textile decoration.
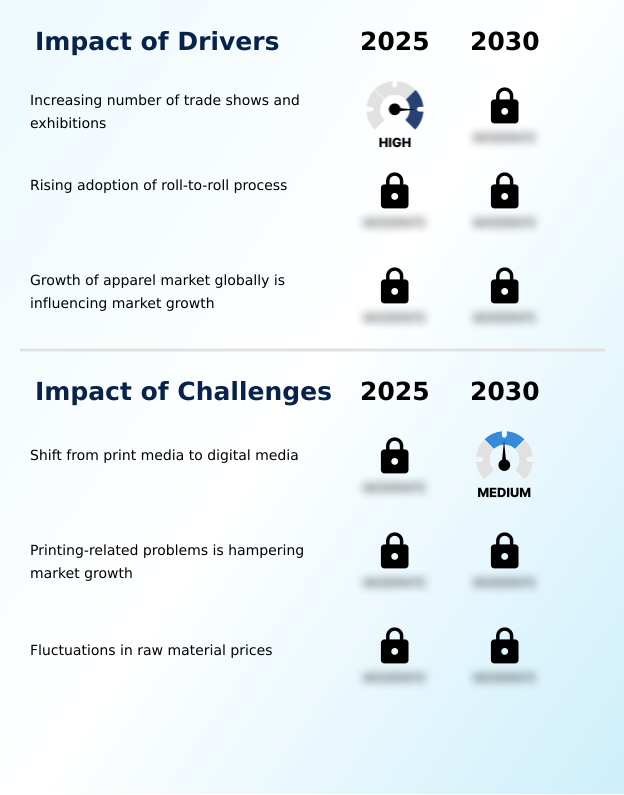
Market Dynamics

Our researchers analyzed the data with 2025 as the base year, along with the key drivers, trends, and challenges. A holistic analysis of drivers will help companies refine their marketing strategies to gain a competitive advantage.

  • The digital textile printing market is evolving toward highly specialized applications, where specific ink-and-fabric pairings are critical for performance and quality. For example, the use of disperse ink for polyester sportswear is standard for achieving vibrant, durable prints, while reactive ink for cotton apparel remains the top choice for its soft-hand feel and excellent wash-fastness.
  • Similarly, acid ink for silk and nylon is essential in the luxury and swimwear segments. The growing demand for sustainable options is pushing pigment ink for home textiles to the forefront due to its simplified, waterless curing process.
  • As industries adopt more advanced solutions, the benefits of automated pre-treatment systems are becoming clear, streamlining workflows for both roll-to-roll process for high-volume jobs and DTG printing for custom T-shirts. The choice between wash-fastness of pigment vs reactive inks is a key consideration for manufacturers balancing durability with production complexity.
  • In niche markets, dye-sublimation for soft signage offers unmatched portability and image quality, while the use of UV-cured ink for industrial textiles provides superior resistance to abrasion and environmental factors. Furthermore, adherence to standards like OEKO-TEX certified ink for baby clothes and GOTS compliant digital printing is non-negotiable for brands targeting eco-conscious consumers.
  • Innovations in binder chemistry for universal fabric printing and nano-dispersion for vibrant pigment colors are addressing long-standing challenges like substrate compatibility on recycled fabrics and preventing nozzle clogging in industrial printers. Effective color management for brand consistency across all these applications remains a cornerstone of successful digital textile production.

What are the key market drivers leading to the rise in the adoption of Digital Textile Printing Industry?

  • The growing frequency of trade shows and exhibitions serves as a key driver for the global digital textile printing market, fueling demand for portable and high-impact soft signage solutions.

  • Market growth is fueled by the widespread adoption of digital workflows that enhance production efficiency and enable new business models.
  • The increasing use of the roll-to-roll process in high-speed textile printers has allowed manufacturers to improve output by up to 30% while maintaining quality. This efficiency is critical for meeting the demands of on-demand fabric decoration and short-run textile production.
  • The rise of print-on-demand manufacturing, supported by direct-to-garment printing and automated finishing tools, has democratized the fashion industry, empowering personalized fashion production.
  • These technologies facilitate textile waste reduction and lower energy usage, aligning with the growing demand for sustainable ink solutions. This shift toward digital methods is a core component of textile supply chain digitalization, enabling faster and more responsive operations.

What are the market trends shaping the Digital Textile Printing Industry?

  • The increasing significance of UV-cured inks represents a defining market trend, driven by the demand for faster production cycles and enhanced durability on diverse textile substrates.

  • Key trends are reshaping the market, driven by innovations in ink chemistry and hardware. The rising importance of water-based organic pigments aligns with sustainability goals, with some manufacturers achieving GOTS compliance and reducing volatile organic compound emissions by over 60%. The development of fluorescent and metallic ink effects is expanding creative possibilities in custom apparel manufacturing and luxury fabric printing.
  • This trend allows for intricate pattern printing and is supported by advanced color management systems that ensure consistency. The adoption of hybrid ink development enables printing on a wider range of materials, enhancing substrate compatibility testing protocols. This versatility allows businesses to enter new segments, from functional fabric coating to fine-art textile reproduction.
  • The focus on smart textile integration is opening pathways for high-value applications that merge electronics and textiles.

What challenges does the Digital Textile Printing Industry face during its growth?

  • The ongoing shift in advertising budgets from print to digital media presents a significant challenge to market growth, particularly impacting the traditional textile-based signage segment.

  • The market faces persistent technical and operational challenges that can impede widespread adoption. Issues such as nozzle clogging prevention and color inconsistency across batches require sophisticated technical expertise and can lead to significant downtime, with some operators reporting production losses of up to 15% during unresolved print-head failures.
  • Achieving high wash-fastness standards and a desirable soft-hand feel enhancement, particularly with newer pigment ink binders, remains a hurdle for certain applications. Substrate compatibility testing is complex, especially with the growing use of recycled and blended fabrics. Furthermore, the volatility of raw material prices for specialized inks creates economic uncertainty, making it difficult for businesses to manage costs.
  • These challenges necessitate ongoing innovation in areas like nano-dispersion technology and binder chemistry innovation to improve reliability and performance.

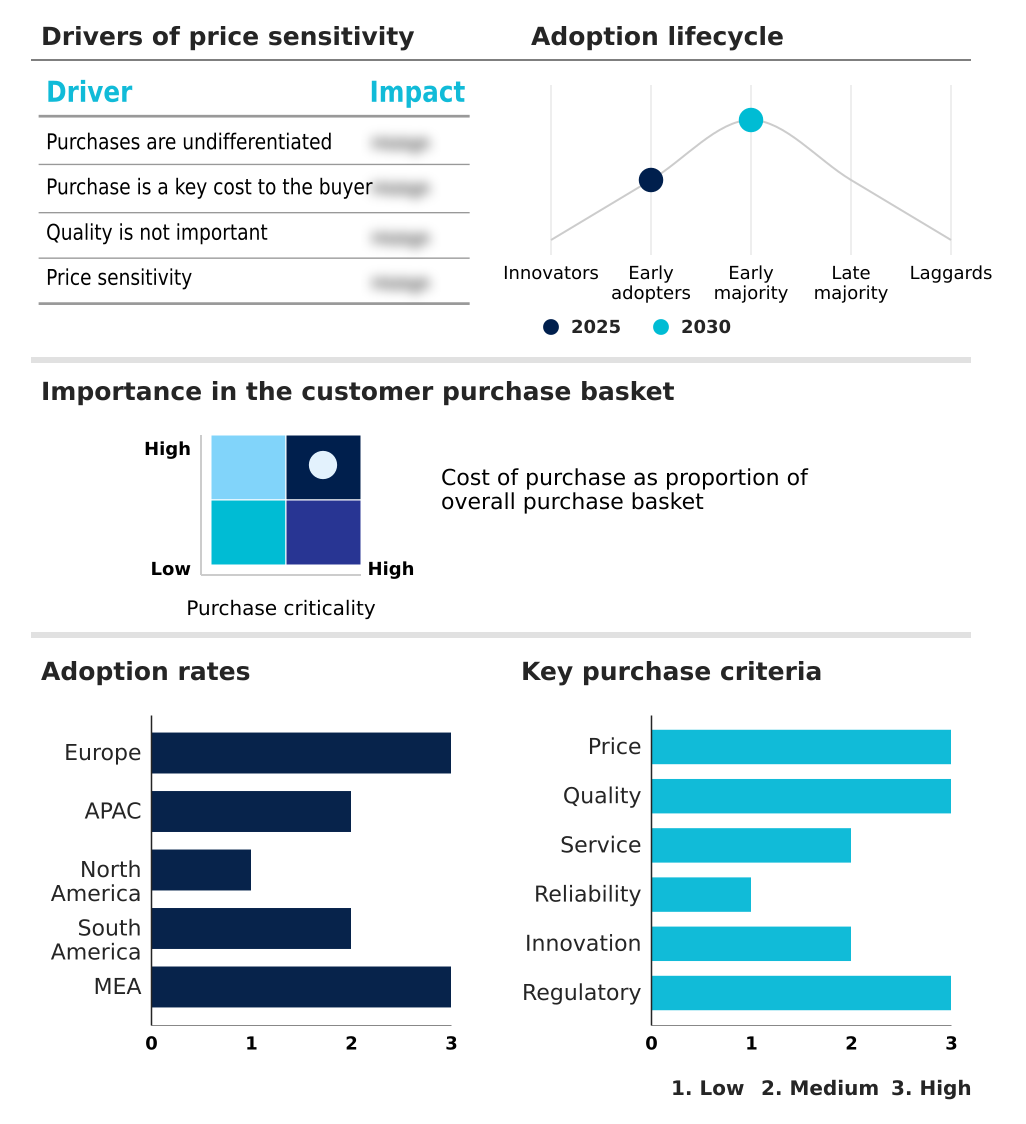
Exclusive Technavio Analysis on Customer Landscape

The digital textile printing market forecasting report includes the adoption lifecycle of the market, covering from the innovator’s stage to the laggard’s stage. It focuses on adoption rates in different regions based on penetration. Furthermore, the digital textile printing market report also includes key purchase criteria and drivers of price sensitivity to help companies evaluate and develop their market growth analysis strategies.

Customer Landscape of Digital Textile Printing Industry

Competitive Landscape

Companies are implementing various strategies, such as strategic alliances, digital textile printing market forecast, partnerships, mergers and acquisitions, geographical expansion, and product/service launches, to enhance their presence in the industry.

aeoon technologies GmbH - Offerings include high-end industrial direct-to-garment (DTG) printing machines and automated pre-treatment systems for advanced, high-volume textile production.

The industry research and growth report includes detailed analyses of the competitive landscape of the market and information about key companies, including:

  • aeoon technologies GmbH
  • Agfa Gevaert NV
  • Aleph S.r.l.
  • ATPColor Srl
  • Brother Industries Ltd.
  • Colorjet Group
  • Durst Group AG
  • Electronics For Imaging Inc.
  • Konica Minolta Inc.
  • Kornit Digital Ltd.
  • Mimaki Engineering Co. Ltd.
  • MS Printing Solutions S.r.l.
  • Orange O Tec Pvt Ltd
  • Papilio Prints
  • Regal Fabrics Inc.
  • Ricoh Co. Ltd.
  • Roland DG Corp.
  • Seiko Epson Corp.
  • SPGPrints
  • The M and R Co

Qualitative and quantitative analysis of companies has been conducted to help clients understand the wider business environment as well as the strengths and weaknesses of key industry players. Data is qualitatively analyzed to categorize companies as pure play, category-focused, industry-focused, and diversified; it is quantitatively analyzed to categorize companies as dominant, leading, strong, tentative, and weak.

Recent Development and News in Digital textile printing market

  • In January, 2025, Kornit Digital announced a strategic realignment of its product roadmap, shifting focus from wide-format advertising textiles to high-speed, on-demand apparel solutions to address changing market demands.
  • In February, 2025, Mimaki Engineering introduced a new automated sensor technology designed to detect and correct ink firing inaccuracies in real-time, aiming to minimize the impact of print head failures on large-scale production runs.
  • In June, 2025, HP Inc. launched an upgraded version of its Stitch series printers, featuring enhanced roll-to-roll handling capabilities that enable continuous 24/7 operation in high-demand manufacturing environments.
  • In July, 2025, Dover Corp., through its MS Printing Solutions division, announced a major partnership with several high-street fashion brands to implement digital textile micro-factories capable of producing custom apparel in real time.

Dive into Technavio’s robust research methodology, blending expert interviews, extensive data synthesis, and validated models for unparalleled Digital Textile Printing Market insights. See full methodology.

Market Scope
Page number 304
Base year 2025
Historic period 2020-2024
Forecast period 2026-2030
Growth momentum & CAGR Accelerate at a CAGR of 16.6%
Market growth 2026-2030 USD 4799.2 million
Market structure Fragmented
YoY growth 2025-2026(%) 14.3%
Key countries Germany, UK, France, Italy, Spain, The Netherlands, China, Japan, India, South Korea, Australia, Indonesia, US, Canada, Mexico, Brazil, Argentina, Chile, Saudi Arabia, UAE, South Africa, Israel and Turkey
Competitive landscape Leading Companies, Market Positioning of Companies, Competitive Strategies, and Industry Risks

Request Free Sample

Research Analyst Overview

  • The digital textile printing market is driven by a fundamental shift toward agile, sustainable, and customized production. Key technologies such as the roll-to-roll process and direct-to-garment printing are enabling on-demand manufacturing, which allows businesses to reduce waste and respond instantly to market demands.
  • At the boardroom level, the decision to invest in digital textile micro-factories is increasingly influenced by sustainability mandates, with firms leveraging industrial inkjet systems for applications like protective clothing decoration and home textiles printing. Innovations in ink chemistry, including pigment ink binders and reactive ink chemistry, are expanding the range of applications for technical textile applications and automotive textile solutions.
  • The adoption of automated pre-treatment and automated finishing tools is streamlining workflows, with some operators achieving a 30% reduction in setup times. The focus on meeting wash-fastness standards and achieving a superior soft-hand feel enhancement is critical for consumer products. Adherence to GOTS compliance and OEKO-TEX certification, supported by developments in water-based organic pigments, has become a competitive differentiator.
  • The market's evolution is marked by continuous improvements in binder chemistry innovation and dye-sublimation technology, pushing the boundaries of what is possible in textile decoration.

What are the Key Data Covered in this Digital Textile Printing Market Research and Growth Report?

  • What is the expected growth of the Digital Textile Printing Market between 2026 and 2030?

    • USD 4.80 billion, at a CAGR of 16.6%

  • What segmentation does the market report cover?

    • The report is segmented by Type (Disperse ink, Reactive ink, Acid ink, and Pigment ink), Application (Clothing, Soft signage, Home textiles, Textiles, and Others), Material (Polyester, Cotton, and Others) and Geography (Europe, APAC, North America, South America, Middle East and Africa)

  • Which regions are analyzed in the report?

    • Europe, APAC, North America, South America and Middle East and Africa

  • What are the key growth drivers and market challenges?

    • Increasing number of trade shows and exhibitions, Shift from print media to digital media

  • Who are the major players in the Digital Textile Printing Market?

    • aeoon technologies GmbH, Agfa Gevaert NV, Aleph S.r.l., ATPColor Srl, Brother Industries Ltd., Colorjet Group, Durst Group AG, Electronics For Imaging Inc., Konica Minolta Inc., Kornit Digital Ltd., Mimaki Engineering Co. Ltd., MS Printing Solutions S.r.l., Orange O Tec Pvt Ltd, Papilio Prints, Regal Fabrics Inc., Ricoh Co. Ltd., Roland DG Corp., Seiko Epson Corp., SPGPrints and The M and R Co

Market Research Insights

  • Market dynamics are increasingly shaped by the push for operational efficiency and sustainability, with businesses adopting advanced technologies to gain a competitive edge. The implementation of seamless production workflows has been shown to reduce material waste by over 25% in some facilities, directly impacting profitability.
  • Furthermore, the adoption of digital solutions enables short-run textile production, with some firms reporting a 40% improvement in turnaround times for custom orders. This agility is critical for fast fashion enablement and custom apparel manufacturing.
  • The emphasis on eco-friendly textile printing is not just a trend but a core business requirement, as textile supply chain digitalization allows for better tracking of resource usage. The integration of high-speed textile printers helps meet the demand for personalized fashion production, where speed and quality are paramount.

We can help! Our analysts can customize this digital textile printing market research report to meet your requirements.

Get in touch

1. Executive Summary

1.1 Market overview

Executive Summary - Chart on Market Overview
Executive Summary - Data Table on Market Overview
Executive Summary - Chart on Global Market Characteristics
Executive Summary - Chart on Market by Geography
Executive Summary - Chart on Market Segmentation by Type
Executive Summary - Chart on Market Segmentation by Application
Executive Summary - Chart on Market Segmentation by Material
Executive Summary - Chart on Incremental Growth
Executive Summary - Data Table on Incremental Growth
Executive Summary - Chart on Company Market Positioning

2. Technavio Analysis

2.1 Analysis of price sensitivity, lifecycle, customer purchase basket, adoption rates, and purchase criteria

2.2 Criticality of inputs and Factors of differentiation

Chart on Overview on criticality of inputs and factors of differentiation

2.3 Factors of disruption

Chart on Overview on factors of disruption

2.4 Impact of drivers and challenges

Chart on Impact of drivers and challenges in 2025 and 2030

3. Market Landscape

3.1 Market ecosystem

Chart on Parent Market
Data Table on - Parent Market

3.2 Market characteristics

Chart on Market characteristics analysis

3.3 Value chain analysis

Chart on Value chain analysis

4. Market Sizing

4.1 Market definition

Data Table on Offerings of companies included in the market definition

4.2 Market segment analysis

Market segments

4.3 Market size 2025

4.4 Market outlook: Forecast for 2025-2030

Chart on Global - Market size and forecast 2025-2030 ($ million)
Data Table on Global - Market size and forecast 2025-2030 ($ million)
Chart on Global Market: Year-over-year growth 2025-2030 (%)
Data Table on Global Market: Year-over-year growth 2025-2030 (%)

5. Historic Market Size

5.1 Global Digital Textile Printing Market 2020 - 2024

Historic Market Size - Data Table on Global Digital Textile Printing Market 2020 - 2024 ($ million)

5.2 Type segment analysis 2020 - 2024

Historic Market Size - Type Segment 2020 - 2024 ($ million)

5.3 Application segment analysis 2020 - 2024

Historic Market Size - Application Segment 2020 - 2024 ($ million)

5.4 Material segment analysis 2020 - 2024

Historic Market Size - Material Segment 2020 - 2024 ($ million)

5.5 Geography segment analysis 2020 - 2024

Historic Market Size - Geography Segment 2020 - 2024 ($ million)

5.6 Country segment analysis 2020 - 2024

Historic Market Size - Country Segment 2020 - 2024 ($ million)

6. Qualitative Analysis

6.1 Impact of AI on Global Digital Textile Printing Market

6.2 Impact of Geopolitical Conflicts on Global Digital Textile Printing Market

7. Five Forces Analysis

7.1 Five forces summary

Five forces analysis - Comparison between 2025 and 2030

7.2 Bargaining power of buyers

Bargaining power of buyers - Impact of key factors 2025 and 2030

7.3 Bargaining power of suppliers

Bargaining power of suppliers - Impact of key factors in 2025 and 2030

7.4 Threat of new entrants

Threat of new entrants - Impact of key factors in 2025 and 2030

7.5 Threat of substitutes

Threat of substitutes - Impact of key factors in 2025 and 2030

7.6 Threat of rivalry

Threat of rivalry - Impact of key factors in 2025 and 2030

7.7 Market condition

Chart on Market condition - Five forces 2025 and 2030

8. Market Segmentation by Type

8.1 Market segments

Chart on Type - Market share 2025-2030 (%)
Data Table on Type - Market share 2025-2030 (%)

8.2 Comparison by Type

Chart on Comparison by Type
Data Table on Comparison by Type

8.3 Disperse ink - Market size and forecast 2025-2030

Chart on Disperse ink - Market size and forecast 2025-2030 ($ million)
Data Table on Disperse ink - Market size and forecast 2025-2030 ($ million)
Chart on Disperse ink - Year-over-year growth 2025-2030 (%)
Data Table on Disperse ink - Year-over-year growth 2025-2030 (%)

8.4 Reactive ink - Market size and forecast 2025-2030

Chart on Reactive ink - Market size and forecast 2025-2030 ($ million)
Data Table on Reactive ink - Market size and forecast 2025-2030 ($ million)
Chart on Reactive ink - Year-over-year growth 2025-2030 (%)
Data Table on Reactive ink - Year-over-year growth 2025-2030 (%)

8.5 Acid ink - Market size and forecast 2025-2030

Chart on Acid ink - Market size and forecast 2025-2030 ($ million)
Data Table on Acid ink - Market size and forecast 2025-2030 ($ million)
Chart on Acid ink - Year-over-year growth 2025-2030 (%)
Data Table on Acid ink - Year-over-year growth 2025-2030 (%)

8.6 Pigment ink - Market size and forecast 2025-2030

Chart on Pigment ink - Market size and forecast 2025-2030 ($ million)
Data Table on Pigment ink - Market size and forecast 2025-2030 ($ million)
Chart on Pigment ink - Year-over-year growth 2025-2030 (%)
Data Table on Pigment ink - Year-over-year growth 2025-2030 (%)

8.7 Market opportunity by Type

Market opportunity by Type ($ million)
Data Table on Market opportunity by Type ($ million)

9. Market Segmentation by Application

9.1 Market segments

Chart on Application - Market share 2025-2030 (%)
Data Table on Application - Market share 2025-2030 (%)

9.2 Comparison by Application

Chart on Comparison by Application
Data Table on Comparison by Application

9.3 Clothing - Market size and forecast 2025-2030

Chart on Clothing - Market size and forecast 2025-2030 ($ million)
Data Table on Clothing - Market size and forecast 2025-2030 ($ million)
Chart on Clothing - Year-over-year growth 2025-2030 (%)
Data Table on Clothing - Year-over-year growth 2025-2030 (%)

9.4 Soft signage - Market size and forecast 2025-2030

Chart on Soft signage - Market size and forecast 2025-2030 ($ million)
Data Table on Soft signage - Market size and forecast 2025-2030 ($ million)
Chart on Soft signage - Year-over-year growth 2025-2030 (%)
Data Table on Soft signage - Year-over-year growth 2025-2030 (%)

9.5 Home textiles - Market size and forecast 2025-2030

Chart on Home textiles - Market size and forecast 2025-2030 ($ million)
Data Table on Home textiles - Market size and forecast 2025-2030 ($ million)
Chart on Home textiles - Year-over-year growth 2025-2030 (%)
Data Table on Home textiles - Year-over-year growth 2025-2030 (%)

9.6 Textiles - Market size and forecast 2025-2030

Chart on Textiles - Market size and forecast 2025-2030 ($ million)
Data Table on Textiles - Market size and forecast 2025-2030 ($ million)
Chart on Textiles - Year-over-year growth 2025-2030 (%)
Data Table on Textiles - Year-over-year growth 2025-2030 (%)

9.7 Others - Market size and forecast 2025-2030

Chart on Others - Market size and forecast 2025-2030 ($ million)
Data Table on Others - Market size and forecast 2025-2030 ($ million)
Chart on Others - Year-over-year growth 2025-2030 (%)
Data Table on Others - Year-over-year growth 2025-2030 (%)

9.8 Market opportunity by Application

Market opportunity by Application ($ million)
Data Table on Market opportunity by Application ($ million)

10. Market Segmentation by Material

10.1 Market segments

Chart on Material - Market share 2025-2030 (%)
Data Table on Material - Market share 2025-2030 (%)

10.2 Comparison by Material

Chart on Comparison by Material
Data Table on Comparison by Material

10.3 Polyester - Market size and forecast 2025-2030

Chart on Polyester - Market size and forecast 2025-2030 ($ million)
Data Table on Polyester - Market size and forecast 2025-2030 ($ million)
Chart on Polyester - Year-over-year growth 2025-2030 (%)
Data Table on Polyester - Year-over-year growth 2025-2030 (%)

10.4 Cotton - Market size and forecast 2025-2030

Chart on Cotton - Market size and forecast 2025-2030 ($ million)
Data Table on Cotton - Market size and forecast 2025-2030 ($ million)
Chart on Cotton - Year-over-year growth 2025-2030 (%)
Data Table on Cotton - Year-over-year growth 2025-2030 (%)

10.5 Others - Market size and forecast 2025-2030

Chart on Others - Market size and forecast 2025-2030 ($ million)
Data Table on Others - Market size and forecast 2025-2030 ($ million)
Chart on Others - Year-over-year growth 2025-2030 (%)
Data Table on Others - Year-over-year growth 2025-2030 (%)

10.6 Market opportunity by Material

Market opportunity by Material ($ million)
Data Table on Market opportunity by Material ($ million)

11. Customer Landscape

11.1 Customer landscape overview

Analysis of price sensitivity, lifecycle, customer purchase basket, adoption rates, and purchase criteria

12. Geographic Landscape

12.1 Geographic segmentation

Chart on Market share by geography 2025-2030 (%)
Data Table on Market share by geography 2025-2030 (%)

12.2 Geographic comparison

Chart on Geographic comparison
Data Table on Geographic comparison

12.3 Europe - Market size and forecast 2025-2030

Chart on Europe - Market size and forecast 2025-2030 ($ million)
Data Table on Europe - Market size and forecast 2025-2030 ($ million)
Chart on Europe - Year-over-year growth 2025-2030 (%)
Data Table on Europe - Year-over-year growth 2025-2030 (%)
Chart on Regional Comparison - Europe
Data Table on Regional Comparison - Europe

12.3.1 Germany - Market size and forecast 2025-2030

Chart on Germany - Market size and forecast 2025-2030 ($ million)
Data Table on Germany - Market size and forecast 2025-2030 ($ million)
Chart on Germany - Year-over-year growth 2025-2030 (%)
Data Table on Germany - Year-over-year growth 2025-2030 (%)

12.3.2 UK - Market size and forecast 2025-2030

Chart on UK - Market size and forecast 2025-2030 ($ million)
Data Table on UK - Market size and forecast 2025-2030 ($ million)
Chart on UK - Year-over-year growth 2025-2030 (%)
Data Table on UK - Year-over-year growth 2025-2030 (%)

12.3.3 France - Market size and forecast 2025-2030

Chart on France - Market size and forecast 2025-2030 ($ million)
Data Table on France - Market size and forecast 2025-2030 ($ million)
Chart on France - Year-over-year growth 2025-2030 (%)
Data Table on France - Year-over-year growth 2025-2030 (%)

12.3.4 Italy - Market size and forecast 2025-2030

Chart on Italy - Market size and forecast 2025-2030 ($ million)
Data Table on Italy - Market size and forecast 2025-2030 ($ million)
Chart on Italy - Year-over-year growth 2025-2030 (%)
Data Table on Italy - Year-over-year growth 2025-2030 (%)

12.3.5 Spain - Market size and forecast 2025-2030

Chart on Spain - Market size and forecast 2025-2030 ($ million)
Data Table on Spain - Market size and forecast 2025-2030 ($ million)
Chart on Spain - Year-over-year growth 2025-2030 (%)
Data Table on Spain - Year-over-year growth 2025-2030 (%)

12.3.6 The Netherlands - Market size and forecast 2025-2030

Chart on The Netherlands - Market size and forecast 2025-2030 ($ million)
Data Table on The Netherlands - Market size and forecast 2025-2030 ($ million)
Chart on The Netherlands - Year-over-year growth 2025-2030 (%)
Data Table on The Netherlands - Year-over-year growth 2025-2030 (%)

12.4 APAC - Market size and forecast 2025-2030

Chart on APAC - Market size and forecast 2025-2030 ($ million)
Data Table on APAC - Market size and forecast 2025-2030 ($ million)
Chart on APAC - Year-over-year growth 2025-2030 (%)
Data Table on APAC - Year-over-year growth 2025-2030 (%)
Chart on Regional Comparison - APAC
Data Table on Regional Comparison - APAC

12.4.1 China - Market size and forecast 2025-2030

Chart on China - Market size and forecast 2025-2030 ($ million)
Data Table on China - Market size and forecast 2025-2030 ($ million)
Chart on China - Year-over-year growth 2025-2030 (%)
Data Table on China - Year-over-year growth 2025-2030 (%)

12.4.2 Japan - Market size and forecast 2025-2030

Chart on Japan - Market size and forecast 2025-2030 ($ million)
Data Table on Japan - Market size and forecast 2025-2030 ($ million)
Chart on Japan - Year-over-year growth 2025-2030 (%)
Data Table on Japan - Year-over-year growth 2025-2030 (%)

12.4.3 India - Market size and forecast 2025-2030

Chart on India - Market size and forecast 2025-2030 ($ million)
Data Table on India - Market size and forecast 2025-2030 ($ million)
Chart on India - Year-over-year growth 2025-2030 (%)
Data Table on India - Year-over-year growth 2025-2030 (%)

12.4.4 South Korea - Market size and forecast 2025-2030

Chart on South Korea - Market size and forecast 2025-2030 ($ million)
Data Table on South Korea - Market size and forecast 2025-2030 ($ million)
Chart on South Korea - Year-over-year growth 2025-2030 (%)
Data Table on South Korea - Year-over-year growth 2025-2030 (%)

12.4.5 Australia - Market size and forecast 2025-2030

Chart on Australia - Market size and forecast 2025-2030 ($ million)
Data Table on Australia - Market size and forecast 2025-2030 ($ million)
Chart on Australia - Year-over-year growth 2025-2030 (%)
Data Table on Australia - Year-over-year growth 2025-2030 (%)

12.4.6 Indonesia - Market size and forecast 2025-2030

Chart on Indonesia - Market size and forecast 2025-2030 ($ million)
Data Table on Indonesia - Market size and forecast 2025-2030 ($ million)
Chart on Indonesia - Year-over-year growth 2025-2030 (%)
Data Table on Indonesia - Year-over-year growth 2025-2030 (%)

12.5 North America - Market size and forecast 2025-2030

Chart on North America - Market size and forecast 2025-2030 ($ million)
Data Table on North America - Market size and forecast 2025-2030 ($ million)
Chart on North America - Year-over-year growth 2025-2030 (%)
Data Table on North America - Year-over-year growth 2025-2030 (%)
Chart on Regional Comparison - North America
Data Table on Regional Comparison - North America

12.5.1 US - Market size and forecast 2025-2030

Chart on US - Market size and forecast 2025-2030 ($ million)
Data Table on US - Market size and forecast 2025-2030 ($ million)
Chart on US - Year-over-year growth 2025-2030 (%)
Data Table on US - Year-over-year growth 2025-2030 (%)

12.5.2 Canada - Market size and forecast 2025-2030

Chart on Canada - Market size and forecast 2025-2030 ($ million)
Data Table on Canada - Market size and forecast 2025-2030 ($ million)
Chart on Canada - Year-over-year growth 2025-2030 (%)
Data Table on Canada - Year-over-year growth 2025-2030 (%)

12.5.3 Mexico - Market size and forecast 2025-2030

Chart on Mexico - Market size and forecast 2025-2030 ($ million)
Data Table on Mexico - Market size and forecast 2025-2030 ($ million)
Chart on Mexico - Year-over-year growth 2025-2030 (%)
Data Table on Mexico - Year-over-year growth 2025-2030 (%)

12.6 South America - Market size and forecast 2025-2030

Chart on South America - Market size and forecast 2025-2030 ($ million)
Data Table on South America - Market size and forecast 2025-2030 ($ million)
Chart on South America - Year-over-year growth 2025-2030 (%)
Data Table on South America - Year-over-year growth 2025-2030 (%)
Chart on Regional Comparison - South America
Data Table on Regional Comparison - South America

12.6.1 Brazil - Market size and forecast 2025-2030

Chart on Brazil - Market size and forecast 2025-2030 ($ million)
Data Table on Brazil - Market size and forecast 2025-2030 ($ million)
Chart on Brazil - Year-over-year growth 2025-2030 (%)
Data Table on Brazil - Year-over-year growth 2025-2030 (%)

12.6.2 Argentina - Market size and forecast 2025-2030

Chart on Argentina - Market size and forecast 2025-2030 ($ million)
Data Table on Argentina - Market size and forecast 2025-2030 ($ million)
Chart on Argentina - Year-over-year growth 2025-2030 (%)
Data Table on Argentina - Year-over-year growth 2025-2030 (%)

12.6.3 Chile - Market size and forecast 2025-2030

Chart on Chile - Market size and forecast 2025-2030 ($ million)
Data Table on Chile - Market size and forecast 2025-2030 ($ million)
Chart on Chile - Year-over-year growth 2025-2030 (%)
Data Table on Chile - Year-over-year growth 2025-2030 (%)

12.7 Middle East and Africa - Market size and forecast 2025-2030

Chart on Middle East and Africa - Market size and forecast 2025-2030 ($ million)
Data Table on Middle East and Africa - Market size and forecast 2025-2030 ($ million)
Chart on Middle East and Africa - Year-over-year growth 2025-2030 (%)
Data Table on Middle East and Africa - Year-over-year growth 2025-2030 (%)
Chart on Regional Comparison - Middle East and Africa
Data Table on Regional Comparison - Middle East and Africa

12.7.1 Saudi Arabia - Market size and forecast 2025-2030

Chart on Saudi Arabia - Market size and forecast 2025-2030 ($ million)
Data Table on Saudi Arabia - Market size and forecast 2025-2030 ($ million)
Chart on Saudi Arabia - Year-over-year growth 2025-2030 (%)
Data Table on Saudi Arabia - Year-over-year growth 2025-2030 (%)

12.7.2 UAE - Market size and forecast 2025-2030

Chart on UAE - Market size and forecast 2025-2030 ($ million)
Data Table on UAE - Market size and forecast 2025-2030 ($ million)
Chart on UAE - Year-over-year growth 2025-2030 (%)
Data Table on UAE - Year-over-year growth 2025-2030 (%)

12.7.3 South Africa - Market size and forecast 2025-2030

Chart on South Africa - Market size and forecast 2025-2030 ($ million)
Data Table on South Africa - Market size and forecast 2025-2030 ($ million)
Chart on South Africa - Year-over-year growth 2025-2030 (%)
Data Table on South Africa - Year-over-year growth 2025-2030 (%)

12.7.4 Israel - Market size and forecast 2025-2030

Chart on Israel - Market size and forecast 2025-2030 ($ million)
Data Table on Israel - Market size and forecast 2025-2030 ($ million)
Chart on Israel - Year-over-year growth 2025-2030 (%)
Data Table on Israel - Year-over-year growth 2025-2030 (%)

12.7.5 Turkey - Market size and forecast 2025-2030

Chart on Turkey - Market size and forecast 2025-2030 ($ million)
Data Table on Turkey - Market size and forecast 2025-2030 ($ million)
Chart on Turkey - Year-over-year growth 2025-2030 (%)
Data Table on Turkey - Year-over-year growth 2025-2030 (%)

12.8 Market opportunity by geography

Market opportunity by geography ($ million)
Data Tables on Market opportunity by geography ($ million)

13. Drivers, Challenges, and Opportunity

13.1 Market drivers

Increasing number of trade shows and exhibitions
Rising adoption of roll-to-roll process
Growth of apparel market globally is influencing market growth

13.2 Market challenges

Shift from print media to digital media
Printing-related problems is hampering market growth
Fluctuations in raw material prices

13.3 Impact of drivers and challenges

Impact of drivers and challenges in 2025 and 2030

13.4 Market opportunities

Increasing significance of UV-cured inks
Growing range of ink offerings is amplifying market expedition
Rising use of organic pigments in inks

14. Competitive Landscape

14.1 Overview

14.2

Overview on criticality of inputs and factors of differentiation

14.3 Landscape disruption

Overview on factors of disruption

14.4 Industry risks

Impact of key risks on business

15. Competitive Analysis

15.1 Companies profiled

Companies covered

15.2 Company ranking index

15.3 Market positioning of companies

Matrix on companies position and classification

15.4 aeoon technologies GmbH

aeoon technologies GmbH - Overview
aeoon technologies GmbH - Product / Service
aeoon technologies GmbH - Key offerings
SWOT

15.5 Agfa Gevaert NV

Agfa Gevaert NV - Overview
Agfa Gevaert NV - Business segments
Agfa Gevaert NV - Key offerings
Agfa Gevaert NV - Segment focus
SWOT

15.6 Brother Industries Ltd.

Brother Industries Ltd. - Overview
Brother Industries Ltd. - Business segments
Brother Industries Ltd. - Key offerings
Brother Industries Ltd. - Segment focus
SWOT

15.7 Colorjet Group

Colorjet Group - Overview
Colorjet Group - Product / Service
Colorjet Group - Key offerings
SWOT

15.8 Durst Group AG

Durst Group AG - Overview
Durst Group AG - Product / Service
Durst Group AG - Key offerings
SWOT

15.9 Electronics For Imaging Inc.

Electronics For Imaging Inc. - Overview
Electronics For Imaging Inc. - Product / Service
Electronics For Imaging Inc. - Key offerings
SWOT

15.10 Kornit Digital Ltd.

Kornit Digital Ltd. - Overview
Kornit Digital Ltd. - Product / Service
Kornit Digital Ltd. - Key offerings
SWOT

15.11 Mimaki Engineering Co. Ltd.

Mimaki Engineering Co. Ltd. - Overview
Mimaki Engineering Co. Ltd. - Product / Service
Mimaki Engineering Co. Ltd. - Key offerings
SWOT

15.12 MS Printing Solutions S.r.l.

MS Printing Solutions S.r.l. - Overview
MS Printing Solutions S.r.l. - Product / Service
MS Printing Solutions S.r.l. - Key offerings
SWOT

15.13 Papilio Prints

Papilio Prints - Overview
Papilio Prints - Product / Service
Papilio Prints - Key offerings
SWOT

15.14 Ricoh Co. Ltd.

Ricoh Co. Ltd. - Overview
Ricoh Co. Ltd. - Business segments
Ricoh Co. Ltd. - Key offerings
Ricoh Co. Ltd. - Segment focus
SWOT

15.15 Roland DG Corp.

Roland DG Corp. - Overview
Roland DG Corp. - Product / Service
Roland DG Corp. - Key offerings
SWOT

15.16 Seiko Epson Corp.

Seiko Epson Corp. - Overview
Seiko Epson Corp. - Business segments
Seiko Epson Corp. - Key offerings
Seiko Epson Corp. - Segment focus
SWOT

15.17 SPGPrints

SPGPrints - Overview
SPGPrints - Product / Service
SPGPrints - Key offerings
SWOT

15.18 The M and R Co

The M and R Co - Overview
The M and R Co - Product / Service
The M and R Co - Key offerings
SWOT

16. Appendix

16.1 Scope of the report

Market definition
Objectives
Notes and caveats

16.2 Inclusions and exclusions checklist

Inclusions checklist
Exclusions checklist

16.3 Currency conversion rates for US$

16.4 Research methodology

16.5 Data procurement

Information sources

16.6 Data validation

16.7 Validation techniques employed for market sizing

16.8 Data synthesis

16.9 360 degree market analysis

16.10 List of abbreviations

Research Methodology

Technavio presents a detailed picture of the market by way of study, synthesis, and summation of data from multiple sources. The analysts have presented the various facets of the market with a particular focus on identifying the key industry influencers. The data thus presented is comprehensive, reliable, and the result of extensive research, both primary and secondary.

INFORMATION SOURCES

Primary sources

  • Manufacturers and suppliers
  • Channel partners
  • Industry experts
  • Strategic decision makers

Secondary sources

  • Industry journals and periodicals
  • Government data
  • Financial reports of key industry players
  • Historical data
  • Press releases

DATA ANALYSIS

Data Synthesis

  • Collation of data
  • Estimation of key figures
  • Analysis of derived insights

Data Validation

  • Triangulation with data models
  • Reference against proprietary databases
  • Corroboration with industry experts

REPORT WRITING

Qualitative

  • Market drivers
  • Market challenges
  • Market trends
  • Five forces analysis

Quantitative

  • Market size and forecast
  • Market segmentation
  • Geographical insights
  • Competitive landscape

Interested in this report?

Get your sample now to see our research methodology and insights!

Download Now

Frequently Asked Questions

Digital Textile Printing market growth will increase by USD 4799.2 million during 2026-2030.

The Digital Textile Printing market is expected to grow at a CAGR of 16.6% during 2026-2030.

Digital Textile Printing market is segmented by Type (Disperse ink, Reactive ink, Acid ink, Pigment ink) Application (Clothing, Soft signage, Home textiles, Textiles, Others) Material (Polyester, Cotton, Others)

aeoon technologies GmbH, Agfa Gevaert NV, Aleph S.r.l., ATPColor Srl, Brother Industries Ltd., Colorjet Group, Durst Group AG, Electronics For Imaging Inc., Konica Minolta Inc., Kornit Digital Ltd., Mimaki Engineering Co. Ltd., MS Printing Solutions S.r.l., Orange O Tec Pvt Ltd, Papilio Prints, Regal Fabrics Inc., Ricoh Co. Ltd., Roland DG Corp., Seiko Epson Corp., SPGPrints, The M and R Co are a few of the key vendors in the Digital Textile Printing market.

Europe will register the highest growth rate of 39.8% among the other regions. Therefore, the Digital Textile Printing market in Europe is expected to garner significant business opportunities for the vendors during the forecast period.

Germany, UK, France, Italy, Spain, The Netherlands, China, Japan, India, South Korea, Australia, Indonesia, US, Canada, Mexico, Brazil, Argentina, Chile, Saudi Arabia, UAE, South Africa, Israel, Turkey

  • Increasing number of trade shows and exhibitions is the driving factor this market.

The Digital Textile Printing market vendors should focus on grabbing business opportunities from the Type segment as it accounted for the largest market share in the base year.
RIA - Research AI Assistant
Ask RIA