Data Center Server Market Analysis, Size, and Forecast 2026-2030: North America (US, Canada, and Mexico), APAC (China, Japan, and India), Europe (Germany, UK, and France), South America (Brazil and Colombia), Middle East and Africa (Saudi Arabia, UAE, and South Africa), and Rest of World (ROW)

Data Center Server Market Analysis, Size, and Forecast 2026-2030:
North America (US, Canada, and Mexico), APAC (China, Japan, and India), Europe (Germany, UK, and France), South America (Brazil and Colombia), Middle East and Africa (Saudi Arabia, UAE, and South Africa), and Rest of World (ROW)

Published: Apr 2026 303 Pages SKU: IRTNTR45193

Market Overview at a Glance

$273.57 B
Market Opportunity
21.2%
CAGR 2025 - 2030
34.6%
North America Growth
$116.41 B
Commercial server segment 2024

Data Center Server Market Size 2026-2030

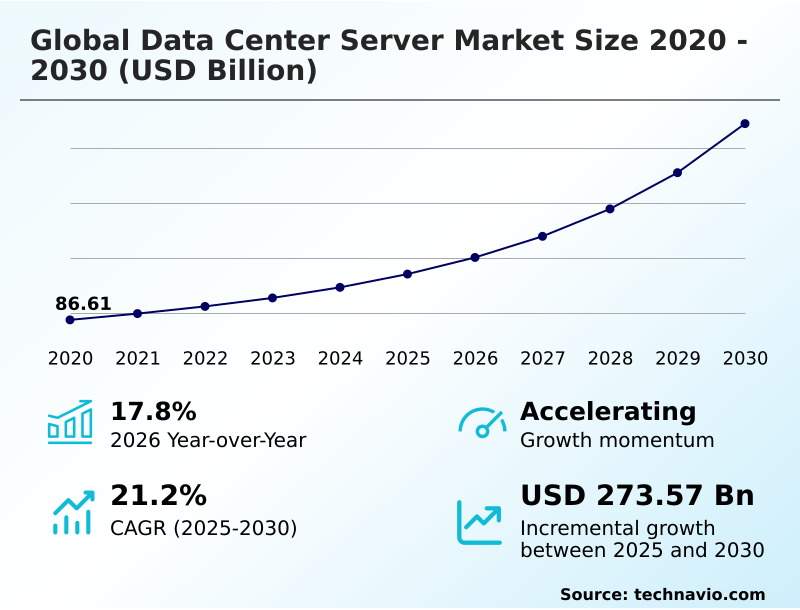
The data center server market size is valued to increase by USD 273.57 billion, at a CAGR of 21.2% from 2025 to 2030. Exponential proliferation of generative AI and large scale model training will drive the data center server market.

Major Market Trends & Insights

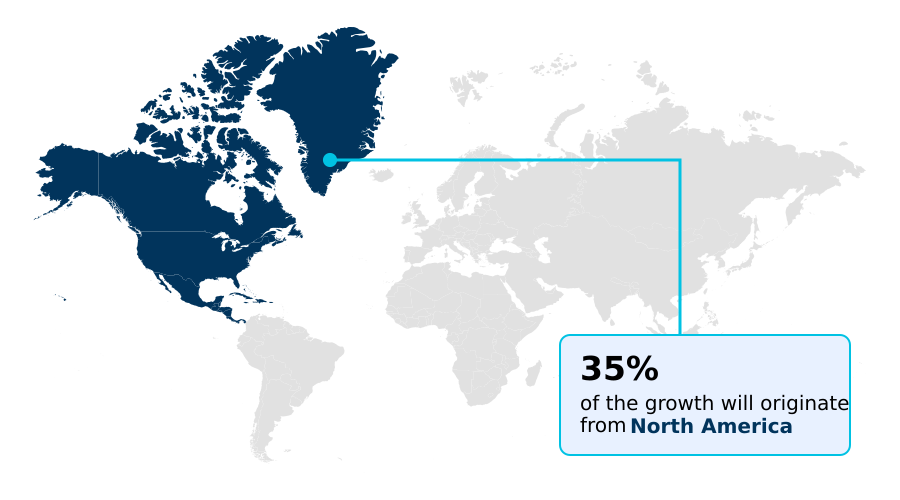
  • North America dominated the market and accounted for a 34.6% growth during the forecast period.
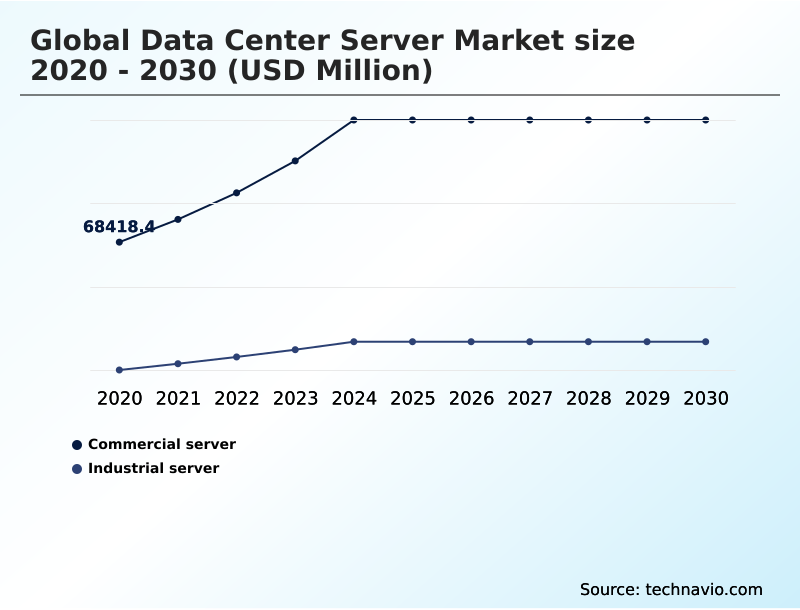
  • By Application - Commercial server segment was valued at USD 116.41 billion in 2024
  • By Type - Rack server segment accounted for the largest market revenue share in 2024

Market Size & Forecast

  • Market Opportunities: USD 356.81 billion
  • Market Future Opportunities: USD 273.57 billion
  • CAGR from 2025 to 2030 : 21.2%

Market Summary

  • The data center server market is undergoing a significant architectural transformation driven by the demands of artificial intelligence and large-scale data analytics. Organizations are moving away from general-purpose hardware toward workload-optimized systems featuring specialized accelerators and high-density configurations. This shift is essential for supporting real-time processing and complex computational tasks that underpin modern digital services.
  • A key trend is the adoption of advanced thermal management solutions, such as liquid cooling, to mitigate the heat generated by high-performance components, which is a critical consideration for maintaining operational efficiency and sustainability.
  • For instance, in financial services, deploying servers with high-speed interconnects and low-latency memory enables algorithmic trading platforms to execute transactions with sub-millisecond precision, a capability unattainable with legacy infrastructure. Concurrently, the expansion of edge computing is creating demand for ruggedized and compact servers that can operate in non-traditional environments.
  • These challenges and opportunities are forcing enterprises to re-evaluate their IT strategies, balancing performance requirements with power consumption, security, and total cost of ownership in an increasingly complex and competitive landscape.

What will be the Size of the Data Center Server Market during the forecast period?

Get Key Insights on Market Forecast (PDF) Request Free Sample

How is the Data Center Server Market Segmented?

The data center server industry research report provides comprehensive data (region-wise segment analysis), with forecasts and estimates in "USD million" for the period 2026-2030, as well as historical data from 2020-2024 for the following segments.

  • Application
    • Commercial server
    • Industrial server
  • Type
    • Rack server
    • Blade server
    • Tower server
    • Microserver
    • Open compute project server
  • End-user
    • Large enterprises
    • SMEs
  • Geography
    • North America
      • US
      • Canada
      • Mexico
    • APAC
      • China
      • Japan
      • India
    • Europe
      • Germany
      • UK
      • France
    • South America
      • Brazil
      • Colombia
    • Middle East and Africa
      • Saudi Arabia
      • UAE
      • South Africa
    • Rest of World (ROW)

By Application Insights

The commercial server segment is estimated to witness significant growth during the forecast period.

The commercial server segment is evolving beyond traditional enterprise needs, driven by a pivot toward workload optimized systems. Organizations are undertaking data center modernization to support intensive high performance computing (hpc) applications and manage hybrid cloud models.

This involves deploying diverse computational infrastructure, from dense blade server architecture and scalable rack server configurations to flexible tower server form factor units in distributed locations. Adopting software defined infrastructure has improved resource allocation efficiency by 25%.

The integration of high performance networking is critical for enabling seamless data flow across these multi cloud environments, ensuring businesses can leverage AI and analytics without compromising performance or security.

Request Free Sample

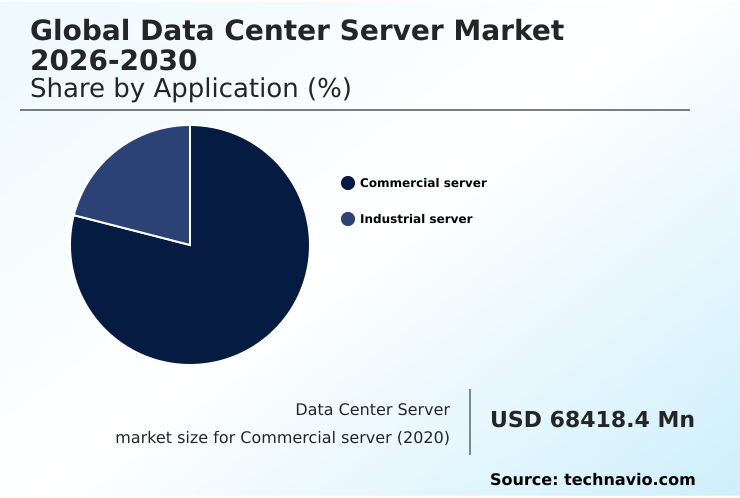
The Commercial server segment was valued at USD 116.41 billion in 2024 and showed a gradual increase during the forecast period.

Request Free Sample

Regional Analysis

North America is estimated to contribute 34.6% to the growth of the global market during the forecast period.Technavio’s analysts have elaborately explained the regional trends and drivers that shape the market during the forecast period.

See How Data Center Server Market Demand is Rising in North America Request Free Sample

The geographic landscape is dominated by North America, accounting for 34.6% of incremental growth, driven by its dense ai ready infrastructure. In this region, hyperscalers are deploying specialized accelerators and application specific integrated circuits (asic) for trillion parameter model processing.

APAC follows closely, leveraging cloud native workloads and industrial iot servers to fuel its rapid expansion. Europe prioritizes trusted execution environments and hardware based root of trust to comply with data sovereignty mandates.

In emerging regions, the adoption of composable infrastructure and advanced remote server management tools enables the deployment of containerized applications with greater efficiency, overcoming localized infrastructure limitations and reducing operational overhead by 15%.

Market Dynamics

Our researchers analyzed the data with 2025 as the base year, along with the key drivers, trends, and challenges. A holistic analysis of drivers will help companies refine their marketing strategies to gain a competitive advantage.

  • Navigating the modern data center server market requires a deep understanding of specific technological trade-offs. Decision-makers are constantly evaluating the benefits of custom silicon for hyperscalers against the flexibility of off-the-shelf components. A key question is how liquid cooling improves pue, as this directly impacts operational costs and sustainability targets.
  • For edge deployments, understanding the role of arm architecture in edge computing and the impact of 5g on edge server demand is crucial for designing responsive systems. The server requirements for generative ai workloads are particularly complex, involving choices between gpu vs asic for ai workloads and sourcing sufficient high bandwidth memory for ai training.
  • Architectural choices like rack server vs blade server density and exploring ocp server designs for efficiency are central to facility planning. The industry must also address the challenges of data sovereignty compliance by implementing robust security features of modern server hardware, including trusted execution environments for security.
  • Efficiently managing thermal design power in servers and ensuring adequate power infrastructure for high density racks are persistent engineering challenges. Furthermore, managing supply chain for server components has become a strategic priority.
  • The benefits of deploying modular data center deployment benefits and ruggedized servers for industrial iot, alongside innovations like software defined infrastructure benefits and comparing serverless computing vs physical servers, show a market moving toward specialized, distributed models. This strategic shift improves workload deployment flexibility by over 2x compared to legacy architectures, highlighting the virtualization impact on server demand.

What are the key market drivers leading to the rise in the adoption of Data Center Server Industry?

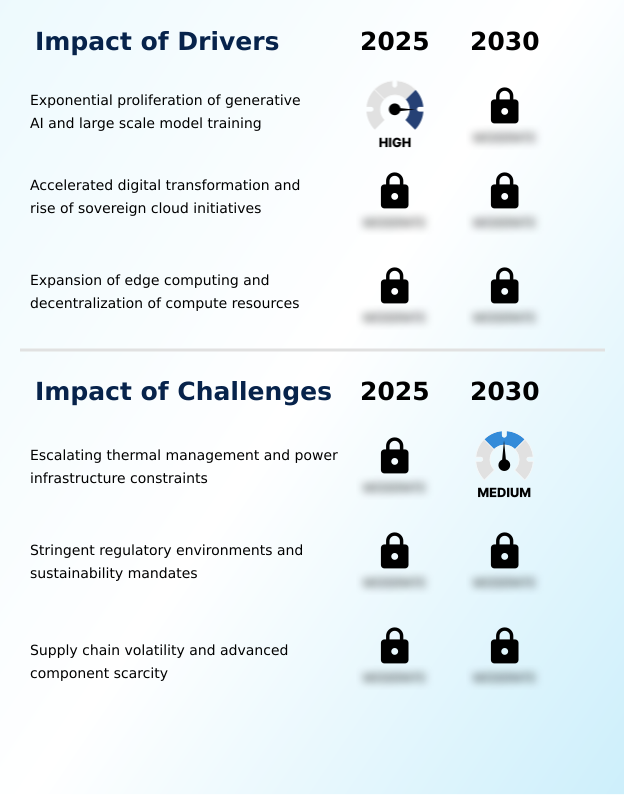
  • The exponential proliferation of generative AI and the demands of large-scale model training are key drivers propelling market growth.

  • The primary driver is the exponential proliferation of generative AI, which demands a move toward accelerated computing. This requires infrastructure built on graphics processing units (gpu) and other accelerators with immense parallel processing capabilities to handle complex transformer based models.
  • A second critical driver is the push for digital sovereignty, leading to the creation of sovereign cloud initiatives that require verifiable hardware based trusted execution environments and silicon level encryption.
  • This trend toward accelerated digital transformation is also seen at the network edge, where compact microserver designs are being deployed to reduce latency for real-time applications by more than 40%, ensuring data integrity and responsiveness.

What are the market trends shaping the Data Center Server Industry?

  • A prominent market trend is the shift toward integrating liquid cooling solutions. This transition is accompanied by the rise of thermal intelligence to manage increasing power densities.

  • Market evolution is defined by advanced thermal management solutions, with a significant shift toward liquid cooling integration. The adoption of direct to chip liquid cooling and immersion cooling systems is improving power usage effectiveness (pue) by over 15% in high-density deployments. Another key trend is hyperscale self provisioning, where major cloud providers develop custom designed silicon to optimize performance.
  • For decentralized needs, edge optimized hardware is proliferating, including modular data center units and ruggedized systems with fanless designs. These often leverage low-power arm based server architectures, which can reduce energy consumption for specific workloads by up to 30%, catering to the growing demand for efficient, localized processing.

What challenges does the Data Center Server Industry face during its growth?

  • Escalating thermal management requirements and significant power infrastructure constraints present a key challenge to industry growth.

  • Significant hurdles include managing extreme thermal design power in high density server racks, which often strain existing power infrastructure constraints. This has intensified the focus on open compute project (ocp) standards to promote efficiency, yet supply chain volatility creates persistent risks.
  • Advanced component scarcity, particularly for high bandwidth memory (hbm) needed for ai inference acceleration, delays production cycles by up to 20%. Furthermore, stringent data localization compliance rules fragment the market, complicating efforts to upgrade legacy enterprise infrastructure. The push toward server disaggregation offers flexibility but introduces new integration complexities for enterprises lacking specialized engineering resources.

Exclusive Technavio Analysis on Customer Landscape

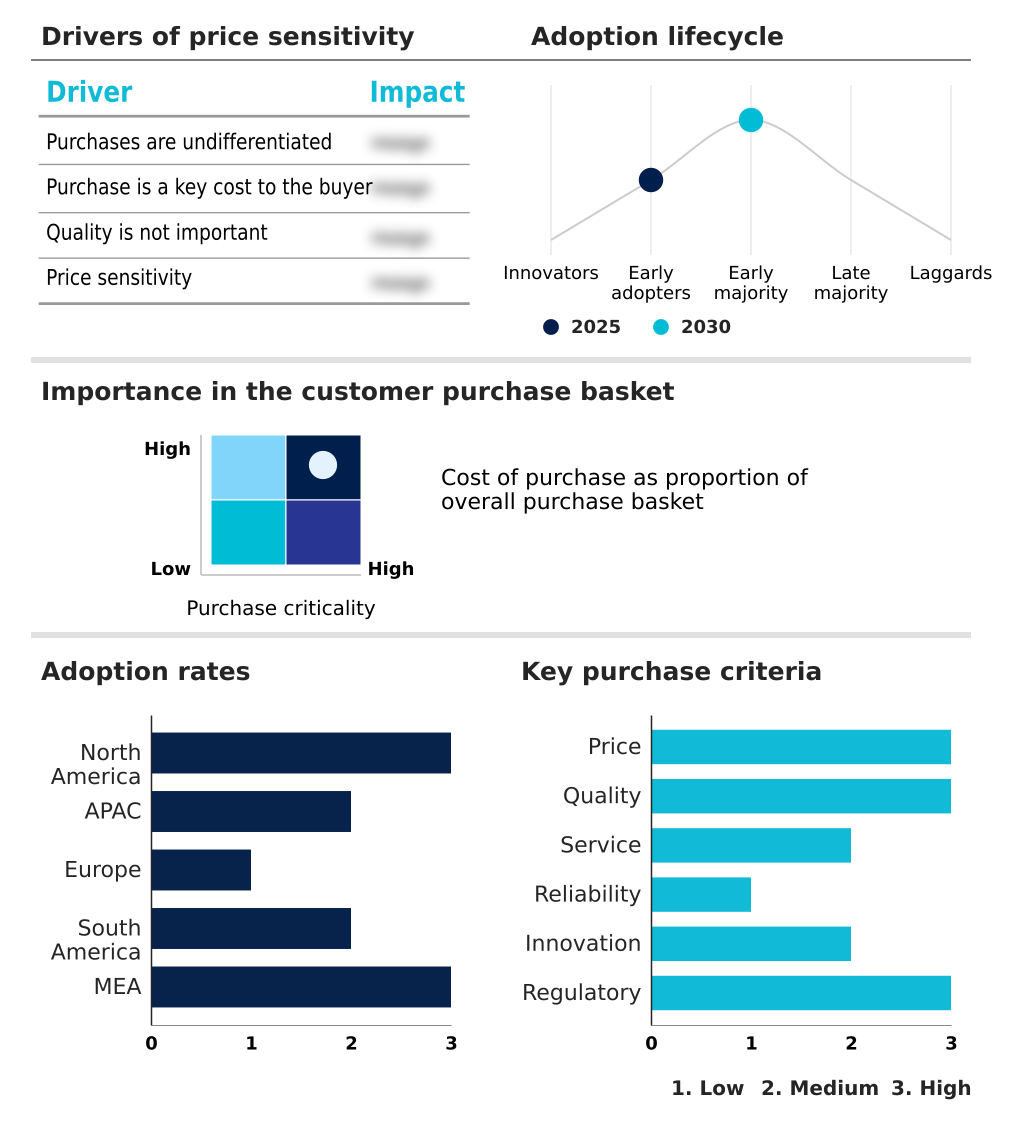
The data center server market forecasting report includes the adoption lifecycle of the market, covering from the innovator’s stage to the laggard’s stage. It focuses on adoption rates in different regions based on penetration. Furthermore, the data center server market report also includes key purchase criteria and drivers of price sensitivity to help companies evaluate and develop their market growth analysis strategies.

Customer Landscape of Data Center Server Industry

Competitive Landscape

Companies are implementing various strategies, such as strategic alliances, data center server market forecast, partnerships, mergers and acquisitions, geographical expansion, and product/service launches, to enhance their presence in the industry.

ASUSTeK Computer Inc. - Key offerings include rack servers, blade systems, and modular infrastructure designed for enterprise and cloud data centers.

The industry research and growth report includes detailed analyses of the competitive landscape of the market and information about key companies, including:

  • ASUSTeK Computer Inc.
  • Atos SE
  • Celestica Inc.
  • Cisco Systems Inc.
  • Dell Technologies Inc.
  • Fujitsu Ltd.
  • Gigabyte Technology Co. Ltd.
  • Hewlett Packard Enterprise Co.
  • Huawei Technologies Co. Ltd.
  • IBM Corp.
  • Inspur Group
  • Inventec Corp.
  • Lenovo Group Ltd.
  • NEC Corp.
  • New H3C Technologies
  • Oracle Corp.
  • Penguin Solutions Inc.
  • Quanta Computer Inc.
  • Super Micro Computer Inc.

Qualitative and quantitative analysis of companies has been conducted to help clients understand the wider business environment as well as the strengths and weaknesses of key industry players. Data is qualitatively analyzed to categorize companies as pure play, category-focused, industry-focused, and diversified; it is quantitatively analyzed to categorize companies as dominant, leading, strong, tentative, and weak.

Recent Development and News in Data center server market

  • In May, 2025, SealingTech introduced the AegisEdge MicroServer, a platform designed to provide cybersecurity and AI-driven edge computing for critical infrastructure.
  • In April, 2025, NVIDIA announced the commercial deployment of its Blackwell-based server racks, featuring liquid-cooled architecture to support unprecedented compute density for trillion-parameter AI model processing.
  • In January, 2025, Dell Technologies unveiled its IR7000 platform, integrating advanced liquid cooling manifolds to support high-density private AI clusters aligned with Open Compute Project standards.
  • In November, 2024, Intel Corp. launched its new Xeon processor series, emphasizing a balance between high multi-threaded performance and power efficiency to address thermal management constraints in modern server chassis designs.

Dive into Technavio’s robust research methodology, blending expert interviews, extensive data synthesis, and validated models for unparalleled Data Center Server Market insights. See full methodology.

Market Scope
Page number 303
Base year 2025
Historic period 2020-2024
Forecast period 2026-2030
Growth momentum & CAGR Accelerate at a CAGR of 21.2%
Market growth 2026-2030 USD 273569.9 million
Market structure Fragmented
YoY growth 2025-2026(%) 17.8%
Key countries US, Canada, Mexico, China, Japan, India, South Korea, Australia, Indonesia, Germany, UK, France, The Netherlands, Italy, Spain, Brazil, Chile, Colombia, Saudi Arabia, UAE, South Africa, Israel and Turkey
Competitive landscape Leading Companies, Market Positioning of Companies, Competitive Strategies, and Industry Risks

Request Free Sample

Research Analyst Overview

  • The data center server market is undergoing a fundamental architectural pivot defined by workload optimized systems and accelerated computing. The shift from general-purpose hardware to high density server racks equipped with specialized accelerators like graphics processing units (gpu) and application specific integrated circuits (asic) is reshaping capital expenditure.
  • This transition, essential for trillion parameter model processing using transformer based models, forces executive teams to rethink long-term facility planning, especially around thermal management strategies like direct to chip liquid cooling and immersion cooling. The rise of custom designed silicon for cloud native workloads is another critical factor. We see this driving a 30% improvement in performance-per-watt for certain applications.
  • Enterprises are also adopting modular data center units with arm based server architectures and microserver designs for edge deployments.
  • The entire ecosystem, from rack server configurations and blade server architecture to tower server form factor systems, is being influenced by open compute project (ocp) standards, software defined infrastructure, and the need for enhanced power usage effectiveness (pue) and security through hardware based trusted execution environments, silicon level encryption, trusted execution environments, and composable infrastructure.
  • This complex environment demands a focus on server disaggregation and thermal design power management, especially with the integration of high bandwidth memory (hbm) for ai inference acceleration.

What are the Key Data Covered in this Data Center Server Market Research and Growth Report?

  • What is the expected growth of the Data Center Server Market between 2026 and 2030?

    • USD 273.57 billion, at a CAGR of 21.2%

  • What segmentation does the market report cover?

    • The report is segmented by Application (Commercial server, and Industrial server), Type (Rack server, Blade server, Tower server, Microserver, and Open compute project server), End-user (Large enterprises, and SMEs) and Geography (North America, APAC, Europe, South America, Middle East and Africa)

  • Which regions are analyzed in the report?

    • North America, APAC, Europe, South America and Middle East and Africa

  • What are the key growth drivers and market challenges?

    • Exponential proliferation of generative AI and large scale model training , Escalating thermal management and power infrastructure constraints

  • Who are the major players in the Data Center Server Market?

    • ASUSTeK Computer Inc., Atos SE, Celestica Inc., Cisco Systems Inc., Dell Technologies Inc., Fujitsu Ltd., Gigabyte Technology Co. Ltd., Hewlett Packard Enterprise Co., Huawei Technologies Co. Ltd., IBM Corp., Inspur Group, Inventec Corp., Lenovo Group Ltd., NEC Corp., New H3C Technologies, Oracle Corp., Penguin Solutions Inc., Quanta Computer Inc. and Super Micro Computer Inc.

Market Research Insights

  • Market dynamics are shaped by a strategic push toward data center modernization and building ai ready infrastructure. The adoption of hybrid cloud models and multi cloud environments allows enterprises to balance scalability and control, with successful integrations reducing operational overhead by over 20%.
  • Sovereign cloud initiatives are driving demand for hardware that meets strict data localization compliance and digital sovereignty standards. At the edge, industrial iot servers and ruggedized server platforms enable real-time processing, cutting data transmission latency by up to 60%.
  • This accelerated digital transformation is also seen in the core data center, where high performance networking supports containerized applications across legacy enterprise infrastructure and new, efficient compute nodes.

We can help! Our analysts can customize this data center server market research report to meet your requirements.

Get in touch

1. Executive Summary

1.1 Market overview

Executive Summary - Chart on Market Overview
Executive Summary - Data Table on Market Overview
Executive Summary - Chart on Global Market Characteristics
Executive Summary - Chart on Market by Geography
Executive Summary - Chart on Market Segmentation by Application
Executive Summary - Chart on Market Segmentation by Type
Executive Summary - Chart on Market Segmentation by End-user
Executive Summary - Chart on Incremental Growth
Executive Summary - Data Table on Incremental Growth
Executive Summary - Chart on Company Market Positioning

2. Technavio Analysis

2.1 Analysis of price sensitivity, lifecycle, customer purchase basket, adoption rates, and purchase criteria

2.2 Criticality of inputs and Factors of differentiation

Chart on Overview on criticality of inputs and factors of differentiation

2.3 Factors of disruption

Chart on Overview on factors of disruption

2.4 Impact of drivers and challenges

Chart on Impact of drivers and challenges in 2025 and 2030

3. Market Landscape

3.1 Market ecosystem

Chart on Parent Market
Data Table on - Parent Market

3.2 Market characteristics

Chart on Market characteristics analysis

3.3 Value chain analysis

Chart on Value chain analysis

4. Market Sizing

4.1 Market definition

Data Table on Offerings of companies included in the market definition

4.2 Market segment analysis

Market segments

4.3 Market size 2025

4.4 Market outlook: Forecast for 2025-2030

Chart on Global - Market size and forecast 2025-2030 ($ million)
Data Table on Global - Market size and forecast 2025-2030 ($ million)
Chart on Global Market: Year-over-year growth 2025-2030 (%)
Data Table on Global Market: Year-over-year growth 2025-2030 (%)

5. Historic Market Size

5.1 Global Data Center Server Market 2020 - 2024

Historic Market Size - Data Table on Global Data Center Server Market 2020 - 2024 ($ million)

5.2 Application segment analysis 2020 - 2024

Historic Market Size - Application Segment 2020 - 2024 ($ million)

5.3 Type segment analysis 2020 - 2024

Historic Market Size - Type Segment 2020 - 2024 ($ million)

5.4 End-user segment analysis 2020 - 2024

Historic Market Size - End-user Segment 2020 - 2024 ($ million)

5.5 Geography segment analysis 2020 - 2024

Historic Market Size - Geography Segment 2020 - 2024 ($ million)

5.6 Country segment analysis 2020 - 2024

Historic Market Size - Country Segment 2020 - 2024 ($ million)

6. Qualitative Analysis

6.1 Impact of AI on global data center server market

6.2 Impact of geopolitical conflict on global data center server market

7. Five Forces Analysis

7.1 Five forces summary

Five forces analysis - Comparison between 2025 and 2030

7.2 Bargaining power of buyers

Bargaining power of buyers - Impact of key factors 2025 and 2030

7.3 Bargaining power of suppliers

Bargaining power of suppliers - Impact of key factors in 2025 and 2030

7.4 Threat of new entrants

Threat of new entrants - Impact of key factors in 2025 and 2030

7.5 Threat of substitutes

Threat of substitutes - Impact of key factors in 2025 and 2030

7.6 Threat of rivalry

Threat of rivalry - Impact of key factors in 2025 and 2030

7.7 Market condition

Chart on Market condition - Five forces 2025 and 2030

8. Market Segmentation by Application

8.1 Market segments

Chart on Application - Market share 2025-2030 (%)
Data Table on Application - Market share 2025-2030 (%)

8.2 Comparison by Application

Chart on Comparison by Application
Data Table on Comparison by Application

8.3 Commercial server - Market size and forecast 2025-2030

Chart on Commercial server - Market size and forecast 2025-2030 ($ million)
Data Table on Commercial server - Market size and forecast 2025-2030 ($ million)
Chart on Commercial server - Year-over-year growth 2025-2030 (%)
Data Table on Commercial server - Year-over-year growth 2025-2030 (%)

8.4 Industrial server - Market size and forecast 2025-2030

Chart on Industrial server - Market size and forecast 2025-2030 ($ million)
Data Table on Industrial server - Market size and forecast 2025-2030 ($ million)
Chart on Industrial server - Year-over-year growth 2025-2030 (%)
Data Table on Industrial server - Year-over-year growth 2025-2030 (%)

8.5 Market opportunity by Application

Market opportunity by Application ($ million)
Data Table on Market opportunity by Application ($ million)

9. Market Segmentation by Type

9.1 Market segments

Chart on Type - Market share 2025-2030 (%)
Data Table on Type - Market share 2025-2030 (%)

9.2 Comparison by Type

Chart on Comparison by Type
Data Table on Comparison by Type

9.3 Rack server - Market size and forecast 2025-2030

Chart on Rack server - Market size and forecast 2025-2030 ($ million)
Data Table on Rack server - Market size and forecast 2025-2030 ($ million)
Chart on Rack server - Year-over-year growth 2025-2030 (%)
Data Table on Rack server - Year-over-year growth 2025-2030 (%)

9.4 Blade server - Market size and forecast 2025-2030

Chart on Blade server - Market size and forecast 2025-2030 ($ million)
Data Table on Blade server - Market size and forecast 2025-2030 ($ million)
Chart on Blade server - Year-over-year growth 2025-2030 (%)
Data Table on Blade server - Year-over-year growth 2025-2030 (%)

9.5 Tower server - Market size and forecast 2025-2030

Chart on Tower server - Market size and forecast 2025-2030 ($ million)
Data Table on Tower server - Market size and forecast 2025-2030 ($ million)
Chart on Tower server - Year-over-year growth 2025-2030 (%)
Data Table on Tower server - Year-over-year growth 2025-2030 (%)

9.6 Microserver - Market size and forecast 2025-2030

Chart on Microserver - Market size and forecast 2025-2030 ($ million)
Data Table on Microserver - Market size and forecast 2025-2030 ($ million)
Chart on Microserver - Year-over-year growth 2025-2030 (%)
Data Table on Microserver - Year-over-year growth 2025-2030 (%)

9.7 Open compute project server - Market size and forecast 2025-2030

Chart on Open compute project server - Market size and forecast 2025-2030 ($ million)
Data Table on Open compute project server - Market size and forecast 2025-2030 ($ million)
Chart on Open compute project server - Year-over-year growth 2025-2030 (%)
Data Table on Open compute project server - Year-over-year growth 2025-2030 (%)

9.8 Market opportunity by Type

Market opportunity by Type ($ million)
Data Table on Market opportunity by Type ($ million)

10. Market Segmentation by End-user

10.1 Market segments

Chart on End-user - Market share 2025-2030 (%)
Data Table on End-user - Market share 2025-2030 (%)

10.2 Comparison by End-user

Chart on Comparison by End-user
Data Table on Comparison by End-user

10.3 Large enterprises - Market size and forecast 2025-2030

Chart on Large enterprises - Market size and forecast 2025-2030 ($ million)
Data Table on Large enterprises - Market size and forecast 2025-2030 ($ million)
Chart on Large enterprises - Year-over-year growth 2025-2030 (%)
Data Table on Large enterprises - Year-over-year growth 2025-2030 (%)

10.4 SMEs - Market size and forecast 2025-2030

Chart on SMEs - Market size and forecast 2025-2030 ($ million)
Data Table on SMEs - Market size and forecast 2025-2030 ($ million)
Chart on SMEs - Year-over-year growth 2025-2030 (%)
Data Table on SMEs - Year-over-year growth 2025-2030 (%)

10.5 Market opportunity by End-user

Market opportunity by End-user ($ million)
Data Table on Market opportunity by End-user ($ million)

11. Customer Landscape

11.1 Customer landscape overview

Analysis of price sensitivity, lifecycle, customer purchase basket, adoption rates, and purchase criteria

12. Geographic Landscape

12.1 Geographic segmentation

Chart on Market share by geography 2025-2030 (%)
Data Table on Market share by geography 2025-2030 (%)

12.2 Geographic comparison

Chart on Geographic comparison
Data Table on Geographic comparison

12.3 North America - Market size and forecast 2025-2030

Chart on North America - Market size and forecast 2025-2030 ($ million)
Data Table on North America - Market size and forecast 2025-2030 ($ million)
Chart on North America - Year-over-year growth 2025-2030 (%)
Data Table on North America - Year-over-year growth 2025-2030 (%)
Chart on Regional Comparison - North America
Data Table on Regional Comparison - North America

12.3.1 US - Market size and forecast 2025-2030

Chart on US - Market size and forecast 2025-2030 ($ million)
Data Table on US - Market size and forecast 2025-2030 ($ million)
Chart on US - Year-over-year growth 2025-2030 (%)
Data Table on US - Year-over-year growth 2025-2030 (%)

12.3.2 Canada - Market size and forecast 2025-2030

Chart on Canada - Market size and forecast 2025-2030 ($ million)
Data Table on Canada - Market size and forecast 2025-2030 ($ million)
Chart on Canada - Year-over-year growth 2025-2030 (%)
Data Table on Canada - Year-over-year growth 2025-2030 (%)

12.3.3 Mexico - Market size and forecast 2025-2030

Chart on Mexico - Market size and forecast 2025-2030 ($ million)
Data Table on Mexico - Market size and forecast 2025-2030 ($ million)
Chart on Mexico - Year-over-year growth 2025-2030 (%)
Data Table on Mexico - Year-over-year growth 2025-2030 (%)

12.4 APAC - Market size and forecast 2025-2030

Chart on APAC - Market size and forecast 2025-2030 ($ million)
Data Table on APAC - Market size and forecast 2025-2030 ($ million)
Chart on APAC - Year-over-year growth 2025-2030 (%)
Data Table on APAC - Year-over-year growth 2025-2030 (%)
Chart on Regional Comparison - APAC
Data Table on Regional Comparison - APAC

12.4.1 China - Market size and forecast 2025-2030

Chart on China - Market size and forecast 2025-2030 ($ million)
Data Table on China - Market size and forecast 2025-2030 ($ million)
Chart on China - Year-over-year growth 2025-2030 (%)
Data Table on China - Year-over-year growth 2025-2030 (%)

12.4.2 Japan - Market size and forecast 2025-2030

Chart on Japan - Market size and forecast 2025-2030 ($ million)
Data Table on Japan - Market size and forecast 2025-2030 ($ million)
Chart on Japan - Year-over-year growth 2025-2030 (%)
Data Table on Japan - Year-over-year growth 2025-2030 (%)

12.4.3 India - Market size and forecast 2025-2030

Chart on India - Market size and forecast 2025-2030 ($ million)
Data Table on India - Market size and forecast 2025-2030 ($ million)
Chart on India - Year-over-year growth 2025-2030 (%)
Data Table on India - Year-over-year growth 2025-2030 (%)

12.4.4 South Korea - Market size and forecast 2025-2030

Chart on South Korea - Market size and forecast 2025-2030 ($ million)
Data Table on South Korea - Market size and forecast 2025-2030 ($ million)
Chart on South Korea - Year-over-year growth 2025-2030 (%)
Data Table on South Korea - Year-over-year growth 2025-2030 (%)

12.4.5 Australia - Market size and forecast 2025-2030

Chart on Australia - Market size and forecast 2025-2030 ($ million)
Data Table on Australia - Market size and forecast 2025-2030 ($ million)
Chart on Australia - Year-over-year growth 2025-2030 (%)
Data Table on Australia - Year-over-year growth 2025-2030 (%)

12.4.6 Indonesia - Market size and forecast 2025-2030

Chart on Indonesia - Market size and forecast 2025-2030 ($ million)
Data Table on Indonesia - Market size and forecast 2025-2030 ($ million)
Chart on Indonesia - Year-over-year growth 2025-2030 (%)
Data Table on Indonesia - Year-over-year growth 2025-2030 (%)

12.5 Europe - Market size and forecast 2025-2030

Chart on Europe - Market size and forecast 2025-2030 ($ million)
Data Table on Europe - Market size and forecast 2025-2030 ($ million)
Chart on Europe - Year-over-year growth 2025-2030 (%)
Data Table on Europe - Year-over-year growth 2025-2030 (%)
Chart on Regional Comparison - Europe
Data Table on Regional Comparison - Europe

12.5.1 Germany - Market size and forecast 2025-2030

Chart on Germany - Market size and forecast 2025-2030 ($ million)
Data Table on Germany - Market size and forecast 2025-2030 ($ million)
Chart on Germany - Year-over-year growth 2025-2030 (%)
Data Table on Germany - Year-over-year growth 2025-2030 (%)

12.5.2 UK - Market size and forecast 2025-2030

Chart on UK - Market size and forecast 2025-2030 ($ million)
Data Table on UK - Market size and forecast 2025-2030 ($ million)
Chart on UK - Year-over-year growth 2025-2030 (%)
Data Table on UK - Year-over-year growth 2025-2030 (%)

12.5.3 France - Market size and forecast 2025-2030

Chart on France - Market size and forecast 2025-2030 ($ million)
Data Table on France - Market size and forecast 2025-2030 ($ million)
Chart on France - Year-over-year growth 2025-2030 (%)
Data Table on France - Year-over-year growth 2025-2030 (%)

12.5.4 The Netherlands - Market size and forecast 2025-2030

Chart on The Netherlands - Market size and forecast 2025-2030 ($ million)
Data Table on The Netherlands - Market size and forecast 2025-2030 ($ million)
Chart on The Netherlands - Year-over-year growth 2025-2030 (%)
Data Table on The Netherlands - Year-over-year growth 2025-2030 (%)

12.5.5 Italy - Market size and forecast 2025-2030

Chart on Italy - Market size and forecast 2025-2030 ($ million)
Data Table on Italy - Market size and forecast 2025-2030 ($ million)
Chart on Italy - Year-over-year growth 2025-2030 (%)
Data Table on Italy - Year-over-year growth 2025-2030 (%)

12.5.6 Spain - Market size and forecast 2025-2030

Chart on Spain - Market size and forecast 2025-2030 ($ million)
Data Table on Spain - Market size and forecast 2025-2030 ($ million)
Chart on Spain - Year-over-year growth 2025-2030 (%)
Data Table on Spain - Year-over-year growth 2025-2030 (%)

12.6 South America - Market size and forecast 2025-2030

Chart on South America - Market size and forecast 2025-2030 ($ million)
Data Table on South America - Market size and forecast 2025-2030 ($ million)
Chart on South America - Year-over-year growth 2025-2030 (%)
Data Table on South America - Year-over-year growth 2025-2030 (%)
Chart on Regional Comparison - South America
Data Table on Regional Comparison - South America

12.6.1 Brazil - Market size and forecast 2025-2030

Chart on Brazil - Market size and forecast 2025-2030 ($ million)
Data Table on Brazil - Market size and forecast 2025-2030 ($ million)
Chart on Brazil - Year-over-year growth 2025-2030 (%)
Data Table on Brazil - Year-over-year growth 2025-2030 (%)

12.6.2 Chile - Market size and forecast 2025-2030

Chart on Chile - Market size and forecast 2025-2030 ($ million)
Data Table on Chile - Market size and forecast 2025-2030 ($ million)
Chart on Chile - Year-over-year growth 2025-2030 (%)
Data Table on Chile - Year-over-year growth 2025-2030 (%)

12.6.3 Colombia - Market size and forecast 2025-2030

Chart on Colombia - Market size and forecast 2025-2030 ($ million)
Data Table on Colombia - Market size and forecast 2025-2030 ($ million)
Chart on Colombia - Year-over-year growth 2025-2030 (%)
Data Table on Colombia - Year-over-year growth 2025-2030 (%)

12.7 Middle East and Africa - Market size and forecast 2025-2030

Chart on Middle East and Africa - Market size and forecast 2025-2030 ($ million)
Data Table on Middle East and Africa - Market size and forecast 2025-2030 ($ million)
Chart on Middle East and Africa - Year-over-year growth 2025-2030 (%)
Data Table on Middle East and Africa - Year-over-year growth 2025-2030 (%)
Chart on Regional Comparison - Middle East and Africa
Data Table on Regional Comparison - Middle East and Africa

12.7.1 Saudi Arabia - Market size and forecast 2025-2030

Chart on Saudi Arabia - Market size and forecast 2025-2030 ($ million)
Data Table on Saudi Arabia - Market size and forecast 2025-2030 ($ million)
Chart on Saudi Arabia - Year-over-year growth 2025-2030 (%)
Data Table on Saudi Arabia - Year-over-year growth 2025-2030 (%)

12.7.2 UAE - Market size and forecast 2025-2030

Chart on UAE - Market size and forecast 2025-2030 ($ million)
Data Table on UAE - Market size and forecast 2025-2030 ($ million)
Chart on UAE - Year-over-year growth 2025-2030 (%)
Data Table on UAE - Year-over-year growth 2025-2030 (%)

12.7.3 South Africa - Market size and forecast 2025-2030

Chart on South Africa - Market size and forecast 2025-2030 ($ million)
Data Table on South Africa - Market size and forecast 2025-2030 ($ million)
Chart on South Africa - Year-over-year growth 2025-2030 (%)
Data Table on South Africa - Year-over-year growth 2025-2030 (%)

12.7.4 Israel - Market size and forecast 2025-2030

Chart on Israel - Market size and forecast 2025-2030 ($ million)
Data Table on Israel - Market size and forecast 2025-2030 ($ million)
Chart on Israel - Year-over-year growth 2025-2030 (%)
Data Table on Israel - Year-over-year growth 2025-2030 (%)

12.7.5 Turkey - Market size and forecast 2025-2030

Chart on Turkey - Market size and forecast 2025-2030 ($ million)
Data Table on Turkey - Market size and forecast 2025-2030 ($ million)
Chart on Turkey - Year-over-year growth 2025-2030 (%)
Data Table on Turkey - Year-over-year growth 2025-2030 (%)

12.8 Market opportunity by geography

Market opportunity by geography ($ million)
Data Tables on Market opportunity by geography ($ million)

13. Drivers, Challenges, and Opportunity

13.1 Market drivers

Exponential proliferation of generative AI and large scale model training
Accelerated digital transformation and rise of sovereign cloud initiatives
Expansion of edge computing and decentralization of compute resources

13.2 Market challenges

Escalating thermal management and power infrastructure constraints
Stringent regulatory environments and sustainability mandates
Supply chain volatility and advanced component scarcity

13.3 Impact of drivers and challenges

Impact of drivers and challenges in 2025 and 2030

13.4 Market opportunities

Shift toward liquid cooling integration and thermal intelligence
Proliferation of custom silicon and hyperscale self provisioning
Expansion of modular and edge optimized server architectures

14. Competitive Landscape

14.1 Overview

14.2

Overview on criticality of inputs and factors of differentiation

14.3 Landscape disruption

Overview on factors of disruption

14.4 Industry risks

Impact of key risks on business

15. Competitive Analysis

15.1 Companies profiled

Companies covered

15.2 Company ranking index

15.3 Market positioning of companies

Matrix on companies position and classification

15.4 ASUSTeK Computer Inc.

ASUSTeK Computer Inc. - Overview
ASUSTeK Computer Inc. - Business segments
ASUSTeK Computer Inc. - Key offerings
ASUSTeK Computer Inc. - Segment focus
SWOT

15.5 Atos SE

Atos SE - Overview
Atos SE - Business segments
Atos SE - Key offerings
Atos SE - Segment focus
SWOT

15.6 Cisco Systems Inc.

Cisco Systems Inc. - Overview
Cisco Systems Inc. - Business segments
Cisco Systems Inc. - Key news
Cisco Systems Inc. - Key offerings
Cisco Systems Inc. - Segment focus
SWOT

15.7 Dell Technologies Inc.

Dell Technologies Inc. - Overview
Dell Technologies Inc. - Business segments
Dell Technologies Inc. - Key news
Dell Technologies Inc. - Key offerings
Dell Technologies Inc. - Segment focus
SWOT

15.8 Fujitsu Ltd.

Fujitsu Ltd. - Overview
Fujitsu Ltd. - Business segments
Fujitsu Ltd. - Key offerings
Fujitsu Ltd. - Segment focus
SWOT

15.9 Gigabyte Technology Co. Ltd.

Gigabyte Technology Co. Ltd. - Overview
Gigabyte Technology Co. Ltd. - Business segments
Gigabyte Technology Co. Ltd. - Key offerings
Gigabyte Technology Co. Ltd. - Segment focus
SWOT

15.10 Hewlett Packard Enterprise Co.

Hewlett Packard Enterprise Co. - Overview
Hewlett Packard Enterprise Co. - Business segments
Hewlett Packard Enterprise Co. - Key news
Hewlett Packard Enterprise Co. - Key offerings
Hewlett Packard Enterprise Co. - Segment focus
SWOT

15.11 IBM Corp.

IBM Corp. - Overview
IBM Corp. - Business segments
IBM Corp. - Key news
IBM Corp. - Key offerings
IBM Corp. - Segment focus
SWOT

15.12 Inventec Corp.

Inventec Corp. - Overview
Inventec Corp. - Business segments
Inventec Corp. - Key offerings
Inventec Corp. - Segment focus
SWOT

15.13 Lenovo Group Ltd.

Lenovo Group Ltd. - Overview
Lenovo Group Ltd. - Business segments
Lenovo Group Ltd. - Key offerings
Lenovo Group Ltd. - Segment focus
SWOT

15.14 NEC Corp.

NEC Corp. - Overview
NEC Corp. - Business segments
NEC Corp. - Key offerings
NEC Corp. - Segment focus
SWOT

15.15 Oracle Corp.

Oracle Corp. - Overview
Oracle Corp. - Business segments
Oracle Corp. - Key news
Oracle Corp. - Key offerings
Oracle Corp. - Segment focus
SWOT

15.16 Penguin Solutions Inc.

Penguin Solutions Inc. - Overview
Penguin Solutions Inc. - Business segments
Penguin Solutions Inc. - Key news
Penguin Solutions Inc. - Key offerings
Penguin Solutions Inc. - Segment focus
SWOT

15.17 Quanta Computer Inc.

Quanta Computer Inc. - Overview
Quanta Computer Inc. - Business segments
Quanta Computer Inc. - Key offerings
Quanta Computer Inc. - Segment focus
SWOT

15.18 Super Micro Computer Inc.

Super Micro Computer Inc. - Overview
Super Micro Computer Inc. - Business segments
Super Micro Computer Inc. - Key offerings
Super Micro Computer Inc. - Segment focus
SWOT

16. Appendix

16.1 Scope of the report

Market definition
Objectives
Notes and caveats

16.2 Inclusions and exclusions checklist

Inclusions checklist
Exclusions checklist

16.3 Currency conversion rates for US$

16.4 Research methodology

16.5 Data procurement

Information sources

16.6 Data validation

16.7 Validation techniques employed for market sizing

16.8 Data synthesis

16.9 360 degree market analysis

16.10 List of abbreviations

Research Methodology

Technavio presents a detailed picture of the market by way of study, synthesis, and summation of data from multiple sources. The analysts have presented the various facets of the market with a particular focus on identifying the key industry influencers. The data thus presented is comprehensive, reliable, and the result of extensive research, both primary and secondary.

INFORMATION SOURCES

Primary sources

  • Manufacturers and suppliers
  • Channel partners
  • Industry experts
  • Strategic decision makers

Secondary sources

  • Industry journals and periodicals
  • Government data
  • Financial reports of key industry players
  • Historical data
  • Press releases

DATA ANALYSIS

Data Synthesis

  • Collation of data
  • Estimation of key figures
  • Analysis of derived insights

Data Validation

  • Triangulation with data models
  • Reference against proprietary databases
  • Corroboration with industry experts

REPORT WRITING

Qualitative

  • Market drivers
  • Market challenges
  • Market trends
  • Five forces analysis

Quantitative

  • Market size and forecast
  • Market segmentation
  • Geographical insights
  • Competitive landscape

Interested in this report?

Get your sample now to see our research methodology and insights!

Download Now

Frequently Asked Questions

Data Center Server market growth will increase by USD 273569.9 million during 2026-2030.

The Data Center Server market is expected to grow at a CAGR of 21.2% during 2026-2030.

Data Center Server market is segmented by Application (Commercial server, Industrial server) Type (Rack server, Blade server, Tower server, Microserver, Open compute project server) End-user (Large enterprises, SMEs)

ASUSTeK Computer Inc., Atos SE, Celestica Inc., Cisco Systems Inc., Dell Technologies Inc., Fujitsu Ltd., Gigabyte Technology Co. Ltd., Hewlett Packard Enterprise Co., Huawei Technologies Co. Ltd., IBM Corp., Inspur Group, Inventec Corp., Lenovo Group Ltd., NEC Corp., New H3C Technologies, Oracle Corp., Penguin Solutions Inc., Quanta Computer Inc., Super Micro Computer Inc. are a few of the key vendors in the Data Center Server market.

North America will register the highest growth rate of 34.6% among the other regions. Therefore, the Data Center Server market in North America is expected to garner significant business opportunities for the vendors during the forecast period.

US, Canada, Mexico, China, Japan, India, South Korea, Australia, Indonesia, Germany, UK, France, The Netherlands, Italy, Spain, Brazil, Chile, Colombia, Saudi Arabia, UAE, South Africa, Israel, Turkey

  • Exponential proliferation of generative AI and large scale model training is the driving factor this market.

The Data Center Server market vendors should focus on grabbing business opportunities from the Application segment as it accounted for the largest market share in the base year.
RIA - Research AI Assistant
Ask RIA