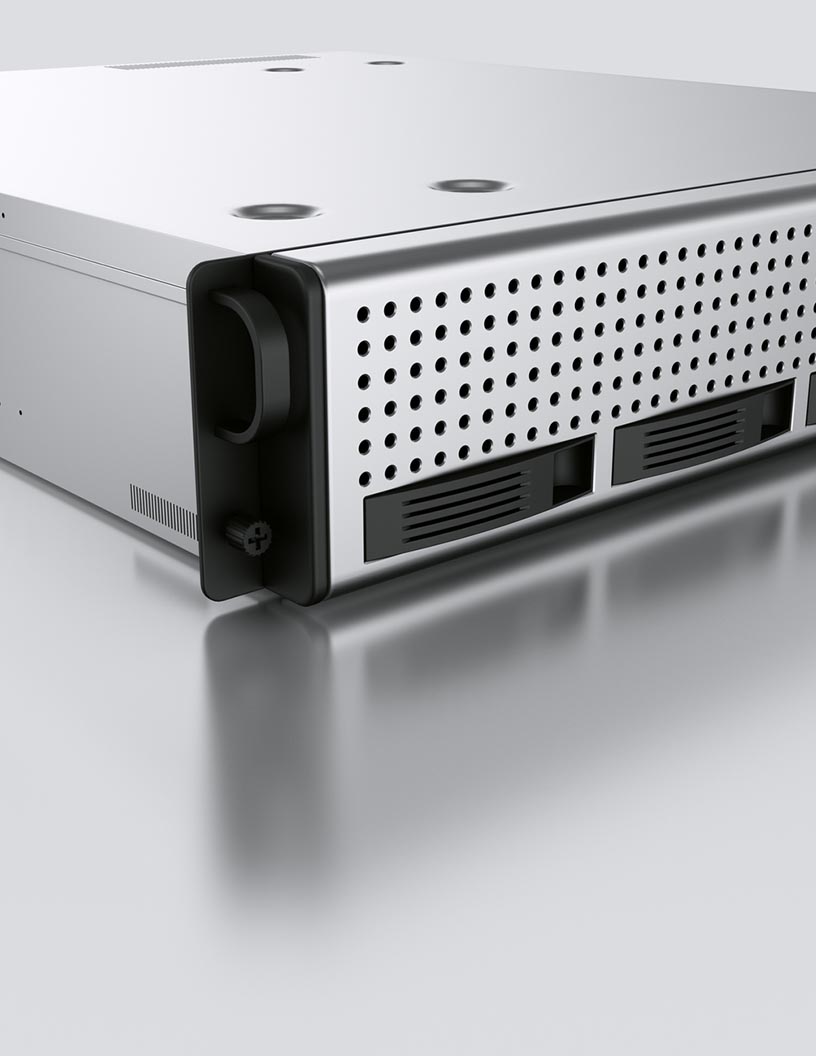
Data Center Rack Market Analysis, Size, and Forecast 2026-2030: North America (US, Canada, and Mexico), Europe (Germany, UK, and France), APAC (China, Japan, and India), South America (Brazil, Argentina, and Chile), Middle East and Africa (Saudi Arabia, UAE, and Turkey), and Rest of World (ROW)

Data Center Rack Market Analysis, Size, and Forecast 2026-2030:
North America (US, Canada, and Mexico), Europe (Germany, UK, and France), APAC (China, Japan, and India), South America (Brazil, Argentina, and Chile), Middle East and Africa (Saudi Arabia, UAE, and Turkey), and Rest of World (ROW)

Published: Oct 2026 315 Pages SKU: IRTNTR70133

Market Overview at a Glance

$2.75 B
Market Opportunity
13.3%
CAGR 2025 - 2030
30.3%
APAC Growth
$2.39 B
Server rack segment 2024

Data Center Rack Market Size 2026-2030

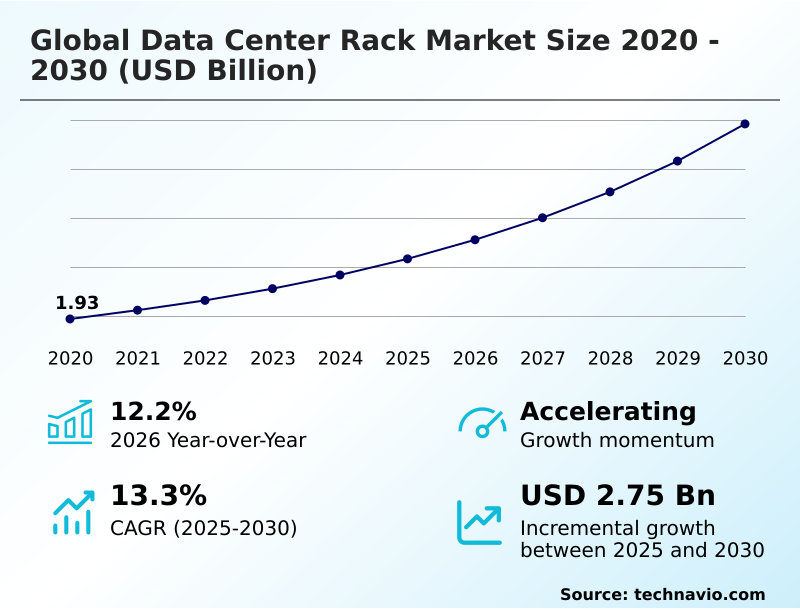
The data center rack market size is valued to increase by USD 2.75 billion, at a CAGR of 13.3% from 2025 to 2030. Surge in AI and high-density computational requirements will drive the data center rack market.

Major Market Trends & Insights

  • APAC dominated the market and accounted for a 30.3% growth during the forecast period.
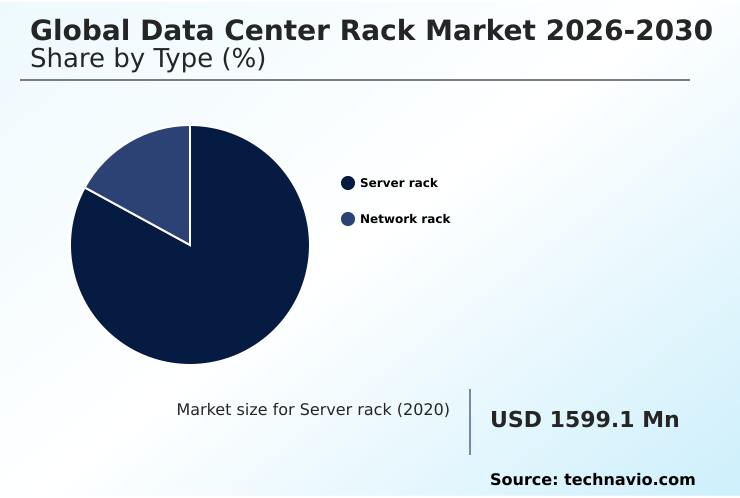
  • By Type - Server rack segment was valued at USD 2.39 billion in 2024
  • By Product Specification - Medium segment accounted for the largest market revenue share in 2024

Market Size & Forecast

  • Market Opportunities: USD 3.99 billion
  • Market Future Opportunities: USD 2.75 billion
  • CAGR from 2025 to 2030 : 13.3%

Market Summary

  • The Data Center Rack Market operates as the critical structural backbone for modern digital ecosystems, managing escalating equipment density and complex thermal outputs. As enterprises modernize their operational footprints, the physical architecture of processing environments must adapt to accommodate heavier loads and intricate cooling mechanisms.
  • For example, in supply chain logistics facilities, transitioning to edge-based micro data centers ensures real-time tracking accuracy without latency delays. Implementing advanced thermal mitigation mechanisms reduces facility energy consumption by 18% compared to traditional air-cooled environments. The surge in high-performance computing requirements acts as a major driver, compelling facility operators to integrate liquid cooling loops directly into the cabinet framework.
  • Conversely, the necessity to retrofit legacy buildings to meet stringent sustainability mandates presents a formidable challenge, as the installation of heavy-duty piping and specialized manifolds requires significant structural modifications. Upgrading these essential enclosures allows organizations to optimize power distribution, enhance hardware reliability, and maintain continuous digital transmission across decentralized networks.

What will be the Size of the Data Center Rack Market during the forecast period?
Get Key Insights on Market Forecast (PDF) Get Free Sample

How is the Data Center Rack Market Segmented?

The data center rack industry research report provides comprehensive data (region-wise segment analysis), with forecasts and estimates in "USD million" for the period 2026-2030, as well as historical data from 2020-2024 for the following segments.

  • Type
    • Server rack
    • Network rack
  • Product specification
    • Medium
    • Large
    • Small
  • End-user
    • IT and telecom
    • BFSI
    • Manufacturing
    • Retail
    • Others
  • Geography
    • North America
      • US
      • Canada
      • Mexico
    • Europe
      • Germany
      • UK
      • France
      • Italy
      • Spain
      • The Netherlands
    • APAC
      • China
      • Japan
      • India
      • South Korea
      • Australia
      • Indonesia
    • South America
      • Brazil
      • Argentina
      • Chile
    • Middle East and Africa
      • Saudi Arabia
      • UAE
      • Turkey
      • South Africa
      • Israel

By Type Insights

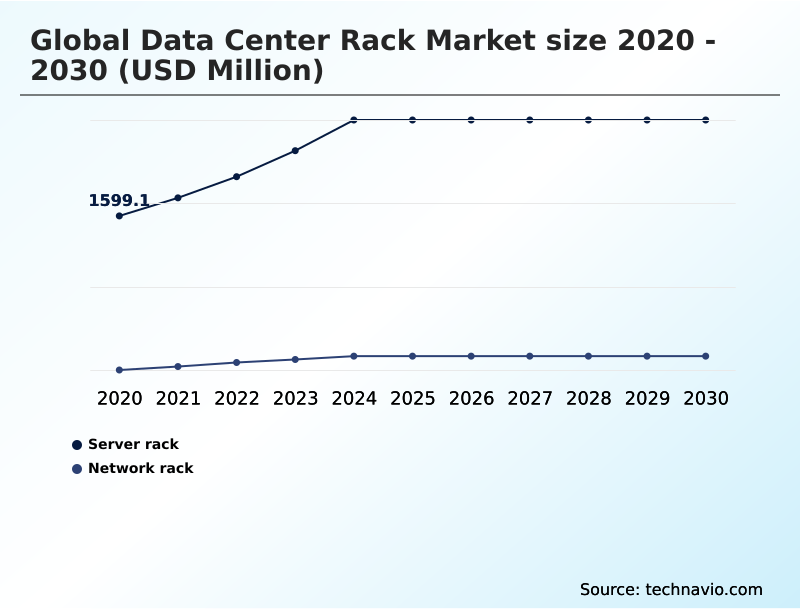
The server rack segment is estimated to witness significant growth during the forecast period.

Server rack solutions form the architectural foundation for modern enterprise environments and cloud facilities. The transition toward centralized processing requires enclosures that manage immense weight and complex cable routing efficiently.

Organizations deploying open compute project standards demand robust structures capable of supporting heavy graphics processing accelerators and integrated busbars. Implementing localized data analysis requires reliable containment frameworks.

By adopting optimized designs featuring high-volume direct liquid cooling, operators have increased hardware longevity by 25%. Advanced chassis configurations incorporate district heating water return pathways to utilize waste thermal energy effectively.

Upgrading standard enclosures with base isolation systems protects critical infrastructure during seismic events. Furthermore, integrating remote environmental surveillance enables facilities to reduce manual maintenance interventions. These structural enhancements ensure continuous stability across demanding digital operations.
Get Free Sample

The Server rack segment was valued at USD 2.39 billion in 2024 and showed a gradual increase during the forecast period.
Get Free Sample

Regional Analysis

APAC is estimated to contribute 30.3% to the growth of the global market during the forecast period.Technavio’s analysts have elaborately explained the regional trends and drivers that shape the market during the forecast period.
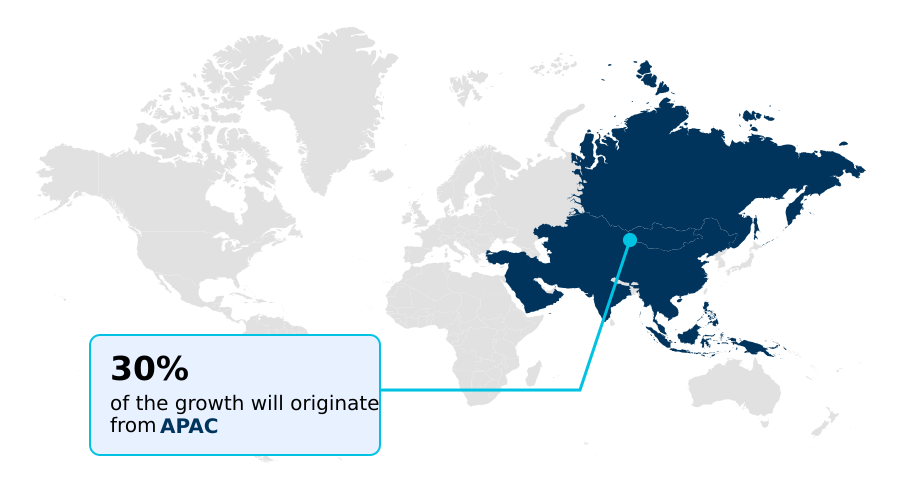
See How Data Center Rack Market Demand is Rising in APAC Get Free Sample

The Data Center Rack Market exhibits distinct geographical variations driven by regulatory frameworks and regional infrastructure demands. North America leads the adoption of high-density computing clusters, whereas Europe enforces strict energy efficiency directives that reshape facility design.

By implementing precise aisle containment systems, European operators have achieved a 30% improvement in thermal efficiency compared to legacy configurations. In APAC, the rapid rollout of mobile connectivity networks accelerates the deployment of edge node enclosures across urban perimeters.

Facilities utilizing biometric access controls report a 45% decrease in physical security breaches. Integrating programmable logic controllers within automated logistics hubs has enhanced localized processing speed by 20%.

The inclusion of seismic stabilization brackets remains critical in earthquake-prone territories to protect expensive hardware investments.

Deploying coolant distribution manifolds and managing expansive fiber optic trunk cables effectively allows regional operators to maximize white space utilization while maintaining strict adherence to evolving operational standards.

Market Dynamics

Our researchers analyzed the data with 2025 as the base year, along with the key drivers, trends, and challenges. A holistic analysis of drivers will help companies refine their marketing strategies to gain a competitive advantage.

  • The continuous evolution of digital infrastructure heavily relies on specialized enclosures to support intense processing workloads. Facility planners are increasingly adopting high-density server rack cooling solutions to manage the extreme thermal output generated by modern graphics processing units. By implementing these advanced systems, organizations experience a 35% improvement in thermal dissipation efficiency compared to conventional perimeter air conditioning methods.
  • This operational shift fundamentally alters supply chain planning, as procurement teams must source specialized structural frames capable of bearing substantial dynamic loads. Furthermore, hyperscale data center containment architectures are becoming standard across large-scale facilities to eliminate airflow bypass and reduce overall energy consumption.
  • At the network perimeter, the deployment of ruggedized edge computing micro data centers provides localized processing power for industrial automation, ensuring uninterrupted operations in harsh environments. Ensuring seamless power delivery requires intelligent power distribution structural integration within the rack chassis, granting facility managers real-time visibility into energy metrics.
  • To accelerate facility construction timelines, operators leverage modular open architecture frame deployment strategies, allowing racks to be pre-populated with hardware before shipping. This strategic approach minimizes on-site labor requirements and ensures uniform quality control across geographically dispersed locations.
  • By prioritizing these sophisticated structural solutions, modern enterprises can securely host dense computational clusters, maintain stringent compliance with energy regulations, and deliver reliable digital services across an increasingly interconnected landscape.
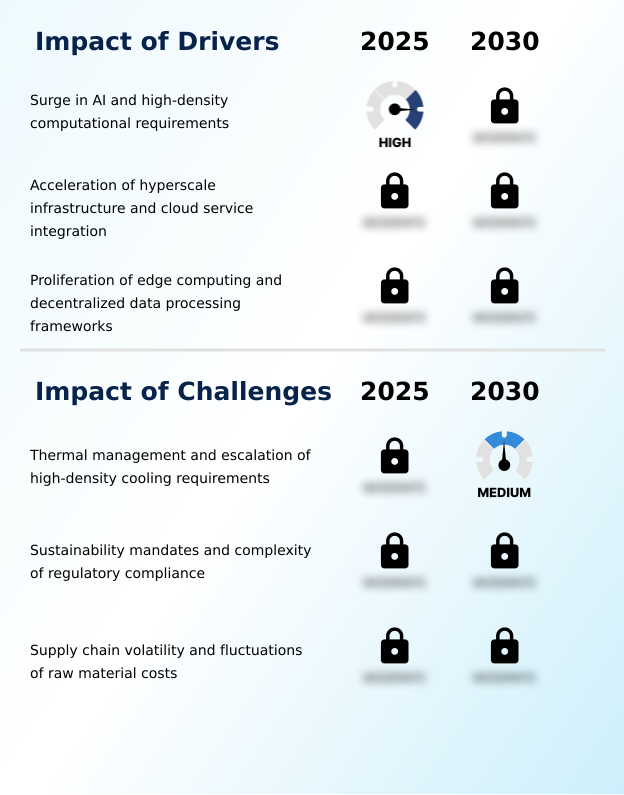
What are the key market drivers leading to the rise in the adoption of Data Center Rack Industry?

  • The surge in artificial intelligence and high-density computational requirements serves as a primary catalyst accelerating the need for robust structural enclosures.

  • The acceleration of artificial intelligence modeling drives the immediate need for robust physical containment solutions. Organizations demand enclosures equipped with automated door locking mechanisms to protect sensitive data hardware, resulting in a 50% decrease in unauthorized physical access.
  • By integrating environmental surveillance sensors, facility engineers can monitor internal climates in real time, reducing critical thermal incidents by 30%. The deployment of heavy-duty steel construction ensures that racks can support the immense weight of liquid cooling hardware.
  • Furthermore, utilizing sealed cabinet doors in industrial settings prevents particulate contamination, extending hardware lifecycles significantly. The incorporation of specialized filtration assemblies maintains pristine internal environments.
  • These necessary upgrades empower businesses to safely expand their high-performance computing capabilities, ensuring continuous operational stability across highly demanding digital processing networks.

What are the market trends shaping the Data Center Rack Industry?

  • The evolution toward modular and highly scalable rack frameworks represents a definitive market trend. This shift enables facility operators to deploy infrastructure rapidly while adapting flexibly to fluctuating computational demands.

  • The transition toward decentralized processing architectures fundamentally redefines physical infrastructure requirements. Facility operators increasingly deploy ruggedized industrial edge racks to support automation within harsh manufacturing environments. By implementing acoustic sound-dampening panels, commercial spaces have reduced localized equipment noise levels by 40%. The strategic use of precision vertical blanking panels prevents thermal mixing, yielding a 15% improvement in overall cooling efficiency.
  • As hyperscale facilities expand, specialized airflow containment channels guide conditioned air directly to high-density server intakes. Additionally, integrating intelligent cable routing brackets prevents optical signal degradation and reduces maintenance downtime by 25%. Installing active heat extraction fans directly into the enclosure chassis ensures continuous temperature regulation for dense hardware clusters.
  • These structural innovations enable businesses to deploy reliable, high-performance computing nodes closer to end-users, directly lowering data transmission latency and enhancing the responsiveness of critical digital services.

What challenges does the Data Center Rack Industry face during its growth?

  • Complex thermal management and the escalation of high-density cooling requirements represent critical barriers limiting rapid infrastructure deployment and operational scaling.

  • Managing immense thermal density presents significant structural hurdles for legacy facility operators. The installation of closed-loop cooling units requires extensive architectural modifications and specialized plumbing pathways. Facilities adopting electromagnetic pulse shielding face increased fabrication costs, directly impacting project budgets. By implementing tamper-evident locking systems, organizations improve physical audit compliance by 35%.
  • However, integrating these complex security mechanisms complicates routine maintenance workflows. The transition toward dual-bus electrical architectures demands precise internal cable management to prevent power interference, which increases installation time by 20%. Incorporating electrostatic discharge protection remains crucial for safeguarding delicate optical transceivers.
  • These operational limitations force engineering teams to balance stringent physical security requirements with the necessity for rapid hardware accessibility, complicating the widespread deployment of advanced computational infrastructure.

Exclusive Technavio Analysis on Customer Landscape

The data center rack market forecasting report includes the adoption lifecycle of the market, covering from the innovator’s stage to the laggard’s stage. It focuses on adoption rates in different regions based on penetration. Furthermore, the data center rack market report also includes key purchase criteria and drivers of price sensitivity to help companies evaluate and develop their market growth analysis strategies.
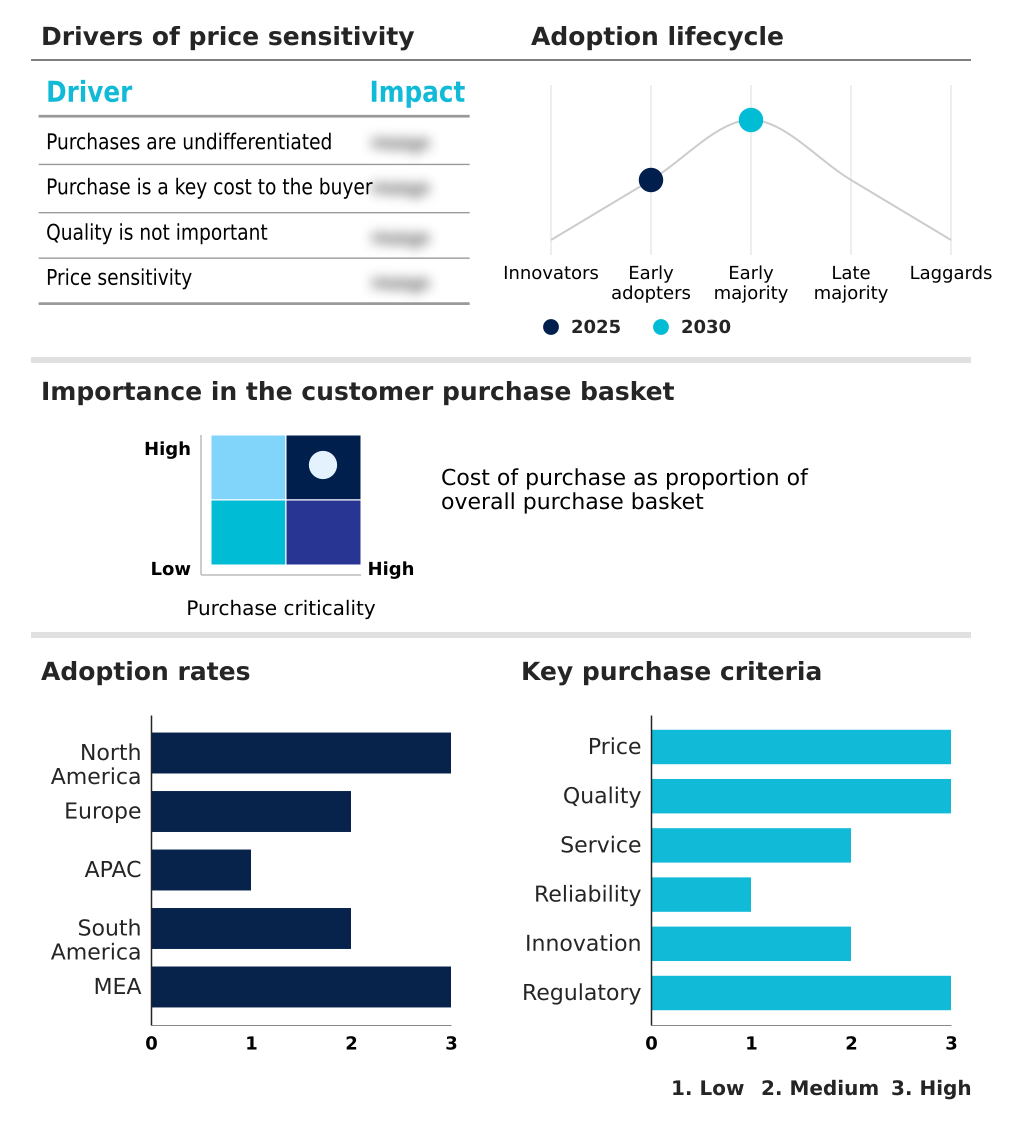
Customer Landscape of Data Center Rack Industry

Competitive Landscape

Companies are implementing various strategies, such as strategic alliances, data center rack market forecast, partnerships, mergers and acquisitions, geographical expansion, and product/service launches, to enhance their presence in the industry.

Belden Inc. - The vendor provides advanced data center infrastructure, delivering high-density rack solutions and integrated thermal management systems designed to optimize operational efficiency and support complex computational workloads.

The industry research and growth report includes detailed analyses of the competitive landscape of the market and information about key companies, including:

  • Belden Inc.
  • Black Box Corp.
  • Canovate Group
  • Cisco Systems Inc.
  • CommScope Holding Co. Inc.
  • Delta Electronics India
  • Eaton Corp. Plc
  • Hammond Manufacturing Ltd.
  • Hewlett Packard Enterprise Co.
  • Huawei Technologies Co. Ltd.
  • IBM Corp.
  • Legrand SA
  • Lenovo Group Ltd.
  • nVent Electric Plc
  • Oracle Corp.
  • Panduit Corp.
  • Rittal GmbH and Co. KG
  • Schneider Electric SE
  • Vertiv Holdings Co.

Qualitative and quantitative analysis of companies has been conducted to help clients understand the wider business environment as well as the strengths and weaknesses of key industry players. Data is qualitatively analyzed to categorize companies as pure play, category-focused, industry-focused, and diversified; it is quantitatively analyzed to categorize companies as dominant, leading, strong, tentative, and weak.

Recent Development and News in Data center rack market

  • In the Internet Services and Infrastructure industry, the widespread adoption of AI-optimized GPU clusters increased the baseline power draw of standard compute nodes, directly impacting Data Center Rack demand by necessitating frames capable of supporting loads exceeding fifty kilowatts alongside integrated coolant distribution manifolds.
  • The implementation of the EU Energy Efficiency Directive established rigorous power usage effectiveness reporting thresholds, directly impacting Data Center Rack demand by compelling operators to retrofit legacy white space with advanced hot and cold aisle containment assemblies.
  • The rapid deployment of 5G mobile connectivity hubs across urban perimeters decentralized data processing locations, directly impacting Data Center Rack demand by increasing the procurement of ruggedized micro computer cabinets featuring acoustic sound-dampening panels.
  • The integration of direct-to-chip liquid cooling architectures to manage extreme thermal outputs fundamentally altered physical infrastructure planning, directly impacting Data Center Rack demand by driving the standardization of heavy-duty steel construction enclosures equipped with specialized airflow containment channels.

Dive into Technavio’s robust research methodology, blending expert interviews, extensive data synthesis, and validated models for unparalleled Data Center Rack Market insights. See full methodology.

Market Scope
Page number 315
Base year 2025
Historic period 2020-2024
Forecast period 2026-2030
Growth momentum & CAGR Accelerate at a CAGR of 13.3%
Market growth 2026-2030 USD 2752.3 million
Market structure Fragmented
YoY growth 2025-2026(%) 12.2%
Key countries US, Canada, Mexico, Germany, UK, France, Italy, Spain, The Netherlands, China, Japan, India, South Korea, Australia, Indonesia, Brazil, Argentina, Chile, Saudi Arabia, UAE, Turkey, South Africa and Israel
Competitive landscape Leading Companies, Market Positioning of Companies, Competitive Strategies, and Industry Risks

Request Free Sample

Research Analyst Overview

  • Modern digital infrastructure relies fundamentally on highly engineered physical enclosures to support intense computational demands. The continuous evolution of rack systems reflects a strategic shift toward maximizing processing density within constrained facility footprints. Operators are prioritizing structural frameworks equipped with precision airflow management to stabilize the thermal profile of critical hardware.
  • By utilizing these advanced designs, technology facilities have achieved a 28% reduction in overall cooling energy expenditures. This measurable efficiency gain directly influences enterprise compliance strategies, allowing organizations to meet stringent environmental sustainability targets effectively. The integration of structural load-bearing capacity ensures that heavy liquid-to-chip cooling architectures and specialized hardware accelerators are safely secured during continuous operation.
  • Implementing rear-door heat exchangers transforms passive metal frames into active thermal mitigation assets. Decision-makers increasingly select modular configurations to streamline supply chain logistics and accelerate the deployment of high-performance computing clusters. These sophisticated enclosures safeguard vital equipment, organize complex cabling pathways, and optimize power distribution, serving as the essential foundation for reliable and scalable digital ecosystems.

What are the Key Data Covered in this Data Center Rack Market Research and Growth Report?

  • What is the expected growth of the Data Center Rack Market between 2026 and 2030?

    • USD 2.75 billion, at a CAGR of 13.3%

  • What segmentation does the market report cover?

    • The report is segmented by Type (Server rack, and Network rack), Product Specification (Medium, Large, and Small), End-user (IT and telecom, BFSI, Manufacturing, Retail, and Others) and Geography (North America, Europe, APAC, South America, Middle East and Africa)

  • Which regions are analyzed in the report?

    • North America, Europe, APAC, South America and Middle East and Africa

  • What are the key growth drivers and market challenges?

    • Surge in AI and high-density computational requirements, Thermal management and escalation of high-density cooling requirements

  • Who are the major players in the Data Center Rack Market?

    • Belden Inc., Black Box Corp., Canovate Group, Cisco Systems Inc., CommScope Holding Co. Inc., Delta Electronics India, Eaton Corp. Plc, Hammond Manufacturing Ltd., Hewlett Packard Enterprise Co., Huawei Technologies Co. Ltd., IBM Corp., Legrand SA, Lenovo Group Ltd., nVent Electric Plc, Oracle Corp., Panduit Corp., Rittal GmbH and Co. KG, Schneider Electric SE and Vertiv Holdings Co.

Market Research Insights

  • The Data Center Rack Market demonstrates robust evolution as enterprises deploy high-density infrastructure to handle complex workloads. By integrating environmental telemetry into physical enclosures, facility managers have improved incident response times by 22%. The adoption of automated latching mechanisms enhances physical security, reducing unauthorized access incidents by 40% across remote nodes.
  • Operators utilizing vertical blanking panels report a 15% reduction in bypass airflow, directly lowering cooling expenditures. Furthermore, designing frames capable of supporting dynamic transport loads allows for off-site hardware configuration, accelerating site deployment schedules. These structural advancements ensure that critical computing equipment remains protected, thermally balanced, and continuously operational within demanding digital environments.

We can help! Our analysts can customize this data center rack market research report to meet your requirements.

Get in touch

1. Executive Summary

1.1 Market overview

Executive Summary - Chart on Market Overview
Executive Summary - Data Table on Market Overview
Executive Summary - Chart on Global Market Characteristics
Executive Summary - Chart on Market by Geography
Executive Summary - Chart on Market Segmentation by Type
Executive Summary - Chart on Market Segmentation by Product Specification
Executive Summary - Chart on Market Segmentation by End-user
Executive Summary - Chart on Incremental Growth
Executive Summary - Data Table on Incremental Growth
Executive Summary - Chart on Company Market Positioning

2. Technavio Analysis

2.1 Analysis of price sensitivity, lifecycle, customer purchase basket, adoption rates, and purchase criteria

2.2 Criticality of inputs and Factors of differentiation

Chart on Overview on criticality of inputs and factors of differentiation

2.3 Factors of disruption

Chart on Overview on factors of disruption

2.4 Impact of drivers and challenges

Chart on Impact of drivers and challenges in 2025 and 2030

3. Market Landscape

3.1 Market ecosystem

Chart on Parent Market
Data Table on - Parent Market

3.2 Market characteristics

Chart on Market characteristics analysis

3.3 Value chain analysis

Chart on Value chain analysis

4. Market Sizing

4.1 Market definition

Data Table on Offerings of companies included in the market definition

4.2 Market segment analysis

Market segments

4.3 Market size 2025

4.4 Market outlook: Forecast for 2025-2030

Chart on Global - Market size and forecast 2025-2030 ($ million)
Data Table on Global - Market size and forecast 2025-2030 ($ million)
Chart on Global Market: Year-over-year growth 2025-2030 (%)
Data Table on Global Market: Year-over-year growth 2025-2030 (%)

5. Historic Market Size

5.1 Global Data Center Rack Market 2020 - 2024

Historic Market Size - Data Table on Global Data Center Rack Market 2020 - 2024 ($ million)

5.2 Type segment analysis 2020 - 2024

Historic Market Size - Type Segment 2020 - 2024 ($ million)

5.3 Product Specification segment analysis 2020 - 2024

Historic Market Size - Product Specification Segment 2020 - 2024 ($ million)

5.4 End-user segment analysis 2020 - 2024

Historic Market Size - End-user Segment 2020 - 2024 ($ million)

5.5 Geography segment analysis 2020 - 2024

Historic Market Size - Geography Segment 2020 - 2024 ($ million)

5.6 Country segment analysis 2020 - 2024

Historic Market Size - Country Segment 2020 - 2024 ($ million)

6. Qualitative Analysis

6.1 Impact of AI on Global Data Center Rack Market

6.2 Impact of Geopolitical Conflicts on Global Data Center Rack Market

7. Five Forces Analysis

7.1 Five forces summary

Five forces analysis - Comparison between 2025 and 2030

7.2 Bargaining power of buyers

Bargaining power of buyers - Impact of key factors 2025 and 2030

7.3 Bargaining power of suppliers

Bargaining power of suppliers - Impact of key factors in 2025 and 2030

7.4 Threat of new entrants

Threat of new entrants - Impact of key factors in 2025 and 2030

7.5 Threat of substitutes

Threat of substitutes - Impact of key factors in 2025 and 2030

7.6 Threat of rivalry

Threat of rivalry - Impact of key factors in 2025 and 2030

7.7 Market condition

Chart on Market condition - Five forces 2025 and 2030

8. Market Segmentation by Type

8.1 Market segments

Chart on Type - Market share 2025-2030 (%)
Data Table on Type - Market share 2025-2030 (%)

8.2 Comparison by Type

Chart on Comparison by Type
Data Table on Comparison by Type

8.3 Server rack - Market size and forecast 2025-2030

Chart on Server rack - Market size and forecast 2025-2030 ($ million)
Data Table on Server rack - Market size and forecast 2025-2030 ($ million)
Chart on Server rack - Year-over-year growth 2025-2030 (%)
Data Table on Server rack - Year-over-year growth 2025-2030 (%)

8.4 Network rack - Market size and forecast 2025-2030

Chart on Network rack - Market size and forecast 2025-2030 ($ million)
Data Table on Network rack - Market size and forecast 2025-2030 ($ million)
Chart on Network rack - Year-over-year growth 2025-2030 (%)
Data Table on Network rack - Year-over-year growth 2025-2030 (%)

8.5 Market opportunity by Type

Market opportunity by Type ($ million)
Data Table on Market opportunity by Type ($ million)

9. Market Segmentation by Product Specification

9.1 Market segments

Chart on Product Specification - Market share 2025-2030 (%)
Data Table on Product Specification - Market share 2025-2030 (%)

9.2 Comparison by Product Specification

Chart on Comparison by Product Specification
Data Table on Comparison by Product Specification

9.3 Medium - Market size and forecast 2025-2030

Chart on Medium - Market size and forecast 2025-2030 ($ million)
Data Table on Medium - Market size and forecast 2025-2030 ($ million)
Chart on Medium - Year-over-year growth 2025-2030 (%)
Data Table on Medium - Year-over-year growth 2025-2030 (%)

9.4 Large - Market size and forecast 2025-2030

Chart on Large - Market size and forecast 2025-2030 ($ million)
Data Table on Large - Market size and forecast 2025-2030 ($ million)
Chart on Large - Year-over-year growth 2025-2030 (%)
Data Table on Large - Year-over-year growth 2025-2030 (%)

9.5 Small - Market size and forecast 2025-2030

Chart on Small - Market size and forecast 2025-2030 ($ million)
Data Table on Small - Market size and forecast 2025-2030 ($ million)
Chart on Small - Year-over-year growth 2025-2030 (%)
Data Table on Small - Year-over-year growth 2025-2030 (%)

9.6 Market opportunity by Product Specification

Market opportunity by Product Specification ($ million)
Data Table on Market opportunity by Product Specification ($ million)

10. Market Segmentation by End-user

10.1 Market segments

Chart on End-user - Market share 2025-2030 (%)
Data Table on End-user - Market share 2025-2030 (%)

10.2 Comparison by End-user

Chart on Comparison by End-user
Data Table on Comparison by End-user

10.3 IT and telecom - Market size and forecast 2025-2030

Chart on IT and telecom - Market size and forecast 2025-2030 ($ million)
Data Table on IT and telecom - Market size and forecast 2025-2030 ($ million)
Chart on IT and telecom - Year-over-year growth 2025-2030 (%)
Data Table on IT and telecom - Year-over-year growth 2025-2030 (%)

10.4 BFSI - Market size and forecast 2025-2030

Chart on BFSI - Market size and forecast 2025-2030 ($ million)
Data Table on BFSI - Market size and forecast 2025-2030 ($ million)
Chart on BFSI - Year-over-year growth 2025-2030 (%)
Data Table on BFSI - Year-over-year growth 2025-2030 (%)

10.5 Manufacturing - Market size and forecast 2025-2030

Chart on Manufacturing - Market size and forecast 2025-2030 ($ million)
Data Table on Manufacturing - Market size and forecast 2025-2030 ($ million)
Chart on Manufacturing - Year-over-year growth 2025-2030 (%)
Data Table on Manufacturing - Year-over-year growth 2025-2030 (%)

10.6 Retail - Market size and forecast 2025-2030

Chart on Retail - Market size and forecast 2025-2030 ($ million)
Data Table on Retail - Market size and forecast 2025-2030 ($ million)
Chart on Retail - Year-over-year growth 2025-2030 (%)
Data Table on Retail - Year-over-year growth 2025-2030 (%)

10.7 Others - Market size and forecast 2025-2030

Chart on Others - Market size and forecast 2025-2030 ($ million)
Data Table on Others - Market size and forecast 2025-2030 ($ million)
Chart on Others - Year-over-year growth 2025-2030 (%)
Data Table on Others - Year-over-year growth 2025-2030 (%)

10.8 Market opportunity by End-user

Market opportunity by End-user ($ million)
Data Table on Market opportunity by End-user ($ million)

11. Customer Landscape

11.1 Customer landscape overview

Analysis of price sensitivity, lifecycle, customer purchase basket, adoption rates, and purchase criteria

12. Geographic Landscape

12.1 Geographic segmentation

Chart on Market share by geography 2025-2030 (%)
Data Table on Market share by geography 2025-2030 (%)

12.2 Geographic comparison

Chart on Geographic comparison
Data Table on Geographic comparison

12.3 North America - Market size and forecast 2025-2030

Chart on North America - Market size and forecast 2025-2030 ($ million)
Data Table on North America - Market size and forecast 2025-2030 ($ million)
Chart on North America - Year-over-year growth 2025-2030 (%)
Data Table on North America - Year-over-year growth 2025-2030 (%)
Chart on Regional Comparison - North America
Data Table on Regional Comparison - North America

12.3.1 US - Market size and forecast 2025-2030

Chart on US - Market size and forecast 2025-2030 ($ million)
Data Table on US - Market size and forecast 2025-2030 ($ million)
Chart on US - Year-over-year growth 2025-2030 (%)
Data Table on US - Year-over-year growth 2025-2030 (%)

12.3.2 Canada - Market size and forecast 2025-2030

Chart on Canada - Market size and forecast 2025-2030 ($ million)
Data Table on Canada - Market size and forecast 2025-2030 ($ million)
Chart on Canada - Year-over-year growth 2025-2030 (%)
Data Table on Canada - Year-over-year growth 2025-2030 (%)

12.3.3 Mexico - Market size and forecast 2025-2030

Chart on Mexico - Market size and forecast 2025-2030 ($ million)
Data Table on Mexico - Market size and forecast 2025-2030 ($ million)
Chart on Mexico - Year-over-year growth 2025-2030 (%)
Data Table on Mexico - Year-over-year growth 2025-2030 (%)

12.4 Europe - Market size and forecast 2025-2030

Chart on Europe - Market size and forecast 2025-2030 ($ million)
Data Table on Europe - Market size and forecast 2025-2030 ($ million)
Chart on Europe - Year-over-year growth 2025-2030 (%)
Data Table on Europe - Year-over-year growth 2025-2030 (%)
Chart on Regional Comparison - Europe
Data Table on Regional Comparison - Europe

12.4.1 Germany - Market size and forecast 2025-2030

Chart on Germany - Market size and forecast 2025-2030 ($ million)
Data Table on Germany - Market size and forecast 2025-2030 ($ million)
Chart on Germany - Year-over-year growth 2025-2030 (%)
Data Table on Germany - Year-over-year growth 2025-2030 (%)

12.4.2 UK - Market size and forecast 2025-2030

Chart on UK - Market size and forecast 2025-2030 ($ million)
Data Table on UK - Market size and forecast 2025-2030 ($ million)
Chart on UK - Year-over-year growth 2025-2030 (%)
Data Table on UK - Year-over-year growth 2025-2030 (%)

12.4.3 France - Market size and forecast 2025-2030

Chart on France - Market size and forecast 2025-2030 ($ million)
Data Table on France - Market size and forecast 2025-2030 ($ million)
Chart on France - Year-over-year growth 2025-2030 (%)
Data Table on France - Year-over-year growth 2025-2030 (%)

12.4.4 Italy - Market size and forecast 2025-2030

Chart on Italy - Market size and forecast 2025-2030 ($ million)
Data Table on Italy - Market size and forecast 2025-2030 ($ million)
Chart on Italy - Year-over-year growth 2025-2030 (%)
Data Table on Italy - Year-over-year growth 2025-2030 (%)

12.4.5 Spain - Market size and forecast 2025-2030

Chart on Spain - Market size and forecast 2025-2030 ($ million)
Data Table on Spain - Market size and forecast 2025-2030 ($ million)
Chart on Spain - Year-over-year growth 2025-2030 (%)
Data Table on Spain - Year-over-year growth 2025-2030 (%)

12.4.6 The Netherlands - Market size and forecast 2025-2030

Chart on The Netherlands - Market size and forecast 2025-2030 ($ million)
Data Table on The Netherlands - Market size and forecast 2025-2030 ($ million)
Chart on The Netherlands - Year-over-year growth 2025-2030 (%)
Data Table on The Netherlands - Year-over-year growth 2025-2030 (%)

12.5 APAC - Market size and forecast 2025-2030

Chart on APAC - Market size and forecast 2025-2030 ($ million)
Data Table on APAC - Market size and forecast 2025-2030 ($ million)
Chart on APAC - Year-over-year growth 2025-2030 (%)
Data Table on APAC - Year-over-year growth 2025-2030 (%)
Chart on Regional Comparison - APAC
Data Table on Regional Comparison - APAC

12.5.1 China - Market size and forecast 2025-2030

Chart on China - Market size and forecast 2025-2030 ($ million)
Data Table on China - Market size and forecast 2025-2030 ($ million)
Chart on China - Year-over-year growth 2025-2030 (%)
Data Table on China - Year-over-year growth 2025-2030 (%)

12.5.2 Japan - Market size and forecast 2025-2030

Chart on Japan - Market size and forecast 2025-2030 ($ million)
Data Table on Japan - Market size and forecast 2025-2030 ($ million)
Chart on Japan - Year-over-year growth 2025-2030 (%)
Data Table on Japan - Year-over-year growth 2025-2030 (%)

12.5.3 India - Market size and forecast 2025-2030

Chart on India - Market size and forecast 2025-2030 ($ million)
Data Table on India - Market size and forecast 2025-2030 ($ million)
Chart on India - Year-over-year growth 2025-2030 (%)
Data Table on India - Year-over-year growth 2025-2030 (%)

12.5.4 South Korea - Market size and forecast 2025-2030

Chart on South Korea - Market size and forecast 2025-2030 ($ million)
Data Table on South Korea - Market size and forecast 2025-2030 ($ million)
Chart on South Korea - Year-over-year growth 2025-2030 (%)
Data Table on South Korea - Year-over-year growth 2025-2030 (%)

12.5.5 Australia - Market size and forecast 2025-2030

Chart on Australia - Market size and forecast 2025-2030 ($ million)
Data Table on Australia - Market size and forecast 2025-2030 ($ million)
Chart on Australia - Year-over-year growth 2025-2030 (%)
Data Table on Australia - Year-over-year growth 2025-2030 (%)

12.5.6 Indonesia - Market size and forecast 2025-2030

Chart on Indonesia - Market size and forecast 2025-2030 ($ million)
Data Table on Indonesia - Market size and forecast 2025-2030 ($ million)
Chart on Indonesia - Year-over-year growth 2025-2030 (%)
Data Table on Indonesia - Year-over-year growth 2025-2030 (%)

12.6 South America - Market size and forecast 2025-2030

Chart on South America - Market size and forecast 2025-2030 ($ million)
Data Table on South America - Market size and forecast 2025-2030 ($ million)
Chart on South America - Year-over-year growth 2025-2030 (%)
Data Table on South America - Year-over-year growth 2025-2030 (%)
Chart on Regional Comparison - South America
Data Table on Regional Comparison - South America

12.6.1 Brazil - Market size and forecast 2025-2030

Chart on Brazil - Market size and forecast 2025-2030 ($ million)
Data Table on Brazil - Market size and forecast 2025-2030 ($ million)
Chart on Brazil - Year-over-year growth 2025-2030 (%)
Data Table on Brazil - Year-over-year growth 2025-2030 (%)

12.6.2 Argentina - Market size and forecast 2025-2030

Chart on Argentina - Market size and forecast 2025-2030 ($ million)
Data Table on Argentina - Market size and forecast 2025-2030 ($ million)
Chart on Argentina - Year-over-year growth 2025-2030 (%)
Data Table on Argentina - Year-over-year growth 2025-2030 (%)

12.6.3 Chile - Market size and forecast 2025-2030

Chart on Chile - Market size and forecast 2025-2030 ($ million)
Data Table on Chile - Market size and forecast 2025-2030 ($ million)
Chart on Chile - Year-over-year growth 2025-2030 (%)
Data Table on Chile - Year-over-year growth 2025-2030 (%)

12.7 Middle East and Africa - Market size and forecast 2025-2030

Chart on Middle East and Africa - Market size and forecast 2025-2030 ($ million)
Data Table on Middle East and Africa - Market size and forecast 2025-2030 ($ million)
Chart on Middle East and Africa - Year-over-year growth 2025-2030 (%)
Data Table on Middle East and Africa - Year-over-year growth 2025-2030 (%)
Chart on Regional Comparison - Middle East and Africa
Data Table on Regional Comparison - Middle East and Africa

12.7.1 Saudi Arabia - Market size and forecast 2025-2030

Chart on Saudi Arabia - Market size and forecast 2025-2030 ($ million)
Data Table on Saudi Arabia - Market size and forecast 2025-2030 ($ million)
Chart on Saudi Arabia - Year-over-year growth 2025-2030 (%)
Data Table on Saudi Arabia - Year-over-year growth 2025-2030 (%)

12.7.2 UAE - Market size and forecast 2025-2030

Chart on UAE - Market size and forecast 2025-2030 ($ million)
Data Table on UAE - Market size and forecast 2025-2030 ($ million)
Chart on UAE - Year-over-year growth 2025-2030 (%)
Data Table on UAE - Year-over-year growth 2025-2030 (%)

12.7.3 Turkey - Market size and forecast 2025-2030

Chart on Turkey - Market size and forecast 2025-2030 ($ million)
Data Table on Turkey - Market size and forecast 2025-2030 ($ million)
Chart on Turkey - Year-over-year growth 2025-2030 (%)
Data Table on Turkey - Year-over-year growth 2025-2030 (%)

12.7.4 South Africa - Market size and forecast 2025-2030

Chart on South Africa - Market size and forecast 2025-2030 ($ million)
Data Table on South Africa - Market size and forecast 2025-2030 ($ million)
Chart on South Africa - Year-over-year growth 2025-2030 (%)
Data Table on South Africa - Year-over-year growth 2025-2030 (%)

12.7.5 Israel - Market size and forecast 2025-2030

Chart on Israel - Market size and forecast 2025-2030 ($ million)
Data Table on Israel - Market size and forecast 2025-2030 ($ million)
Chart on Israel - Year-over-year growth 2025-2030 (%)
Data Table on Israel - Year-over-year growth 2025-2030 (%)

12.8 Market opportunity by geography

Market opportunity by geography ($ million)
Data Tables on Market opportunity by geography ($ million)

13. Drivers, Challenges, and Opportunity

13.1 Market drivers

Surge in AI and high-density computational requirements
Acceleration of hyperscale infrastructure and cloud service integration
Proliferation of edge computing and decentralized data processing frameworks

13.2 Market challenges

Thermal management and escalation of high-density cooling requirements
Sustainability mandates and complexity of regulatory compliance
Supply chain volatility and fluctuations of raw material costs

13.3 Impact of drivers and challenges

Impact of drivers and challenges in 2025 and 2030

13.4 Market opportunities

Evolution toward modular and highly scalable rack frameworks
Integration of intelligent monitoring and automated management systems
Shift toward open hardware standards and sustainable manufacturing practices

14. Competitive Landscape

14.1 Overview

14.2

Overview on criticality of inputs and factors of differentiation

14.3 Landscape disruption

Overview on factors of disruption

14.4 Industry risks

Impact of key risks on business

15. Competitive Analysis

15.1 Companies profiled

Companies covered

15.2 Company ranking index

15.3 Market positioning of companies

Matrix on companies position and classification

15.4 Belden Inc.

Belden Inc. - Overview
Belden Inc. - Business segments
Belden Inc. - Key news
Belden Inc. - Key offerings
Belden Inc. - Segment focus
SWOT

15.5 Cisco Systems Inc.

Cisco Systems Inc. - Overview
Cisco Systems Inc. - Business segments
Cisco Systems Inc. - Key news
Cisco Systems Inc. - Key offerings
Cisco Systems Inc. - Segment focus
SWOT

15.6 CommScope Holding Co. Inc.

CommScope Holding Co. Inc. - Overview
CommScope Holding Co. Inc. - Business segments
CommScope Holding Co. Inc. - Key offerings
CommScope Holding Co. Inc. - Segment focus
SWOT

15.7 Delta Electronics India

Delta Electronics India - Overview
Delta Electronics India - Product / Service
Delta Electronics India - Key offerings
SWOT

15.8 Eaton Corp. Plc

Eaton Corp. Plc - Overview
Eaton Corp. Plc - Business segments
Eaton Corp. Plc - Key news
Eaton Corp. Plc - Key offerings
Eaton Corp. Plc - Segment focus
SWOT

15.9 Hammond Manufacturing Ltd.

Hammond Manufacturing Ltd. - Overview
Hammond Manufacturing Ltd. - Product / Service
Hammond Manufacturing Ltd. - Key offerings
SWOT

15.10 Hewlett Packard Enterprise Co.

Hewlett Packard Enterprise Co. - Overview
Hewlett Packard Enterprise Co. - Business segments
Hewlett Packard Enterprise Co. - Key news
Hewlett Packard Enterprise Co. - Key offerings
Hewlett Packard Enterprise Co. - Segment focus
SWOT

15.11 Huawei Technologies Co. Ltd.

Huawei Technologies Co. Ltd. - Overview
Huawei Technologies Co. Ltd. - Product / Service
Huawei Technologies Co. Ltd. - Key offerings
SWOT

15.12 IBM Corp.

IBM Corp. - Overview
IBM Corp. - Business segments
IBM Corp. - Key news
IBM Corp. - Key offerings
IBM Corp. - Segment focus
SWOT

15.13 Legrand SA

Legrand SA - Overview
Legrand SA - Business segments
Legrand SA - Key news
Legrand SA - Key offerings
Legrand SA - Segment focus
SWOT

15.14 Lenovo Group Ltd.

Lenovo Group Ltd. - Overview
Lenovo Group Ltd. - Business segments
Lenovo Group Ltd. - Key news
Lenovo Group Ltd. - Key offerings
Lenovo Group Ltd. - Segment focus
SWOT

15.15 nVent Electric Plc

nVent Electric Plc - Overview
nVent Electric Plc - Business segments
nVent Electric Plc - Key news
nVent Electric Plc - Key offerings
nVent Electric Plc - Segment focus
SWOT

15.16 Oracle Corp.

Oracle Corp. - Overview
Oracle Corp. - Business segments
Oracle Corp. - Key news
Oracle Corp. - Key offerings
Oracle Corp. - Segment focus
SWOT

15.17 Schneider Electric SE

Schneider Electric SE - Overview
Schneider Electric SE - Business segments
Schneider Electric SE - Key news
Schneider Electric SE - Key offerings
Schneider Electric SE - Segment focus
SWOT

15.18 Vertiv Holdings Co.

Vertiv Holdings Co. - Overview
Vertiv Holdings Co. - Business segments
Vertiv Holdings Co. - Key news
Vertiv Holdings Co. - Key offerings
Vertiv Holdings Co. - Segment focus
SWOT

16. Appendix

16.1 Scope of the report

Market definition
Objectives
Notes and caveats

16.2 Inclusions and exclusions checklist

Inclusions checklist
Exclusions checklist

16.3 Currency conversion rates for US$

16.4 Research methodology

16.5 Data procurement

Information sources

16.6 Data validation

16.7 Validation techniques employed for market sizing

16.8 Data synthesis

16.9 360 degree market analysis

16.10 List of abbreviations

Research Methodology

Technavio presents a detailed picture of the market by way of study, synthesis, and summation of data from multiple sources. The analysts have presented the various facets of the market with a particular focus on identifying the key industry influencers. The data thus presented is comprehensive, reliable, and the result of extensive research, both primary and secondary.

INFORMATION SOURCES

Primary sources

  • Manufacturers and suppliers
  • Channel partners
  • Industry experts
  • Strategic decision makers

Secondary sources

  • Industry journals and periodicals
  • Government data
  • Financial reports of key industry players
  • Historical data
  • Press releases

DATA ANALYSIS

Data Synthesis

  • Collation of data
  • Estimation of key figures
  • Analysis of derived insights

Data Validation

  • Triangulation with data models
  • Reference against proprietary databases
  • Corroboration with industry experts

REPORT WRITING

Qualitative

  • Market drivers
  • Market challenges
  • Market trends
  • Five forces analysis

Quantitative

  • Market size and forecast
  • Market segmentation
  • Geographical insights
  • Competitive landscape

Interested in this report?

Get your sample now to see our research methodology and insights!

Download Now

Frequently Asked Questions

Data Center Rack market growth will increase by USD 2752.3 million during 2026-2030.

The Data Center Rack market is expected to grow at a CAGR of 13.3% during 2026-2030.

Data Center Rack market is segmented by Type (Server rack, Network rack) Product specification (Medium, Large, Small) End-user (IT and telecom, BFSI, Manufacturing, Retail, Others)

Belden Inc., Black Box Corp., Canovate Group, Cisco Systems Inc., CommScope Holding Co. Inc., Delta Electronics India, Eaton Corp. Plc, Hammond Manufacturing Ltd., Hewlett Packard Enterprise Co., Huawei Technologies Co. Ltd., IBM Corp., Legrand SA, Lenovo Group Ltd., nVent Electric Plc, Oracle Corp., Panduit Corp., Rittal GmbH and Co. KG, Schneider Electric SE, Vertiv Holdings Co. are a few of the key vendors in the Data Center Rack market.

APAC will register the highest growth rate of 30.3% among the other regions. Therefore, the Data Center Rack market in APAC is expected to garner significant business opportunities for the vendors during the forecast period.

US, Canada, Mexico, Germany, UK, France, Italy, Spain, The Netherlands, China, Japan, India, South Korea, Australia, Indonesia, Brazil, Argentina, Chile, Saudi Arabia, UAE, Turkey, South Africa, Israel

  • Surge in AI and high-density computational requirements is the driving factor this market.

The Data Center Rack market vendors should focus on grabbing business opportunities from the Type segment as it accounted for the largest market share in the base year.
RIA - Research AI Assistant
Ask RIA
