Cultural Tourism Market Analysis, Size, and Forecast 2026-2030: Europe (Germany, UK, and France), APAC (China, Japan, and India), North America (US, Canada, and Mexico), South America (Brazil and Argentina), Middle East and Africa (Saudi Arabia, UAE, and South Africa), and Rest of World (ROW)

Cultural Tourism Market Analysis, Size, and Forecast 2026-2030:
Europe (Germany, UK, and France), APAC (China, Japan, and India), North America (US, Canada, and Mexico), South America (Brazil and Argentina), Middle East and Africa (Saudi Arabia, UAE, and South Africa), and Rest of World (ROW)

Published: May 2026 296 Pages SKU: IRTNTR44143

Market Overview at a Glance

$12.88 B
Market Opportunity
22.3%
CAGR 2025 - 2030
40.7%
Europe Growth
$4.40 B
Domestic cultural tourism segment 2024

Cultural Tourism Market Size 2026-2030

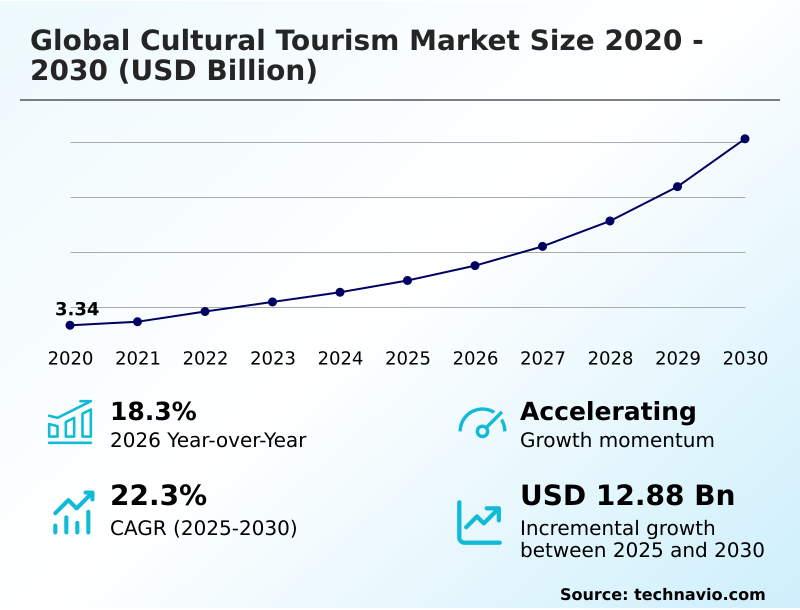
The cultural tourism market size is valued to increase by USD 12.88 billion, at a CAGR of 22.3% from 2025 to 2030. Rising interest in heritage and cultural experiences worldwide will drive the cultural tourism market.

Major Market Trends & Insights

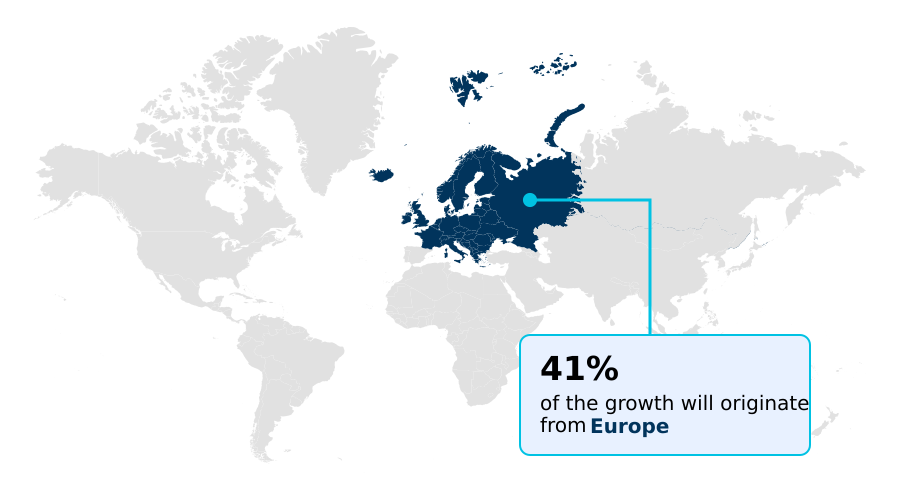
  • Europe dominated the market and accounted for a 40.7% growth during the forecast period.
  • By Type - Domestic cultural tourism segment was valued at USD 4.40 billion in 2024
  • By Service - Cultural eco-tourism segment accounted for the largest market revenue share in 2024

Market Size & Forecast

  • Market Opportunities: USD 16.95 billion
  • Market Future Opportunities: USD 12.88 billion
  • CAGR from 2025 to 2030 : 22.3%

Market Summary

  • The Cultural Tourism Market is undergoing a significant transformation, evolving from conventional sightseeing to deep cultural immersion. This shift is powered by digital booking platforms that provide unprecedented access to niche tourism segments, including culinary tourism, indigenous tourism, and specialized art and culture tours.
  • Consequently, destination management organizations are grappling with new challenges, such as overtourism mitigation and the critical need for robust heritage site preservation. A forward-thinking tour operator, for example, now utilizes traveler behavior analytics to craft personalized travel itineraries. These itineraries actively promote visitor dispersal strategies, guiding tourists to lesser-known historical landmarks and archaeological sites, thereby enhancing visitor experience management.
  • This data-driven approach not only balances commercial objectives with responsible tourism practices but also amplifies the positive local economic impact by spreading revenue across a wider community base. As travelers increasingly seek authentic local experiences, the industry's focus sharpens on sustainability and community-based tourism models to ensure long-term viability and cultural integrity.

What will be the Size of the Cultural Tourism Market during the forecast period?

Get Key Insights on Market Forecast (PDF) Request Free Sample

How is the Cultural Tourism Market Segmented?

The cultural tourism industry research report provides comprehensive data (region-wise segment analysis), with forecasts and estimates in "USD million" for the period 2026-2030, as well as historical data from 2020-2024 for the following segments.

  • Type
    • Domestic cultural tourism
    • International cultural tourism
  • Service
    • Cultural eco-tourism
    • Indigenous cultural tourism
    • Socio-cultural tourism
  • Application
    • Leisure
    • Religious pilgrimage
    • Education
    • Research
  • Geography
    • Europe
      • Germany
      • UK
      • France
    • APAC
      • China
      • Japan
      • India
    • North America
      • US
      • Canada
      • Mexico
    • South America
      • Brazil
      • Argentina
    • Middle East and Africa
      • Saudi Arabia
      • UAE
      • South Africa
    • Rest of World (ROW)

By Type Insights

The domestic cultural tourism segment is estimated to witness significant growth during the forecast period.

Domestic cultural tourism is driven by travelers exploring heritage within their own countries, a segment supported by affordability and accessibility. This form of experiential travel focuses on archaeological sites, historical landmarks, and culinary tourism.

Effective destination management is crucial for handling tourist inflow management and ensuring sustainable travel.

The segment's growth is significant, with regions like Europe projected to contribute 40.7% of the total market's incremental growth, highlighting the importance of robust tourism infrastructure development and strategies for visitor flow optimization.

This reflects a strong preference for local cultural immersion and authentic local experiences, which bolsters the local economic impact and supports heritage site preservation, making it a cornerstone of the broader market.

Request Free Sample

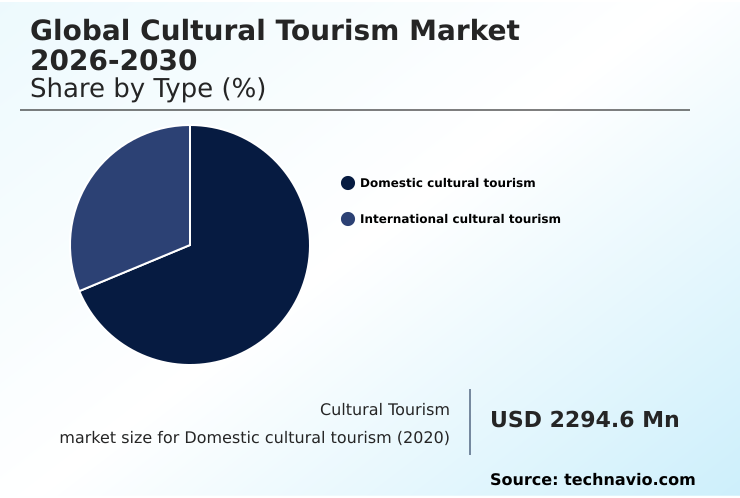
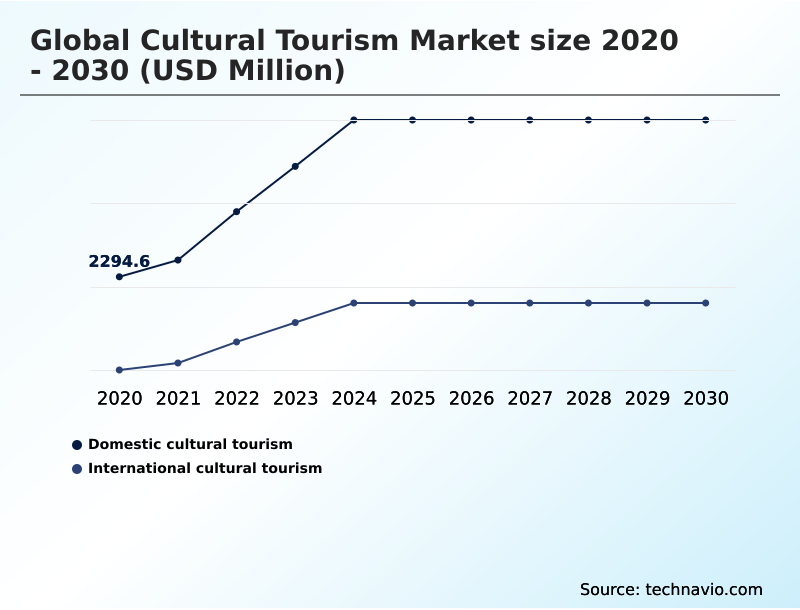
The Domestic cultural tourism segment was valued at USD 4.40 billion in 2024 and showed a gradual increase during the forecast period.

Request Free Sample

Regional Analysis

Europe is estimated to contribute 40.7% to the growth of the global market during the forecast period.Technavio’s analysts have elaborately explained the regional trends and drivers that shape the market during the forecast period.

See How Cultural Tourism Market Demand is Rising in Europe Request Free Sample

The geographic landscape of the market is characterized by concentrated growth in established regions, with Europe and APAC collectively accounting for over 73% of the market's incremental growth opportunity.

Europe leads, representing 40.7% of this expansion, driven by its dense network of historical landmarks and advanced tourism infrastructure development.

In contrast, APAC's rapid emergence is fueled by a growing middle class and heightened interest in both domestic and cross-border tourism. Destination management in these regions focuses on balancing high tourist inflow management with sustainable travel.

North America, while a mature market, shows steady demand for experiential travel and museum tourism. Effective cultural heritage conservation and destination marketing strategies are key differentiators, as is managing the geopolitical travel impact on traveler sentiment.

Market Dynamics

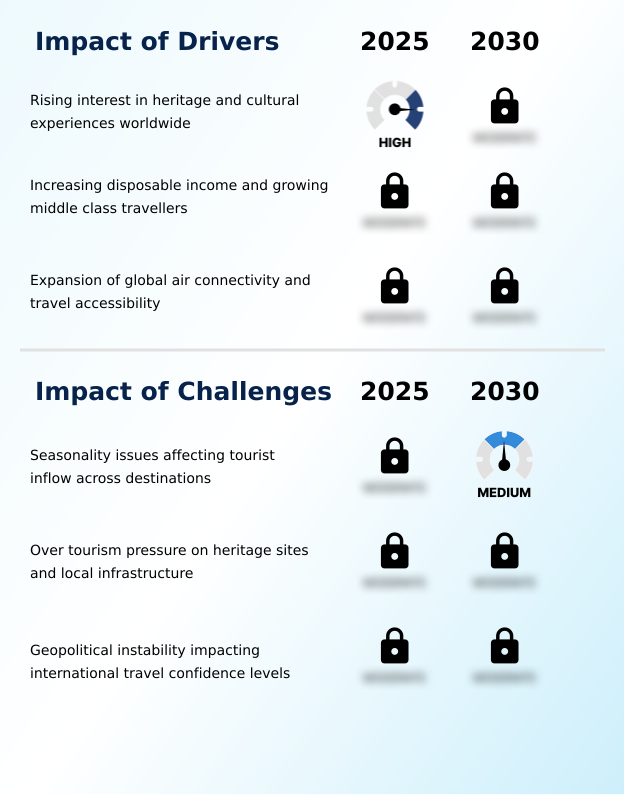
Our researchers analyzed the data with 2025 as the base year, along with the key drivers, trends, and challenges. A holistic analysis of drivers will help companies refine their marketing strategies to gain a competitive advantage.

  • Strategic planning in the Cultural Tourism Market requires a deep understanding of complex, intersecting factors. The impact of overtourism on heritage sites is a primary concern, compelling stakeholders to develop sophisticated strategies for sustainable cultural tourism. This involves balancing tourism with heritage preservation, where the role of digital platforms in tourism becomes crucial for managing visitor flows and engagement.
  • The growth of the experiential travel market underscores a shift in consumer demand, requiring operators to analyze traveler preferences for culture more accurately. Concurrently, challenges in managing tourism seasonality and the impact of geopolitics on travel decisions necessitate resilient cultural tourism policy and planning.
  • The economic benefits of community-based tourism are substantial, yet this requires careful cultural tourism supply chain management and efforts to develop indigenous tourism respectfully. For example, the domestic tourism segment, which is more than double the size of the international segment, justifies major investment in cultural tourism infrastructure.
  • Leveraging technology for visitor engagement, from virtual reality in tourism to digital marketing strategies for cultural destinations, is key to optimizing revenue from cultural attractions and assessing the socio-cultural impacts of tourism, often guided by the role of UNESCO in cultural heritage tourism.

What are the key market drivers leading to the rise in the adoption of Cultural Tourism Industry?

  • A key market driver is the rising global interest in heritage and cultural experiences worldwide, as travelers increasingly seek more meaningful and educational journeys.

  • The market's 18.3% year-over-year growth is substantially fueled by improved travel accessibility and a rising global interest in experiential travel.
  • The introduction of new flight routes by low-cost carriers, for instance, has been shown to reduce average travel costs to secondary cultural destinations by up to 25%, stimulating new demand and supporting cross-border tourism.
  • This expansion in connectivity enhances access to festival tourism and community-based tourism opportunities.
  • This growth is also enabled by tourism infrastructure development and the proliferation of travel and hospitality services that cater to diverse niche tourism segments, making rich cultural engagement more attainable for a broader audience.

What are the market trends shaping the Cultural Tourism Industry?

  • A prominent market trend is the growing demand for authentic local cultural immersion experiences. This shift reflects travelers' increasing desire for meaningful and participatory engagement over traditional sightseeing.

  • The market is rapidly evolving with a focus on sustainable travel and cultural immersion, supported by digital transformation. Digital adoption is reshaping traveler engagement, with online travel agency platforms reporting up to a 40% increase in bookings for authentic local experiences over standard packages. This shift towards responsible tourism practices is a direct response to consumer demand.
  • Furthermore, virtual tours now influence physical travel decisions in 1 out of 5 cases, serving as a powerful tool for destination marketing strategies. This trend highlights the growing importance of smart tourism technologies and digital heritage interpretation in attracting modern travelers and promoting eco-cultural tourism and cultural exchange programs.

What challenges does the Cultural Tourism Industry face during its growth?

  • A significant challenge impacting market growth is the issue of seasonality, which creates pronounced fluctuations in tourist inflow and places uneven strain on destination resources.

  • Overtourism mitigation remains a primary operational challenge, as visitor numbers in some heritage cities surpass local infrastructure capacity by over 150% during peak seasons, necessitating advanced tourist inflow management.
  • The geopolitical travel impact is also significant, with regions experiencing instability seeing drops in the travel confidence index that can depress bookings by as much as 30% almost overnight, showcasing the need for robust travel risk assessment. This volatility affects everything from art and culture tours to religious pilgrimage.
  • These factors underscore the difficulty in maintaining steady visitor flow optimization and highlight the importance of tourism diversification to build resilience against external shocks.

Exclusive Technavio Analysis on Customer Landscape

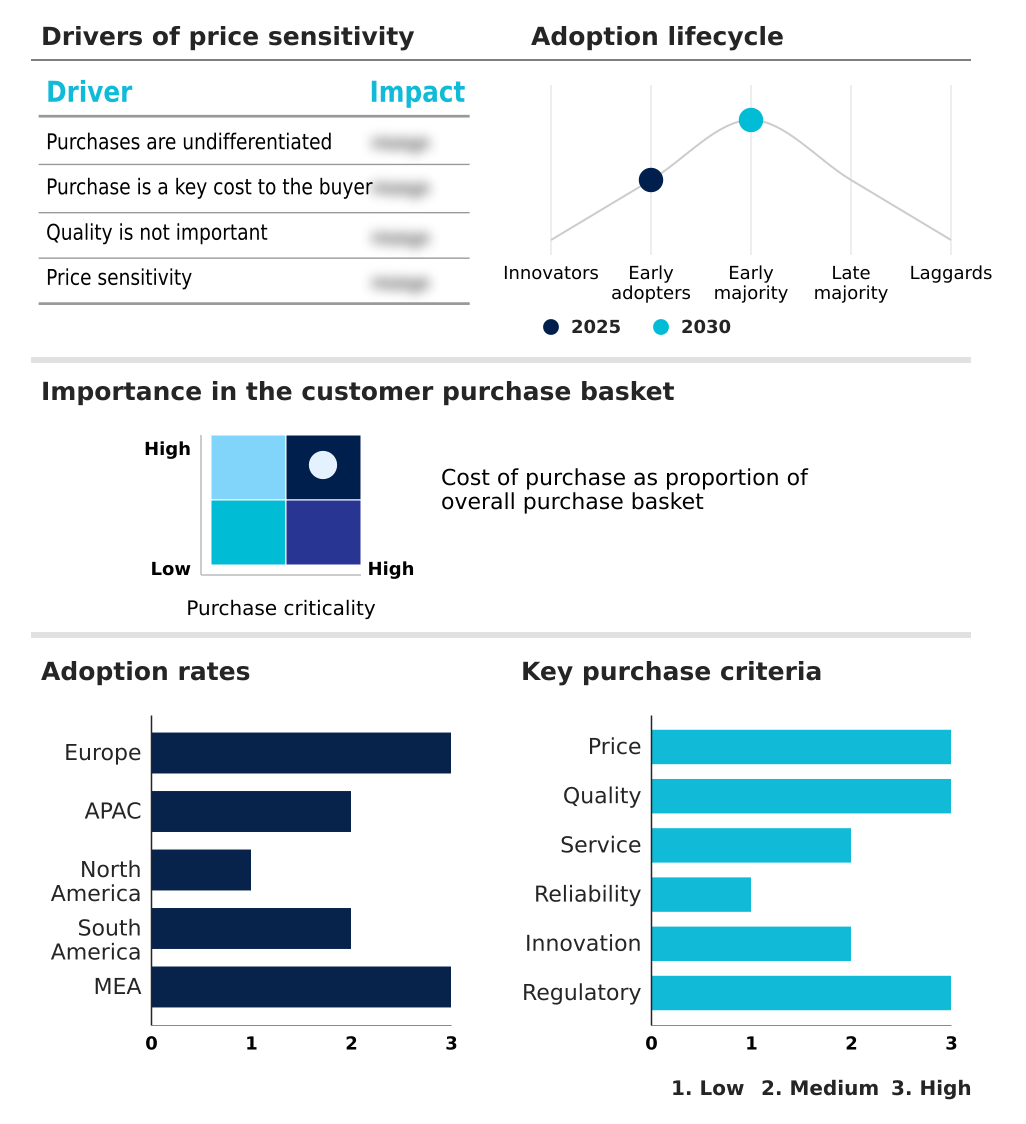
The cultural tourism market forecasting report includes the adoption lifecycle of the market, covering from the innovator’s stage to the laggard’s stage. It focuses on adoption rates in different regions based on penetration. Furthermore, the cultural tourism market report also includes key purchase criteria and drivers of price sensitivity to help companies evaluate and develop their market growth analysis strategies.

Customer Landscape of Cultural Tourism Industry

Competitive Landscape

Companies are implementing various strategies, such as strategic alliances, cultural tourism market forecast, partnerships, mergers and acquisitions, geographical expansion, and product/service launches, to enhance their presence in the industry.

Airbnb Inc. - Analysis reveals a focus on curated cultural travel, emphasizing heritage immersion and authentic destination experiences that drive market differentiation and value.

The industry research and growth report includes detailed analyses of the competitive landscape of the market and information about key companies, including:

  • Airbnb Inc.
  • Booking Holdings Inc.
  • Butterfield and Robinson Inc.
  • Collette Travel Service Inc.
  • Context Travel LLC
  • EF Education First Ltd.
  • Exodus Travels Ltd.
  • Expedia Group Inc.
  • G Adventures Inc.
  • GetYourGuide GmbH
  • Grand Circle LLC
  • Intrepid Group Pty Ltd.
  • Tauck Inc.
  • The Travel Corp.
  • TripAdvisor Inc.
  • TUI AG
  • Viking Cruises
  • Zicasso Inc.

Qualitative and quantitative analysis of companies has been conducted to help clients understand the wider business environment as well as the strengths and weaknesses of key industry players. Data is qualitatively analyzed to categorize companies as pure play, category-focused, industry-focused, and diversified; it is quantitatively analyzed to categorize companies as dominant, leading, strong, tentative, and weak.

Recent Development and News in Cultural tourism market

  • In May 2025, Booking Holdings enhanced its cultural tourism offerings by introducing AI-powered itinerary planning tools and immersive destination previews, allowing users to explore heritage sites virtually before making travel decisions.
  • In June 2025, Airbnb Experiences expanded its curated cultural immersion programs across multiple Asian and European destinations, offering travelers opportunities to engage in local workshops, heritage walks, and community-based activities.
  • In August 2025, Expedia Group introduced sustainability-focused filters on its travel platform, allowing users to identify and book culturally rich destinations with verified eco-friendly and responsible tourism certifications.
  • In September 2025, Emirates expanded its international route network by introducing additional flight connections to key cultural tourism destinations in Europe and Asia, improving accessibility for long-haul travellers and strengthening global tourism linkages.

Dive into Technavio’s robust research methodology, blending expert interviews, extensive data synthesis, and validated models for unparalleled Cultural Tourism Market insights. See full methodology.

Market Scope
Page number 296
Base year 2025
Historic period 2020-2024
Forecast period 2026-2030
Growth momentum & CAGR Accelerate at a CAGR of 22.3%
Market growth 2026-2030 USD 12878.9 million
Market structure Fragmented
YoY growth 2025-2026(%) 18.3%
Key countries Germany, UK, France, Italy, Spain, The Netherlands, China, Japan, India, South Korea, Australia, Indonesia, US, Canada, Mexico, Brazil, Argentina, Chile, Saudi Arabia, UAE, South Africa, Israel and Turkey
Competitive landscape Leading Companies, Market Positioning of Companies, Competitive Strategies, and Industry Risks

Request Free Sample

Research Analyst Overview

  • An analytical view of the market reveals a complex interplay of factors beyond simple travel logistics. While some operational metrics suggest quality has a low impact on purchasing, this belies the reality of experiential travel. The core of effective visitor experience management is a deep cultural immersion, not a transactional visit to archaeological sites or historical landmarks.
  • The market is driven by a quest for authenticity, whether through indigenous tourism, culinary tourism, or festival tourism. Success hinges on sophisticated destination management and robust heritage site preservation, especially with the challenge of overtourism mitigation. Digital booking platforms and virtual tours are transforming travel accessibility, but the geopolitical travel impact remains a volatile external factor.
  • Ultimately, growth depends on balancing tourist inflow management with sustainable travel and community-based tourism principles, from religious pilgrimage routes to eco-cultural tourism sites, all while delivering compelling art and culture tours.

What are the Key Data Covered in this Cultural Tourism Market Research and Growth Report?

  • What is the expected growth of the Cultural Tourism Market between 2026 and 2030?

    • USD 12.88 billion, at a CAGR of 22.3%

  • What segmentation does the market report cover?

    • The report is segmented by Type (Domestic cultural tourism, and International cultural tourism), Service (Cultural eco-tourism, Indigenous cultural tourism, and Socio-cultural tourism), Application (Leisure, Religious pilgrimage, Education, and Research) and Geography (Europe, APAC, North America, South America, Middle East and Africa)

  • Which regions are analyzed in the report?

    • Europe, APAC, North America, South America and Middle East and Africa

  • What are the key growth drivers and market challenges?

    • Rising interest in heritage and cultural experiences worldwide, Seasonality issues affecting tourist inflow across destinations

  • Who are the major players in the Cultural Tourism Market?

    • Airbnb Inc., Booking Holdings Inc., Butterfield and Robinson Inc., Collette Travel Service Inc., Context Travel LLC, EF Education First Ltd., Exodus Travels Ltd., Expedia Group Inc., G Adventures Inc., GetYourGuide GmbH, Grand Circle LLC, Intrepid Group Pty Ltd., Tauck Inc., The Travel Corp., TripAdvisor Inc., TUI AG, Viking Cruises and Zicasso Inc.

Market Research Insights

  • The market's dynamics are increasingly shaped by the pursuit of authentic local experiences and the adoption of smart tourism technologies. Regional performance varies, with Europe's market expanding at a rate 1.3 percentage points higher than North America's, reflecting distinct destination marketing strategies and travel confidence index levels.
  • The local economic impact of well-managed cultural exchange programs is a critical performance indicator; successful community-based projects have demonstrated the ability to achieve self-sufficiency rates of over 60% within three years of launch. This highlights the effectiveness of tourism diversification and responsible tourism practices in creating sustainable growth.
  • Efficient visitor flow optimization is another key metric, with some destinations improving visitor satisfaction by 15% through the implementation of digital heritage interpretation tools and personalized travel itineraries.

We can help! Our analysts can customize this cultural tourism market research report to meet your requirements.

Get in touch

1. Executive Summary

1.1 Market overview

Executive Summary - Chart on Market Overview
Executive Summary - Data Table on Market Overview
Executive Summary - Chart on Global Market Characteristics
Executive Summary - Chart on Market by Geography
Executive Summary - Chart on Market Segmentation by Type
Executive Summary - Chart on Market Segmentation by Service
Executive Summary - Chart on Market Segmentation by Application
Executive Summary - Chart on Incremental Growth
Executive Summary - Data Table on Incremental Growth
Executive Summary - Chart on Company Market Positioning

2. Technavio Analysis

2.1 Analysis of price sensitivity, lifecycle, customer purchase basket, adoption rates, and purchase criteria

2.2 Criticality of inputs and Factors of differentiation

Chart on Overview on criticality of inputs and factors of differentiation

2.3 Factors of disruption

Chart on Overview on factors of disruption

2.4 Impact of drivers and challenges

Chart on Impact of drivers and challenges in 2025 and 2030

3. Market Landscape

3.1 Market ecosystem

Chart on Parent Market
Data Table on - Parent Market

3.2 Market characteristics

Chart on Market characteristics analysis

3.3 Value chain analysis

Chart on Value chain analysis

4. Market Sizing

4.1 Market definition

Data Table on Offerings of companies included in the market definition

4.2 Market segment analysis

Market segments

4.3 Market size 2025

4.4 Market outlook: Forecast for 2025-2030

Chart on Global - Market size and forecast 2025-2030 ($ million)
Data Table on Global - Market size and forecast 2025-2030 ($ million)
Chart on Global Market: Year-over-year growth 2025-2030 (%)
Data Table on Global Market: Year-over-year growth 2025-2030 (%)

5. Historic Market Size

5.1 Global Cultural Tourism Market 2020 - 2024

Historic Market Size - Data Table on Global Cultural Tourism Market 2020 - 2024 ($ million)

5.2 Type segment analysis 2020 - 2024

Historic Market Size - Type Segment 2020 - 2024 ($ million)

5.3 Service segment analysis 2020 - 2024

Historic Market Size - Service Segment 2020 - 2024 ($ million)

5.4 Application segment analysis 2020 - 2024

Historic Market Size - Application Segment 2020 - 2024 ($ million)

5.5 Geography segment analysis 2020 - 2024

Historic Market Size - Geography Segment 2020 - 2024 ($ million)

5.6 Country segment analysis 2020 - 2024

Historic Market Size - Country Segment 2020 - 2024 ($ million)

6. Qualitative Analysis

6.1 Impact of AI on Global Cultural Tourism Market

6.2 Impact of Geopolitical Conflicts on Global Cultural Tourism Market

7. Five Forces Analysis

7.1 Five forces summary

Five forces analysis - Comparison between 2025 and 2030

7.2 Bargaining power of buyers

Bargaining power of buyers - Impact of key factors 2025 and 2030

7.3 Bargaining power of suppliers

Bargaining power of suppliers - Impact of key factors in 2025 and 2030

7.4 Threat of new entrants

Threat of new entrants - Impact of key factors in 2025 and 2030

7.5 Threat of substitutes

Threat of substitutes - Impact of key factors in 2025 and 2030

7.6 Threat of rivalry

Threat of rivalry - Impact of key factors in 2025 and 2030

7.7 Market condition

Chart on Market condition - Five forces 2025 and 2030

8. Market Segmentation by Type

8.1 Market segments

Chart on Type - Market share 2025-2030 (%)
Data Table on Type - Market share 2025-2030 (%)

8.2 Comparison by Type

Chart on Comparison by Type
Data Table on Comparison by Type

8.3 Domestic cultural tourism - Market size and forecast 2025-2030

Chart on Domestic cultural tourism - Market size and forecast 2025-2030 ($ million)
Data Table on Domestic cultural tourism - Market size and forecast 2025-2030 ($ million)
Chart on Domestic cultural tourism - Year-over-year growth 2025-2030 (%)
Data Table on Domestic cultural tourism - Year-over-year growth 2025-2030 (%)

8.4 International cultural tourism - Market size and forecast 2025-2030

Chart on International cultural tourism - Market size and forecast 2025-2030 ($ million)
Data Table on International cultural tourism - Market size and forecast 2025-2030 ($ million)
Chart on International cultural tourism - Year-over-year growth 2025-2030 (%)
Data Table on International cultural tourism - Year-over-year growth 2025-2030 (%)

8.5 Market opportunity by Type

Market opportunity by Type ($ million)
Data Table on Market opportunity by Type ($ million)

9. Market Segmentation by Service

9.1 Market segments

Chart on Service - Market share 2025-2030 (%)
Data Table on Service - Market share 2025-2030 (%)

9.2 Comparison by Service

Chart on Comparison by Service
Data Table on Comparison by Service

9.3 Cultural eco-tourism - Market size and forecast 2025-2030

Chart on Cultural eco-tourism - Market size and forecast 2025-2030 ($ million)
Data Table on Cultural eco-tourism - Market size and forecast 2025-2030 ($ million)
Chart on Cultural eco-tourism - Year-over-year growth 2025-2030 (%)
Data Table on Cultural eco-tourism - Year-over-year growth 2025-2030 (%)

9.4 Indigenous cultural tourism - Market size and forecast 2025-2030

Chart on Indigenous cultural tourism - Market size and forecast 2025-2030 ($ million)
Data Table on Indigenous cultural tourism - Market size and forecast 2025-2030 ($ million)
Chart on Indigenous cultural tourism - Year-over-year growth 2025-2030 (%)
Data Table on Indigenous cultural tourism - Year-over-year growth 2025-2030 (%)

9.5 Socio-cultural tourism - Market size and forecast 2025-2030

Chart on Socio-cultural tourism - Market size and forecast 2025-2030 ($ million)
Data Table on Socio-cultural tourism - Market size and forecast 2025-2030 ($ million)
Chart on Socio-cultural tourism - Year-over-year growth 2025-2030 (%)
Data Table on Socio-cultural tourism - Year-over-year growth 2025-2030 (%)

9.6 Market opportunity by Service

Market opportunity by Service ($ million)
Data Table on Market opportunity by Service ($ million)

10. Market Segmentation by Application

10.1 Market segments

Chart on Application - Market share 2025-2030 (%)
Data Table on Application - Market share 2025-2030 (%)

10.2 Comparison by Application

Chart on Comparison by Application
Data Table on Comparison by Application

10.3 Leisure - Market size and forecast 2025-2030

Chart on Leisure - Market size and forecast 2025-2030 ($ million)
Data Table on Leisure - Market size and forecast 2025-2030 ($ million)
Chart on Leisure - Year-over-year growth 2025-2030 (%)
Data Table on Leisure - Year-over-year growth 2025-2030 (%)

10.4 Religious pilgrimage - Market size and forecast 2025-2030

Chart on Religious pilgrimage - Market size and forecast 2025-2030 ($ million)
Data Table on Religious pilgrimage - Market size and forecast 2025-2030 ($ million)
Chart on Religious pilgrimage - Year-over-year growth 2025-2030 (%)
Data Table on Religious pilgrimage - Year-over-year growth 2025-2030 (%)

10.5 Education - Market size and forecast 2025-2030

Chart on Education - Market size and forecast 2025-2030 ($ million)
Data Table on Education - Market size and forecast 2025-2030 ($ million)
Chart on Education - Year-over-year growth 2025-2030 (%)
Data Table on Education - Year-over-year growth 2025-2030 (%)

10.6 Research - Market size and forecast 2025-2030

Chart on Research - Market size and forecast 2025-2030 ($ million)
Data Table on Research - Market size and forecast 2025-2030 ($ million)
Chart on Research - Year-over-year growth 2025-2030 (%)
Data Table on Research - Year-over-year growth 2025-2030 (%)

10.7 Market opportunity by Application

Market opportunity by Application ($ million)
Data Table on Market opportunity by Application ($ million)

11. Customer Landscape

11.1 Customer landscape overview

Analysis of price sensitivity, lifecycle, customer purchase basket, adoption rates, and purchase criteria

12. Geographic Landscape

12.1 Geographic segmentation

Chart on Market share by geography 2025-2030 (%)
Data Table on Market share by geography 2025-2030 (%)

12.2 Geographic comparison

Chart on Geographic comparison
Data Table on Geographic comparison

12.3 Europe - Market size and forecast 2025-2030

Chart on Europe - Market size and forecast 2025-2030 ($ million)
Data Table on Europe - Market size and forecast 2025-2030 ($ million)
Chart on Europe - Year-over-year growth 2025-2030 (%)
Data Table on Europe - Year-over-year growth 2025-2030 (%)
Chart on Regional Comparison - Europe
Data Table on Regional Comparison - Europe

12.3.1 Germany - Market size and forecast 2025-2030

Chart on Germany - Market size and forecast 2025-2030 ($ million)
Data Table on Germany - Market size and forecast 2025-2030 ($ million)
Chart on Germany - Year-over-year growth 2025-2030 (%)
Data Table on Germany - Year-over-year growth 2025-2030 (%)

12.3.2 UK - Market size and forecast 2025-2030

Chart on UK - Market size and forecast 2025-2030 ($ million)
Data Table on UK - Market size and forecast 2025-2030 ($ million)
Chart on UK - Year-over-year growth 2025-2030 (%)
Data Table on UK - Year-over-year growth 2025-2030 (%)

12.3.3 France - Market size and forecast 2025-2030

Chart on France - Market size and forecast 2025-2030 ($ million)
Data Table on France - Market size and forecast 2025-2030 ($ million)
Chart on France - Year-over-year growth 2025-2030 (%)
Data Table on France - Year-over-year growth 2025-2030 (%)

12.3.4 Italy - Market size and forecast 2025-2030

Chart on Italy - Market size and forecast 2025-2030 ($ million)
Data Table on Italy - Market size and forecast 2025-2030 ($ million)
Chart on Italy - Year-over-year growth 2025-2030 (%)
Data Table on Italy - Year-over-year growth 2025-2030 (%)

12.3.5 Spain - Market size and forecast 2025-2030

Chart on Spain - Market size and forecast 2025-2030 ($ million)
Data Table on Spain - Market size and forecast 2025-2030 ($ million)
Chart on Spain - Year-over-year growth 2025-2030 (%)
Data Table on Spain - Year-over-year growth 2025-2030 (%)

12.3.6 The Netherlands - Market size and forecast 2025-2030

Chart on The Netherlands - Market size and forecast 2025-2030 ($ million)
Data Table on The Netherlands - Market size and forecast 2025-2030 ($ million)
Chart on The Netherlands - Year-over-year growth 2025-2030 (%)
Data Table on The Netherlands - Year-over-year growth 2025-2030 (%)

12.4 APAC - Market size and forecast 2025-2030

Chart on APAC - Market size and forecast 2025-2030 ($ million)
Data Table on APAC - Market size and forecast 2025-2030 ($ million)
Chart on APAC - Year-over-year growth 2025-2030 (%)
Data Table on APAC - Year-over-year growth 2025-2030 (%)
Chart on Regional Comparison - APAC
Data Table on Regional Comparison - APAC

12.4.1 China - Market size and forecast 2025-2030

Chart on China - Market size and forecast 2025-2030 ($ million)
Data Table on China - Market size and forecast 2025-2030 ($ million)
Chart on China - Year-over-year growth 2025-2030 (%)
Data Table on China - Year-over-year growth 2025-2030 (%)

12.4.2 Japan - Market size and forecast 2025-2030

Chart on Japan - Market size and forecast 2025-2030 ($ million)
Data Table on Japan - Market size and forecast 2025-2030 ($ million)
Chart on Japan - Year-over-year growth 2025-2030 (%)
Data Table on Japan - Year-over-year growth 2025-2030 (%)

12.4.3 India - Market size and forecast 2025-2030

Chart on India - Market size and forecast 2025-2030 ($ million)
Data Table on India - Market size and forecast 2025-2030 ($ million)
Chart on India - Year-over-year growth 2025-2030 (%)
Data Table on India - Year-over-year growth 2025-2030 (%)

12.4.4 South Korea - Market size and forecast 2025-2030

Chart on South Korea - Market size and forecast 2025-2030 ($ million)
Data Table on South Korea - Market size and forecast 2025-2030 ($ million)
Chart on South Korea - Year-over-year growth 2025-2030 (%)
Data Table on South Korea - Year-over-year growth 2025-2030 (%)

12.4.5 Australia - Market size and forecast 2025-2030

Chart on Australia - Market size and forecast 2025-2030 ($ million)
Data Table on Australia - Market size and forecast 2025-2030 ($ million)
Chart on Australia - Year-over-year growth 2025-2030 (%)
Data Table on Australia - Year-over-year growth 2025-2030 (%)

12.4.6 Indonesia - Market size and forecast 2025-2030

Chart on Indonesia - Market size and forecast 2025-2030 ($ million)
Data Table on Indonesia - Market size and forecast 2025-2030 ($ million)
Chart on Indonesia - Year-over-year growth 2025-2030 (%)
Data Table on Indonesia - Year-over-year growth 2025-2030 (%)

12.5 North America - Market size and forecast 2025-2030

Chart on North America - Market size and forecast 2025-2030 ($ million)
Data Table on North America - Market size and forecast 2025-2030 ($ million)
Chart on North America - Year-over-year growth 2025-2030 (%)
Data Table on North America - Year-over-year growth 2025-2030 (%)
Chart on Regional Comparison - North America
Data Table on Regional Comparison - North America

12.5.1 US - Market size and forecast 2025-2030

Chart on US - Market size and forecast 2025-2030 ($ million)
Data Table on US - Market size and forecast 2025-2030 ($ million)
Chart on US - Year-over-year growth 2025-2030 (%)
Data Table on US - Year-over-year growth 2025-2030 (%)

12.5.2 Canada - Market size and forecast 2025-2030

Chart on Canada - Market size and forecast 2025-2030 ($ million)
Data Table on Canada - Market size and forecast 2025-2030 ($ million)
Chart on Canada - Year-over-year growth 2025-2030 (%)
Data Table on Canada - Year-over-year growth 2025-2030 (%)

12.5.3 Mexico - Market size and forecast 2025-2030

Chart on Mexico - Market size and forecast 2025-2030 ($ million)
Data Table on Mexico - Market size and forecast 2025-2030 ($ million)
Chart on Mexico - Year-over-year growth 2025-2030 (%)
Data Table on Mexico - Year-over-year growth 2025-2030 (%)

12.6 South America - Market size and forecast 2025-2030

Chart on South America - Market size and forecast 2025-2030 ($ million)
Data Table on South America - Market size and forecast 2025-2030 ($ million)
Chart on South America - Year-over-year growth 2025-2030 (%)
Data Table on South America - Year-over-year growth 2025-2030 (%)
Chart on Regional Comparison - South America
Data Table on Regional Comparison - South America

12.6.1 Brazil - Market size and forecast 2025-2030

Chart on Brazil - Market size and forecast 2025-2030 ($ million)
Data Table on Brazil - Market size and forecast 2025-2030 ($ million)
Chart on Brazil - Year-over-year growth 2025-2030 (%)
Data Table on Brazil - Year-over-year growth 2025-2030 (%)

12.6.2 Argentina - Market size and forecast 2025-2030

Chart on Argentina - Market size and forecast 2025-2030 ($ million)
Data Table on Argentina - Market size and forecast 2025-2030 ($ million)
Chart on Argentina - Year-over-year growth 2025-2030 (%)
Data Table on Argentina - Year-over-year growth 2025-2030 (%)

12.6.3 Chile - Market size and forecast 2025-2030

Chart on Chile - Market size and forecast 2025-2030 ($ million)
Data Table on Chile - Market size and forecast 2025-2030 ($ million)
Chart on Chile - Year-over-year growth 2025-2030 (%)
Data Table on Chile - Year-over-year growth 2025-2030 (%)

12.7 Middle East and Africa - Market size and forecast 2025-2030

Chart on Middle East and Africa - Market size and forecast 2025-2030 ($ million)
Data Table on Middle East and Africa - Market size and forecast 2025-2030 ($ million)
Chart on Middle East and Africa - Year-over-year growth 2025-2030 (%)
Data Table on Middle East and Africa - Year-over-year growth 2025-2030 (%)
Chart on Regional Comparison - Middle East and Africa
Data Table on Regional Comparison - Middle East and Africa

12.7.1 Saudi Arabia - Market size and forecast 2025-2030

Chart on Saudi Arabia - Market size and forecast 2025-2030 ($ million)
Data Table on Saudi Arabia - Market size and forecast 2025-2030 ($ million)
Chart on Saudi Arabia - Year-over-year growth 2025-2030 (%)
Data Table on Saudi Arabia - Year-over-year growth 2025-2030 (%)

12.7.2 UAE - Market size and forecast 2025-2030

Chart on UAE - Market size and forecast 2025-2030 ($ million)
Data Table on UAE - Market size and forecast 2025-2030 ($ million)
Chart on UAE - Year-over-year growth 2025-2030 (%)
Data Table on UAE - Year-over-year growth 2025-2030 (%)

12.7.3 South Africa - Market size and forecast 2025-2030

Chart on South Africa - Market size and forecast 2025-2030 ($ million)
Data Table on South Africa - Market size and forecast 2025-2030 ($ million)
Chart on South Africa - Year-over-year growth 2025-2030 (%)
Data Table on South Africa - Year-over-year growth 2025-2030 (%)

12.7.4 Israel - Market size and forecast 2025-2030

Chart on Israel - Market size and forecast 2025-2030 ($ million)
Data Table on Israel - Market size and forecast 2025-2030 ($ million)
Chart on Israel - Year-over-year growth 2025-2030 (%)
Data Table on Israel - Year-over-year growth 2025-2030 (%)

12.7.5 Turkey - Market size and forecast 2025-2030

Chart on Turkey - Market size and forecast 2025-2030 ($ million)
Data Table on Turkey - Market size and forecast 2025-2030 ($ million)
Chart on Turkey - Year-over-year growth 2025-2030 (%)
Data Table on Turkey - Year-over-year growth 2025-2030 (%)

12.8 Market opportunity by geography

Market opportunity by geography ($ million)
Data Tables on Market opportunity by geography ($ million)

13. Drivers, Challenges, and Opportunity

13.1 Market drivers

Rising interest in heritage and cultural experiences worldwide
Increasing disposable income and growing middle class travellers
Expansion of global air connectivity and travel accessibility

13.2 Market challenges

Seasonality issues affecting tourist inflow across destinations
Over tourism pressure on heritage sites and local infrastructure
Geopolitical instability impacting international travel confidence levels

13.3 Impact of drivers and challenges

Impact of drivers and challenges in 2025 and 2030

13.4 Market opportunities

Growing demand for authentic local cultural immersion experiences
Rise of digital booking platforms and virtual tour experiences
Increasing preference for sustainable and responsible tourism practices

14. Competitive Landscape

14.1 Overview

14.2

Overview on criticality of inputs and factors of differentiation

14.3 Landscape disruption

Overview on factors of disruption

14.4 Industry risks

Impact of key risks on business

15. Competitive Analysis

15.1 Companies profiled

Companies covered

15.2 Company ranking index

15.3 Market positioning of companies

Matrix on companies position and classification

15.4 Airbnb Inc.

Airbnb Inc. - Overview
Airbnb Inc. - Product / Service
Airbnb Inc. - Key offerings
SWOT

15.5 Booking Holdings Inc.

Booking Holdings Inc. - Overview
Booking Holdings Inc. - Product / Service
Booking Holdings Inc. - Key offerings
SWOT

15.6 Collette Travel Service Inc.

Collette Travel Service Inc. - Overview
Collette Travel Service Inc. - Product / Service
Collette Travel Service Inc. - Key offerings
SWOT

15.7 EF Education First Ltd.

EF Education First Ltd. - Overview
EF Education First Ltd. - Product / Service
EF Education First Ltd. - Key offerings
SWOT

15.8 Exodus Travels Ltd.

Exodus Travels Ltd. - Overview
Exodus Travels Ltd. - Product / Service
Exodus Travels Ltd. - Key offerings
SWOT

15.9 Expedia Group Inc.

Expedia Group Inc. - Overview
Expedia Group Inc. - Business segments
Expedia Group Inc. - Key offerings
Expedia Group Inc. - Segment focus
SWOT

15.10 G Adventures Inc.

G Adventures Inc. - Overview
G Adventures Inc. - Product / Service
G Adventures Inc. - Key offerings
SWOT

15.11 GetYourGuide GmbH

GetYourGuide GmbH - Overview
GetYourGuide GmbH - Product / Service
GetYourGuide GmbH - Key offerings
SWOT

15.12 Intrepid Group Pty Ltd.

Intrepid Group Pty Ltd. - Overview
Intrepid Group Pty Ltd. - Product / Service
Intrepid Group Pty Ltd. - Key offerings
SWOT

15.13 Tauck Inc.

Tauck Inc. - Overview
Tauck Inc. - Product / Service
Tauck Inc. - Key offerings
SWOT

15.14 The Travel Corp.

The Travel Corp. - Overview
The Travel Corp. - Product / Service
The Travel Corp. - Key offerings
SWOT

15.15 TripAdvisor Inc.

TripAdvisor Inc. - Overview
TripAdvisor Inc. - Business segments
TripAdvisor Inc. - Key offerings
TripAdvisor Inc. - Segment focus
SWOT

15.16 TUI AG

TUI AG - Overview
TUI AG - Business segments
TUI AG - Key offerings
TUI AG - Segment focus
SWOT

15.17 Viking Cruises

Viking Cruises - Overview
Viking Cruises - Product / Service
Viking Cruises - Key offerings
SWOT

15.18 Zicasso Inc.

Zicasso Inc. - Overview
Zicasso Inc. - Product / Service
Zicasso Inc. - Key offerings
SWOT

16. Appendix

16.1 Scope of the report

Market definition
Objectives
Notes and caveats

16.2 Inclusions and exclusions checklist

Inclusions checklist
Exclusions checklist

16.3 Currency conversion rates for US$

16.4 Research methodology

16.5 Data procurement

Information sources

16.6 Data validation

16.7 Validation techniques employed for market sizing

16.8 Data synthesis

16.9 360 degree market analysis

16.10 List of abbreviations

Research Methodology

Technavio presents a detailed picture of the market by way of study, synthesis, and summation of data from multiple sources. The analysts have presented the various facets of the market with a particular focus on identifying the key industry influencers. The data thus presented is comprehensive, reliable, and the result of extensive research, both primary and secondary.

INFORMATION SOURCES

Primary sources

  • Manufacturers and suppliers
  • Channel partners
  • Industry experts
  • Strategic decision makers

Secondary sources

  • Industry journals and periodicals
  • Government data
  • Financial reports of key industry players
  • Historical data
  • Press releases

DATA ANALYSIS

Data Synthesis

  • Collation of data
  • Estimation of key figures
  • Analysis of derived insights

Data Validation

  • Triangulation with data models
  • Reference against proprietary databases
  • Corroboration with industry experts

REPORT WRITING

Qualitative

  • Market drivers
  • Market challenges
  • Market trends
  • Five forces analysis

Quantitative

  • Market size and forecast
  • Market segmentation
  • Geographical insights
  • Competitive landscape

Interested in this report?

Get your sample now to see our research methodology and insights!

Download Now

Frequently Asked Questions

Cultural Tourism market growth will increase by USD 12878.9 million during 2026-2030.

The Cultural Tourism market is expected to grow at a CAGR of 22.3% during 2026-2030.

Cultural Tourism market is segmented by Type (Domestic cultural tourism, International cultural tourism) Service (Cultural eco-tourism, Indigenous cultural tourism, Socio-cultural tourism) Application (Leisure, Religious pilgrimage, Education, Research)

Airbnb Inc., Booking Holdings Inc., Butterfield and Robinson Inc., Collette Travel Service Inc., Context Travel LLC, EF Education First Ltd., Exodus Travels Ltd., Expedia Group Inc., G Adventures Inc., GetYourGuide GmbH, Grand Circle LLC, Intrepid Group Pty Ltd., Tauck Inc., The Travel Corp., TripAdvisor Inc., TUI AG, Viking Cruises, Zicasso Inc. are a few of the key vendors in the Cultural Tourism market.

Europe will register the highest growth rate of 40.7% among the other regions. Therefore, the Cultural Tourism market in Europe is expected to garner significant business opportunities for the vendors during the forecast period.

Germany, UK, France, Italy, Spain, The Netherlands, China, Japan, India, South Korea, Australia, Indonesia, US, Canada, Mexico, Brazil, Argentina, Chile, Saudi Arabia, UAE, South Africa, Israel, Turkey

  • Rising interest in heritage and cultural experiences worldwide is the driving factor this market.

The Cultural Tourism market vendors should focus on grabbing business opportunities from the Type segment as it accounted for the largest market share in the base year.
RIA - Research AI Assistant
Ask RIA