Corporate Wellness Market Analysis, Size, and Forecast 2026-2030: North America (US, Canada, and Mexico), Europe (Germany, UK, and France), APAC (China, Japan, and India), South America (Brazil and Argentina), Middle East and Africa (Saudi Arabia, UAE, and South Africa), and Rest of World (ROW)

Corporate Wellness Market Analysis, Size, and Forecast 2026-2030:
North America (US, Canada, and Mexico), Europe (Germany, UK, and France), APAC (China, Japan, and India), South America (Brazil and Argentina), Middle East and Africa (Saudi Arabia, UAE, and South Africa), and Rest of World (ROW)

Published: Apr 2026 285 Pages SKU: IRTNTR44158

Market Overview at a Glance

$45.48 B
Market Opportunity
9.6%
CAGR 2025 - 2030
39%
North America Growth
$36.26 B
Health risk assessment segment 2024

Corporate Wellness Market Size 2026-2030

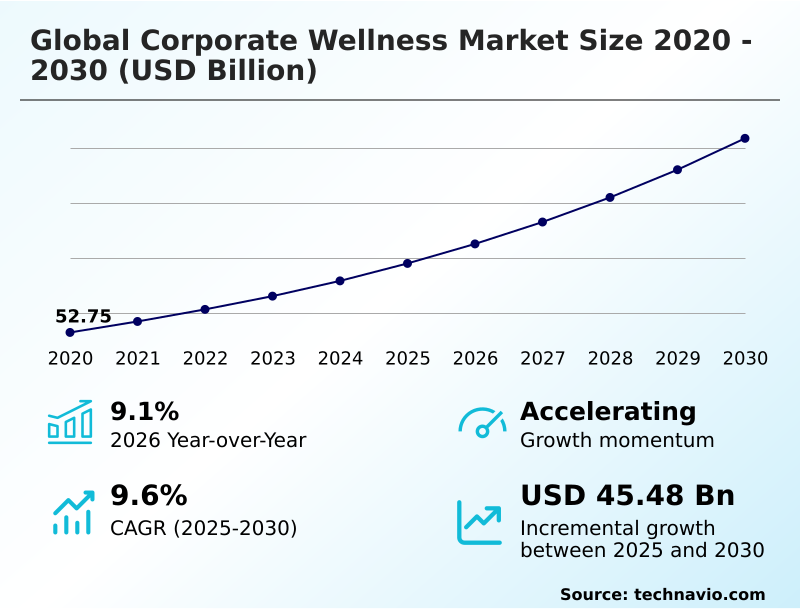
The corporate wellness market size is valued to increase by USD 45.48 billion, at a CAGR of 9.6% from 2025 to 2030. Maturation of agentic AI and hyper-personalized wellness ecosystems will drive the corporate wellness market.

Major Market Trends & Insights

  • North America dominated the market and accounted for a 39% growth during the forecast period.
  • By Application - Health risk assessment segment was valued at USD 36.26 billion in 2024
  • By End-user - SMEs segment accounted for the largest market revenue share in 2024

Market Size & Forecast

  • Market Opportunities: USD 70.58 billion
  • Market Future Opportunities: USD 45.48 billion
  • CAGR from 2025 to 2030 : 9.6%

Market Summary

  • The Corporate Wellness Market is transitioning from a set of discretionary benefits to an integral component of enterprise strategy, driven by advanced technology and a holistic view of employee health. This evolution is marked by the integration of agentic artificial intelligence into platforms, enabling autonomous, hyper-personalized navigation of employee wellness journeys.
  • For instance, in a large multinational logistics firm, AI-driven platforms can analyze real-time data from wearables and calendar activity to predict burnout risk among drivers and warehouse staff, automatically suggesting schedule adjustments or offering access to real-time stress management tools. This proactive approach moves beyond traditional annual health assessments.
  • The market is also heavily influenced by a global push toward codifying psychosocial risk management, forcing organizations to treat mental health as a mandatory compliance issue.
  • Consequently, there is a growing demand for evidence-based solutions that can demonstrate a clear return on investment by reducing absenteeism, improving productivity, and fostering a resilient workforce, making corporate wellness a critical pillar of modern human capital management. This shift underscores the strategic importance of investing in technologies that support both individual wellbeing and organizational stability.

What will be the Size of the Corporate Wellness Market during the forecast period?

Get Key Insights on Market Forecast (PDF) Request Free Sample

How is the Corporate Wellness Market Segmented?

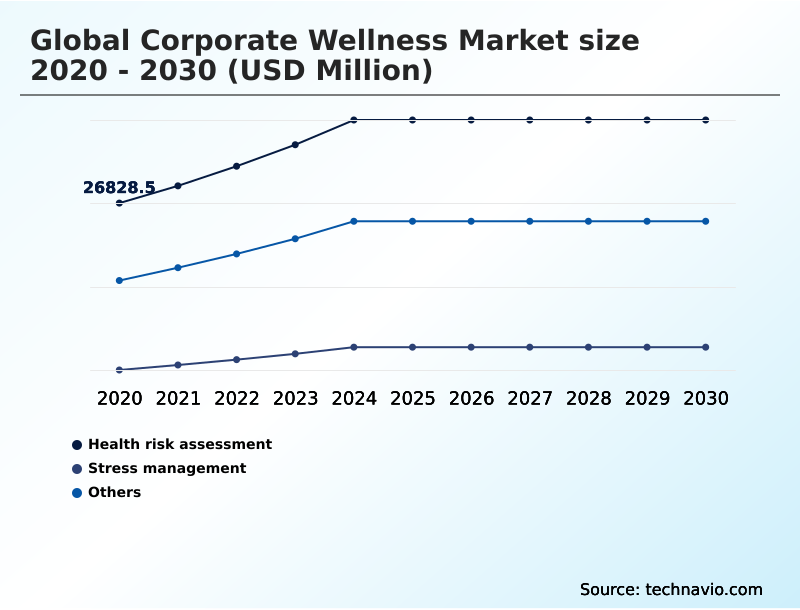
The corporate wellness industry research report provides comprehensive data (region-wise segment analysis), with forecasts and estimates in "USD million" for the period 2026-2030, as well as historical data from 2020-2024 for the following segments.

  • Application
    • Health risk assessment
    • Stress management
    • Others
  • End-user
    • SMEs
    • Large organizations
  • Delivery mode
    • Onsite
    • Offsite
  • Geography
    • North America
      • US
      • Canada
      • Mexico
    • Europe
      • Germany
      • UK
      • France
    • APAC
      • China
      • Japan
      • India
    • South America
      • Brazil
      • Argentina
    • Middle East and Africa
      • Saudi Arabia
      • UAE
      • South Africa
    • Rest of World (ROW)

By Application Insights

The health risk assessment segment is estimated to witness significant growth during the forecast period.

The health risk assessment segment is the foundational component of modern corporate wellness platforms, serving as the primary mechanism for diagnostic-led wellness.

These assessments go beyond simple biometric screenings by collecting and analyzing data to create personalized health pathways for employees. This initial data-gathering phase informs all subsequent lifestyle medicine interventions and is critical for continuous data-driven optimization of health outcomes.

By centralizing this wellness data, organizations can more effectively design value-based care programs aimed at mitigating absenteeism costs.

Firms using this approach report that data-driven, diagnostic-led wellness achieves engagement rates up to 64% higher than traditional programs, which is a key factor in improving employee retention strategies and demonstrating the value of human capital investment.

Request Free Sample

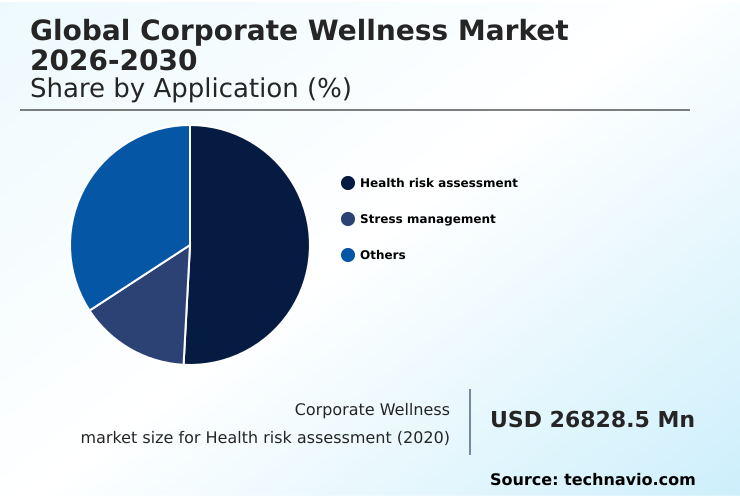
The Health risk assessment segment was valued at USD 36.26 billion in 2024 and showed a gradual increase during the forecast period.

Request Free Sample

Regional Analysis

North America is estimated to contribute 39% to the growth of the global market during the forecast period.Technavio’s analysts have elaborately explained the regional trends and drivers that shape the market during the forecast period.

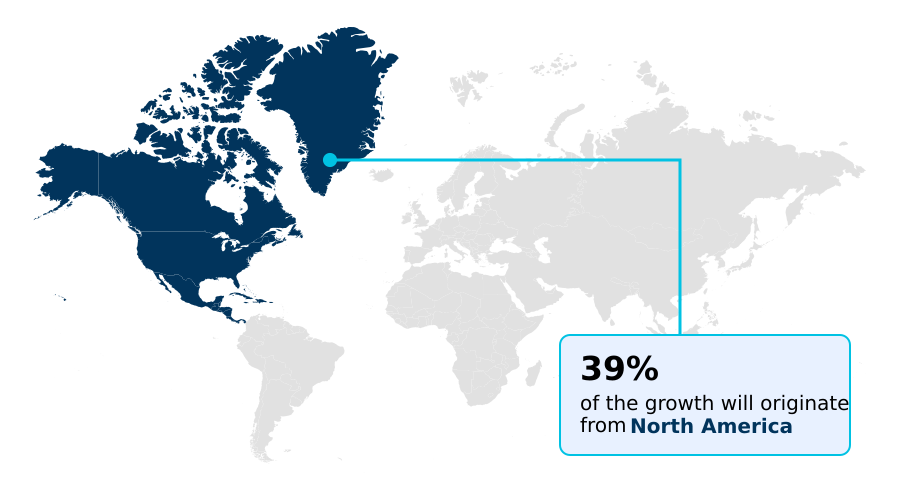
See How Corporate Wellness Market Demand is Rising in North America Request Free Sample

The market's geographic landscape is diverse, with North America representing the largest share of opportunity at nearly 39%, driven by the aggressive adoption of unified health navigation platforms and a focus on enterprise risk management.

European markets are heavily influenced by regulatory pressures, leading to a surge in platforms addressing psychosocial risk management.

The APAC region, contributing over 25% of the market opportunity, is the fastest-growing geography, characterized by a mobile-first approach to offsite digital wellness and the rapid adoption of digital meal benefits.

Across regions, there is a consistent move towards holistic population health management, integrating real-time stress management, dynamic nutrition planning, and financial wellness coaching to create comprehensive employee support systems, often supported by onsite wellness coordinators and incentive-based employee health programs.

Market Dynamics

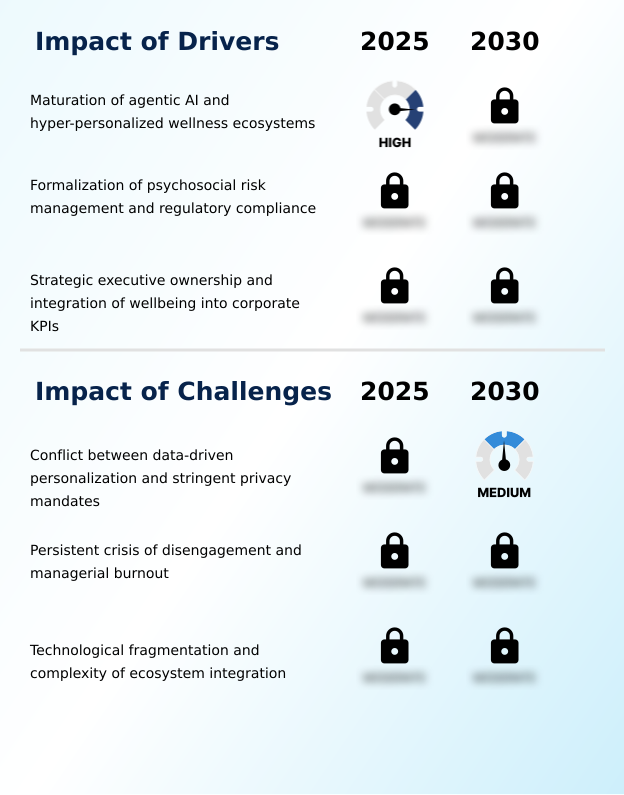
Our researchers analyzed the data with 2025 as the base year, along with the key drivers, trends, and challenges. A holistic analysis of drivers will help companies refine their marketing strategies to gain a competitive advantage.

  • The strategic discourse within boardrooms is increasingly focused on the ROI of corporate wellness programs, moving beyond simple benefit provision to a core component of business strategy. A central theme is the impact of agentic AI on employee wellness, which promises hyper-personalization at scale but raises questions about the ethical considerations of AI in employee health.
  • The role of leadership in employee wellbeing is now seen as paramount for building a culture of health and resilience, especially as organizations grapple with strategies for addressing managerial burnout.
  • The future of corporate wellness with generative AI is a frequent topic, particularly its application in using predictive analytics for employee burnout and enhancing the effectiveness of digital health coaching platforms.
  • Simultaneously, executives are tasked with managing psychosocial risks in the workplace and ensuring compliance with ISO 45003 for psychosocial risk, which is now a non-negotiable aspect of corporate wellness and enterprise risk management.
  • The challenge lies in balancing personalization with data privacy regulations while also integrating mental health in corporate strategy through the implementation of stepped care pathways for mental health. Firms that successfully integrate these elements see significantly better outcomes in employee retention than those that do not.
  • For many, the primary hurdle remains overcoming the challenges of integrating fragmented wellness apps and finding effective corporate wellness solutions for remote workforce models. The focus on nutrition-led interventions for chronic disease prevention and analyzing technology's role in improving employee engagement are key to demonstrating evidence-based outcomes in corporate wellness.
  • This is particularly relevant when deploying wellness platforms in small and medium enterprises, where resource constraints make measuring the financial impact of employee disengagement a critical priority.

What are the key market drivers leading to the rise in the adoption of Corporate Wellness Industry?

  • The maturation of agentic AI is a key driver, enabling hyper-personalized wellness ecosystems that deliver autonomous, real-time support.

  • The rapid integration of agentic artificial intelligence is a primary driver, enabling autonomous and personalized employee health navigation that achieves engagement rates up to 64% higher than traditional programs.
  • Another critical driver is the formalization of psychosocial risk management through regulatory compliance for wellness, with firms adopting modular wellness modules to align with global standards.
  • This shift elevates employee wellbeing as a KPI tied to corporate governance in health, with demand increasing for evidence-based wellness solutions that connect to corporate sustainability reporting.
  • Furthermore, a shift in executive mindset sees workforce resilience as a core human capital investment, with 58% of CEOs now agreeing it is a critical driver of profitability.
  • This strategic workforce planning approach solidifies the need for platforms demonstrating a clear return on investment in wellness.

What are the market trends shaping the Corporate Wellness Industry?

  • A key market trend is the shift toward structured, stepped care pathways. This evolution involves creating integrated mental health journeys for employees.

  • A dominant trend is the move toward structured, longitudinal stepped care pathways, creating integrated mental health journeys that escalate from digital self-help resources to professional support. This evolution toward human-led, digital, and AI-powered solutions is exemplified by platforms serving 28 million customers with immediate behavioral health access.
  • The deep integration of agentic artificial intelligence enables predictive burnout analytics, with some systems using digital tone analysis and calendar data to identify at-risk teams. Firms now track time-to-first-consult as a primary performance metric.
  • Another key shift is the convergence with lifestyle medicine interventions, where medical-grade interventions and emotional support AI coaches are used to address chronic conditions, moving beyond reactive care to proactive, data-driven health management and workplace mental health support.

What challenges does the Corporate Wellness Industry face during its growth?

  • A primary challenge is the inherent conflict between delivering data-driven personalization and navigating the complexities of stringent global privacy mandates.

  • A foremost challenge is the conflict between data-driven personalization in health and stringent privacy mandates, which complicates the use of biometric screenings and creates risks of penalties up to 7% of global turnover. This limits the full potential of hyper-personalization by restricting biometric data privacy.
  • A second major challenge is the crisis of disengagement, with engagement rates falling to 20%, a problem compounded by poor manager engagement and wellness. Finally, technological fragmentation hinders progress; siloed applications prevent seamless ecosystem integration and require a shift toward an interoperable wellbeing-as-a-service model.
  • Overcoming technical debt and data silos through tools like asynchronous communication tools is crucial for building the interoperable wellness ecosystems needed to address these issues effectively.

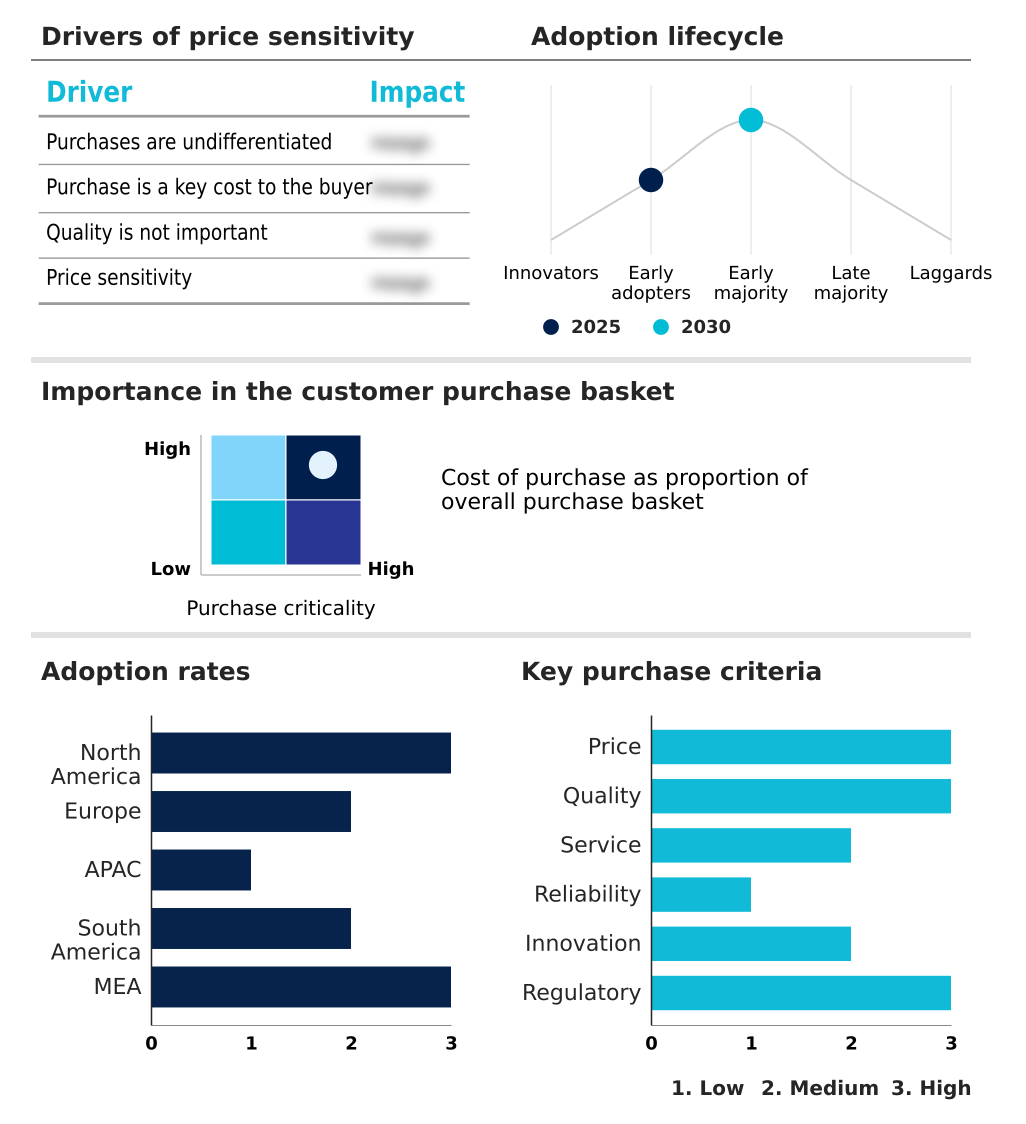
Exclusive Technavio Analysis on Customer Landscape

The corporate wellness market forecasting report includes the adoption lifecycle of the market, covering from the innovator’s stage to the laggard’s stage. It focuses on adoption rates in different regions based on penetration. Furthermore, the corporate wellness market report also includes key purchase criteria and drivers of price sensitivity to help companies evaluate and develop their market growth analysis strategies.

Customer Landscape of Corporate Wellness Industry

Competitive Landscape

Companies are implementing various strategies, such as strategic alliances, corporate wellness market forecast, partnerships, mergers and acquisitions, geographical expansion, and product/service launches, to enhance their presence in the industry.

Aduro LLC - Delivering integrated digital coaching and holistic employee wellness solutions through a unified engagement platform.

The industry research and growth report includes detailed analyses of the competitive landscape of the market and information about key companies, including:

  • Aduro LLC
  • ComPsych Corp.
  • CoreHealth Technologies Inc
  • Corporate Wellness Inc
  • Exos Works Inc.
  • Google LLC
  • Marathon Health LLC
  • Marino Wellness LLC
  • Optum Inc.
  • Personify Health Inc.
  • Premise Health
  • Privia Health Group Inc.
  • Quest Diagnostics Inc.
  • SOL Wellness LLC
  • Sonic Boom Wellness Inc
  • The Cigna Group
  • TotalWellness Health
  • Truworth Wellness
  • Vitality Group LLC
  • Wellable Inc

Qualitative and quantitative analysis of companies has been conducted to help clients understand the wider business environment as well as the strengths and weaknesses of key industry players. Data is qualitatively analyzed to categorize companies as pure play, category-focused, industry-focused, and diversified; it is quantitatively analyzed to categorize companies as dominant, leading, strong, tentative, and weak.

Recent Development and News in Corporate wellness market

  • In August 2025, the European Union entered a critical implementation phase of the AI Act, specifically regulating general-purpose models that underpin many wellness platforms and forcing companies to provide transparency regarding training data and algorithmic intent.
  • In May 2025, Whoop launched its Whoop 5.0 and Whoop MG device, providing enterprises with advanced wearable technology for conducting continuous fitness assessments and strain monitoring, enabling a data-driven approach to physical readiness.
  • In April 2025, the United States Department of Justice implemented the Bulk Data Rule, which created a substantial barrier for global wellness providers by restricting how personal health data can be processed by foreign entities.
  • In February 2025, MyFitnessPal launched its 2025 Winter Release, introducing advanced habit-tracking features that allow corporate users to build personalized nutrition plans and monitor dietary progress through self-service digital tools.

Dive into Technavio’s robust research methodology, blending expert interviews, extensive data synthesis, and validated models for unparalleled Corporate Wellness Market insights. See full methodology.

Market Scope
Page number 285
Base year 2025
Historic period 2020-2024
Forecast period 2026-2030
Growth momentum & CAGR Accelerate at a CAGR of 9.6%
Market growth 2026-2030 USD 45484.6 million
Market structure Fragmented
YoY growth 2025-2026(%) 9.1%
Key countries US, Canada, Mexico, Germany, UK, France, Italy, Spain, The Netherlands, China, Japan, India, South Korea, Australia, Indonesia, Brazil, Argentina, Chile, Saudi Arabia, UAE, South Africa, Israel and Turkey
Competitive landscape Leading Companies, Market Positioning of Companies, Competitive Strategies, and Industry Risks

Request Free Sample

Research Analyst Overview

  • The market is undergoing a profound transformation, driven by the maturation of agentic artificial intelligence and the need for autonomous health management. Modern platforms now offer hyper-personalized wellness through digital health navigation and virtual health coaches, providing real-time stress management and dynamic nutrition planning. This shift supports the broader goal of human capital investment and improving workforce resilience.
  • However, a persistent crisis of disengagement, where engagement recently fell to 20%, remains a central boardroom concern. To combat this, leading firms are implementing stepped care pathways and evidence-based wellness solutions that integrate lifestyle medicine interventions and behavioral science interventions. The use of predictive burnout analytics, often informed by digital tone analysis and cognitive performance data, is becoming standard.
  • These systems are part of a move toward continuous data-driven optimization, leveraging biometric screenings and health risk assessments for personalized health pathways. This focus on occupational health and safety is now a key part of enterprise risk management and corporate sustainability reporting.
  • The integration of modular wellness modules, digital meal benefits, and employee assistance programs into an interoperable wellbeing-as-a-service model addresses technological fragmentation. This ecosystem integration is vital for delivering medical-grade interventions and emotional support AI coaches, though it must navigate stringent privacy mandates to succeed.

What are the Key Data Covered in this Corporate Wellness Market Research and Growth Report?

  • What is the expected growth of the Corporate Wellness Market between 2026 and 2030?

    • USD 45.48 billion, at a CAGR of 9.6%

  • What segmentation does the market report cover?

    • The report is segmented by Application (Health risk assessment, Stress management, and Others), End-user (SMEs, and Large organizations), Delivery Mode (Onsite, and Offsite) and Geography (North America, Europe, APAC, South America, Middle East and Africa)

  • Which regions are analyzed in the report?

    • North America, Europe, APAC, South America and Middle East and Africa

  • What are the key growth drivers and market challenges?

    • Maturation of agentic AI and hyper-personalized wellness ecosystems, Conflict between data-driven personalization and stringent privacy mandates

  • Who are the major players in the Corporate Wellness Market?

    • Aduro LLC, ComPsych Corp., CoreHealth Technologies Inc, Corporate Wellness Inc, Exos Works Inc., Google LLC, Marathon Health LLC, Marino Wellness LLC, Optum Inc., Personify Health Inc., Premise Health, Privia Health Group Inc., Quest Diagnostics Inc., SOL Wellness LLC, Sonic Boom Wellness Inc, The Cigna Group, TotalWellness Health, Truworth Wellness, Vitality Group LLC and Wellable Inc

Market Research Insights

  • Market dynamics are being reshaped by the strategic imperative to treat employee wellbeing as a key performance indicator, directly linked to corporate governance and employee retention strategies. The deployment of unified health navigation platforms that centralize wellness data is proving effective, with some systems achieving engagement rates up to 64% higher than legacy programs.
  • However, a persistent crisis of disengagement, where overall employee engagement has fallen to 20%, highlights the gap between available tools and meaningful adoption. This challenge is compounded by manager burnout, which hinders the effective rollout of workplace mental health support.
  • Successful strategies now focus on creating interoperable wellness ecosystems that integrate everything from financial wellness coaching to asynchronous communication tools, demonstrating a clear return on investment in wellness by mitigating absenteeism costs.

We can help! Our analysts can customize this corporate wellness market research report to meet your requirements.

Get in touch

1. Executive Summary

1.1 Market overview

Executive Summary - Chart on Market Overview
Executive Summary - Data Table on Market Overview
Executive Summary - Chart on Global Market Characteristics
Executive Summary - Chart on Market by Geography
Executive Summary - Chart on Market Segmentation by Application
Executive Summary - Chart on Market Segmentation by End-user
Executive Summary - Chart on Market Segmentation by Delivery Mode
Executive Summary - Chart on Incremental Growth
Executive Summary - Data Table on Incremental Growth
Executive Summary - Chart on Company Market Positioning

2. Technavio Analysis

2.1 Analysis of price sensitivity, lifecycle, customer purchase basket, adoption rates, and purchase criteria

2.2 Criticality of inputs and Factors of differentiation

Chart on Overview on criticality of inputs and factors of differentiation

2.3 Factors of disruption

Chart on Overview on factors of disruption

2.4 Impact of drivers and challenges

Chart on Impact of drivers and challenges in 2025 and 2030

3. Market Landscape

3.1 Market ecosystem

Chart on Parent Market
Data Table on - Parent Market

3.2 Market characteristics

Chart on Market characteristics analysis

3.3 Value chain analysis

Chart on Value chain analysis

4. Market Sizing

4.1 Market definition

Data Table on Offerings of companies included in the market definition

4.2 Market segment analysis

Market segments

4.3 Market size 2025

4.4 Market outlook: Forecast for 2025-2030

Chart on Global - Market size and forecast 2025-2030 ($ million)
Data Table on Global - Market size and forecast 2025-2030 ($ million)
Chart on Global Market: Year-over-year growth 2025-2030 (%)
Data Table on Global Market: Year-over-year growth 2025-2030 (%)

5. Historic Market Size

5.1 Global Corporate Wellness Market 2020 - 2024

Historic Market Size - Data Table on Global Corporate Wellness Market 2020 - 2024 ($ million)

5.2 Application segment analysis 2020 - 2024

Historic Market Size - Application Segment 2020 - 2024 ($ million)

5.3 End-user segment analysis 2020 - 2024

Historic Market Size - End-user Segment 2020 - 2024 ($ million)

5.4 Delivery Mode segment analysis 2020 - 2024

Historic Market Size - Delivery Mode Segment 2020 - 2024 ($ million)

5.5 Geography segment analysis 2020 - 2024

Historic Market Size - Geography Segment 2020 - 2024 ($ million)

5.6 Country segment analysis 2020 - 2024

Historic Market Size - Country Segment 2020 - 2024 ($ million)

6. Qualitative Analysis

6.1 Impact of AI on Global Corporate Wellness Market

6.2 Impact of Geopolitical Conflict on Global Corporate Wellness Market

7. Five Forces Analysis

7.1 Five forces summary

Five forces analysis - Comparison between 2025 and 2030

7.2 Bargaining power of buyers

Bargaining power of buyers - Impact of key factors 2025 and 2030

7.3 Bargaining power of suppliers

Bargaining power of suppliers - Impact of key factors in 2025 and 2030

7.4 Threat of new entrants

Threat of new entrants - Impact of key factors in 2025 and 2030

7.5 Threat of substitutes

Threat of substitutes - Impact of key factors in 2025 and 2030

7.6 Threat of rivalry

Threat of rivalry - Impact of key factors in 2025 and 2030

7.7 Market condition

Chart on Market condition - Five forces 2025 and 2030

8. Market Segmentation by Application

8.1 Market segments

Chart on Application - Market share 2025-2030 (%)
Data Table on Application - Market share 2025-2030 (%)

8.2 Comparison by Application

Chart on Comparison by Application
Data Table on Comparison by Application

8.3 Health risk assessment - Market size and forecast 2025-2030

Chart on Health risk assessment - Market size and forecast 2025-2030 ($ million)
Data Table on Health risk assessment - Market size and forecast 2025-2030 ($ million)
Chart on Health risk assessment - Year-over-year growth 2025-2030 (%)
Data Table on Health risk assessment - Year-over-year growth 2025-2030 (%)

8.4 Stress management - Market size and forecast 2025-2030

Chart on Stress management - Market size and forecast 2025-2030 ($ million)
Data Table on Stress management - Market size and forecast 2025-2030 ($ million)
Chart on Stress management - Year-over-year growth 2025-2030 (%)
Data Table on Stress management - Year-over-year growth 2025-2030 (%)

8.5 Others - Market size and forecast 2025-2030

Chart on Others - Market size and forecast 2025-2030 ($ million)
Data Table on Others - Market size and forecast 2025-2030 ($ million)
Chart on Others - Year-over-year growth 2025-2030 (%)
Data Table on Others - Year-over-year growth 2025-2030 (%)

8.6 Market opportunity by Application

Market opportunity by Application ($ million)
Data Table on Market opportunity by Application ($ million)

9. Market Segmentation by End-user

9.1 Market segments

Chart on End-user - Market share 2025-2030 (%)
Data Table on End-user - Market share 2025-2030 (%)

9.2 Comparison by End-user

Chart on Comparison by End-user
Data Table on Comparison by End-user

9.3 SMEs - Market size and forecast 2025-2030

Chart on SMEs - Market size and forecast 2025-2030 ($ million)
Data Table on SMEs - Market size and forecast 2025-2030 ($ million)
Chart on SMEs - Year-over-year growth 2025-2030 (%)
Data Table on SMEs - Year-over-year growth 2025-2030 (%)

9.4 Large organizations - Market size and forecast 2025-2030

Chart on Large organizations - Market size and forecast 2025-2030 ($ million)
Data Table on Large organizations - Market size and forecast 2025-2030 ($ million)
Chart on Large organizations - Year-over-year growth 2025-2030 (%)
Data Table on Large organizations - Year-over-year growth 2025-2030 (%)

9.5 Market opportunity by End-user

Market opportunity by End-user ($ million)
Data Table on Market opportunity by End-user ($ million)

10. Market Segmentation by Delivery Mode

10.1 Market segments

Chart on Delivery Mode - Market share 2025-2030 (%)
Data Table on Delivery Mode - Market share 2025-2030 (%)

10.2 Comparison by Delivery Mode

Chart on Comparison by Delivery Mode
Data Table on Comparison by Delivery Mode

10.3 Onsite - Market size and forecast 2025-2030

Chart on Onsite - Market size and forecast 2025-2030 ($ million)
Data Table on Onsite - Market size and forecast 2025-2030 ($ million)
Chart on Onsite - Year-over-year growth 2025-2030 (%)
Data Table on Onsite - Year-over-year growth 2025-2030 (%)

10.4 Offsite - Market size and forecast 2025-2030

Chart on Offsite - Market size and forecast 2025-2030 ($ million)
Data Table on Offsite - Market size and forecast 2025-2030 ($ million)
Chart on Offsite - Year-over-year growth 2025-2030 (%)
Data Table on Offsite - Year-over-year growth 2025-2030 (%)

10.5 Market opportunity by Delivery Mode

Market opportunity by Delivery Mode ($ million)
Data Table on Market opportunity by Delivery Mode ($ million)

11. Customer Landscape

11.1 Customer landscape overview

Analysis of price sensitivity, lifecycle, customer purchase basket, adoption rates, and purchase criteria

12. Geographic Landscape

12.1 Geographic segmentation

Chart on Market share by geography 2025-2030 (%)
Data Table on Market share by geography 2025-2030 (%)

12.2 Geographic comparison

Chart on Geographic comparison
Data Table on Geographic comparison

12.3 North America - Market size and forecast 2025-2030

Chart on North America - Market size and forecast 2025-2030 ($ million)
Data Table on North America - Market size and forecast 2025-2030 ($ million)
Chart on North America - Year-over-year growth 2025-2030 (%)
Data Table on North America - Year-over-year growth 2025-2030 (%)
Chart on Regional Comparison - North America
Data Table on Regional Comparison - North America

12.3.1 US - Market size and forecast 2025-2030

Chart on US - Market size and forecast 2025-2030 ($ million)
Data Table on US - Market size and forecast 2025-2030 ($ million)
Chart on US - Year-over-year growth 2025-2030 (%)
Data Table on US - Year-over-year growth 2025-2030 (%)

12.3.2 Canada - Market size and forecast 2025-2030

Chart on Canada - Market size and forecast 2025-2030 ($ million)
Data Table on Canada - Market size and forecast 2025-2030 ($ million)
Chart on Canada - Year-over-year growth 2025-2030 (%)
Data Table on Canada - Year-over-year growth 2025-2030 (%)

12.3.3 Mexico - Market size and forecast 2025-2030

Chart on Mexico - Market size and forecast 2025-2030 ($ million)
Data Table on Mexico - Market size and forecast 2025-2030 ($ million)
Chart on Mexico - Year-over-year growth 2025-2030 (%)
Data Table on Mexico - Year-over-year growth 2025-2030 (%)

12.4 Europe - Market size and forecast 2025-2030

Chart on Europe - Market size and forecast 2025-2030 ($ million)
Data Table on Europe - Market size and forecast 2025-2030 ($ million)
Chart on Europe - Year-over-year growth 2025-2030 (%)
Data Table on Europe - Year-over-year growth 2025-2030 (%)
Chart on Regional Comparison - Europe
Data Table on Regional Comparison - Europe

12.4.1 Germany - Market size and forecast 2025-2030

Chart on Germany - Market size and forecast 2025-2030 ($ million)
Data Table on Germany - Market size and forecast 2025-2030 ($ million)
Chart on Germany - Year-over-year growth 2025-2030 (%)
Data Table on Germany - Year-over-year growth 2025-2030 (%)

12.4.2 UK - Market size and forecast 2025-2030

Chart on UK - Market size and forecast 2025-2030 ($ million)
Data Table on UK - Market size and forecast 2025-2030 ($ million)
Chart on UK - Year-over-year growth 2025-2030 (%)
Data Table on UK - Year-over-year growth 2025-2030 (%)

12.4.3 France - Market size and forecast 2025-2030

Chart on France - Market size and forecast 2025-2030 ($ million)
Data Table on France - Market size and forecast 2025-2030 ($ million)
Chart on France - Year-over-year growth 2025-2030 (%)
Data Table on France - Year-over-year growth 2025-2030 (%)

12.4.4 Italy - Market size and forecast 2025-2030

Chart on Italy - Market size and forecast 2025-2030 ($ million)
Data Table on Italy - Market size and forecast 2025-2030 ($ million)
Chart on Italy - Year-over-year growth 2025-2030 (%)
Data Table on Italy - Year-over-year growth 2025-2030 (%)

12.4.5 Spain - Market size and forecast 2025-2030

Chart on Spain - Market size and forecast 2025-2030 ($ million)
Data Table on Spain - Market size and forecast 2025-2030 ($ million)
Chart on Spain - Year-over-year growth 2025-2030 (%)
Data Table on Spain - Year-over-year growth 2025-2030 (%)

12.4.6 The Netherlands - Market size and forecast 2025-2030

Chart on The Netherlands - Market size and forecast 2025-2030 ($ million)
Data Table on The Netherlands - Market size and forecast 2025-2030 ($ million)
Chart on The Netherlands - Year-over-year growth 2025-2030 (%)
Data Table on The Netherlands - Year-over-year growth 2025-2030 (%)

12.5 APAC - Market size and forecast 2025-2030

Chart on APAC - Market size and forecast 2025-2030 ($ million)
Data Table on APAC - Market size and forecast 2025-2030 ($ million)
Chart on APAC - Year-over-year growth 2025-2030 (%)
Data Table on APAC - Year-over-year growth 2025-2030 (%)
Chart on Regional Comparison - APAC
Data Table on Regional Comparison - APAC

12.5.1 China - Market size and forecast 2025-2030

Chart on China - Market size and forecast 2025-2030 ($ million)
Data Table on China - Market size and forecast 2025-2030 ($ million)
Chart on China - Year-over-year growth 2025-2030 (%)
Data Table on China - Year-over-year growth 2025-2030 (%)

12.5.2 Japan - Market size and forecast 2025-2030

Chart on Japan - Market size and forecast 2025-2030 ($ million)
Data Table on Japan - Market size and forecast 2025-2030 ($ million)
Chart on Japan - Year-over-year growth 2025-2030 (%)
Data Table on Japan - Year-over-year growth 2025-2030 (%)

12.5.3 India - Market size and forecast 2025-2030

Chart on India - Market size and forecast 2025-2030 ($ million)
Data Table on India - Market size and forecast 2025-2030 ($ million)
Chart on India - Year-over-year growth 2025-2030 (%)
Data Table on India - Year-over-year growth 2025-2030 (%)

12.5.4 South Korea - Market size and forecast 2025-2030

Chart on South Korea - Market size and forecast 2025-2030 ($ million)
Data Table on South Korea - Market size and forecast 2025-2030 ($ million)
Chart on South Korea - Year-over-year growth 2025-2030 (%)
Data Table on South Korea - Year-over-year growth 2025-2030 (%)

12.5.5 Australia - Market size and forecast 2025-2030

Chart on Australia - Market size and forecast 2025-2030 ($ million)
Data Table on Australia - Market size and forecast 2025-2030 ($ million)
Chart on Australia - Year-over-year growth 2025-2030 (%)
Data Table on Australia - Year-over-year growth 2025-2030 (%)

12.5.6 Indonesia - Market size and forecast 2025-2030

Chart on Indonesia - Market size and forecast 2025-2030 ($ million)
Data Table on Indonesia - Market size and forecast 2025-2030 ($ million)
Chart on Indonesia - Year-over-year growth 2025-2030 (%)
Data Table on Indonesia - Year-over-year growth 2025-2030 (%)

12.6 South America - Market size and forecast 2025-2030

Chart on South America - Market size and forecast 2025-2030 ($ million)
Data Table on South America - Market size and forecast 2025-2030 ($ million)
Chart on South America - Year-over-year growth 2025-2030 (%)
Data Table on South America - Year-over-year growth 2025-2030 (%)
Chart on Regional Comparison - South America
Data Table on Regional Comparison - South America

12.6.1 Brazil - Market size and forecast 2025-2030

Chart on Brazil - Market size and forecast 2025-2030 ($ million)
Data Table on Brazil - Market size and forecast 2025-2030 ($ million)
Chart on Brazil - Year-over-year growth 2025-2030 (%)
Data Table on Brazil - Year-over-year growth 2025-2030 (%)

12.6.2 Argentina - Market size and forecast 2025-2030

Chart on Argentina - Market size and forecast 2025-2030 ($ million)
Data Table on Argentina - Market size and forecast 2025-2030 ($ million)
Chart on Argentina - Year-over-year growth 2025-2030 (%)
Data Table on Argentina - Year-over-year growth 2025-2030 (%)

12.6.3 Chile - Market size and forecast 2025-2030

Chart on Chile - Market size and forecast 2025-2030 ($ million)
Data Table on Chile - Market size and forecast 2025-2030 ($ million)
Chart on Chile - Year-over-year growth 2025-2030 (%)
Data Table on Chile - Year-over-year growth 2025-2030 (%)

12.7 Middle East and Africa - Market size and forecast 2025-2030

Chart on Middle East and Africa - Market size and forecast 2025-2030 ($ million)
Data Table on Middle East and Africa - Market size and forecast 2025-2030 ($ million)
Chart on Middle East and Africa - Year-over-year growth 2025-2030 (%)
Data Table on Middle East and Africa - Year-over-year growth 2025-2030 (%)
Chart on Regional Comparison - Middle East and Africa
Data Table on Regional Comparison - Middle East and Africa

12.7.1 Saudi Arabia - Market size and forecast 2025-2030

Chart on Saudi Arabia - Market size and forecast 2025-2030 ($ million)
Data Table on Saudi Arabia - Market size and forecast 2025-2030 ($ million)
Chart on Saudi Arabia - Year-over-year growth 2025-2030 (%)
Data Table on Saudi Arabia - Year-over-year growth 2025-2030 (%)

12.7.2 UAE - Market size and forecast 2025-2030

Chart on UAE - Market size and forecast 2025-2030 ($ million)
Data Table on UAE - Market size and forecast 2025-2030 ($ million)
Chart on UAE - Year-over-year growth 2025-2030 (%)
Data Table on UAE - Year-over-year growth 2025-2030 (%)

12.7.3 South Africa - Market size and forecast 2025-2030

Chart on South Africa - Market size and forecast 2025-2030 ($ million)
Data Table on South Africa - Market size and forecast 2025-2030 ($ million)
Chart on South Africa - Year-over-year growth 2025-2030 (%)
Data Table on South Africa - Year-over-year growth 2025-2030 (%)

12.7.4 Israel - Market size and forecast 2025-2030

Chart on Israel - Market size and forecast 2025-2030 ($ million)
Data Table on Israel - Market size and forecast 2025-2030 ($ million)
Chart on Israel - Year-over-year growth 2025-2030 (%)
Data Table on Israel - Year-over-year growth 2025-2030 (%)

12.7.5 Turkey - Market size and forecast 2025-2030

Chart on Turkey - Market size and forecast 2025-2030 ($ million)
Data Table on Turkey - Market size and forecast 2025-2030 ($ million)
Chart on Turkey - Year-over-year growth 2025-2030 (%)
Data Table on Turkey - Year-over-year growth 2025-2030 (%)

12.8 Market opportunity by geography

Market opportunity by geography ($ million)
Data Tables on Market opportunity by geography ($ million)

13. Drivers, Challenges, and Opportunity

13.1 Market drivers

Maturation of agentic AI and hyper-personalized wellness ecosystems
Formalization of psychosocial risk management and regulatory compliance
Strategic executive ownership and integration of wellbeing into corporate KPIs

13.2 Market challenges

Conflict between data-driven personalization and stringent privacy mandates
Persistent crisis of disengagement and managerial burnout
Technological fragmentation and complexity of ecosystem integration

13.3 Impact of drivers and challenges

Impact of drivers and challenges in 2025 and 2030

13.4 Market opportunities

Shift toward stepped care pathways and integrated mental health journeys
Rise of agentic analytics and AI-powered burnout prediction
Integration of lifestyle medicine and nutrition-led preventive care

14. Competitive Landscape

14.1 Overview

14.2

Overview on criticality of inputs and factors of differentiation

14.3 Landscape disruption

Overview on factors of disruption

14.4 Industry risks

Impact of key risks on business

15. Competitive Analysis

15.1 Companies profiled

Companies covered

15.2 Company ranking index

15.3 Market positioning of companies

Matrix on companies position and classification

15.4 Aduro LLC

Aduro LLC - Overview
Aduro LLC - Product / Service
Aduro LLC - Key offerings
SWOT

15.5 ComPsych Corp.

ComPsych Corp. - Overview
ComPsych Corp. - Product / Service
ComPsych Corp. - Key offerings
SWOT

15.6 CoreHealth Technologies Inc

CoreHealth Technologies Inc - Overview
CoreHealth Technologies Inc - Product / Service
CoreHealth Technologies Inc - Key offerings
SWOT

15.7 Corporate Wellness Inc

Corporate Wellness Inc - Overview
Corporate Wellness Inc - Product / Service
Corporate Wellness Inc - Key offerings
SWOT

15.8 Exos Works Inc.

Exos Works Inc. - Overview
Exos Works Inc. - Product / Service
Exos Works Inc. - Key offerings
SWOT

15.9 Google LLC

Google LLC - Overview
Google LLC - Product / Service
Google LLC - Key offerings
SWOT

15.10 Marathon Health LLC

Marathon Health LLC - Overview
Marathon Health LLC - Product / Service
Marathon Health LLC - Key offerings
SWOT

15.11 Optum Inc.

Optum Inc. - Overview
Optum Inc. - Product / Service
Optum Inc. - Key offerings
SWOT

15.12 Personify Health Inc.

Personify Health Inc. - Overview
Personify Health Inc. - Product / Service
Personify Health Inc. - Key offerings
SWOT

15.13 Premise Health

Premise Health - Overview
Premise Health - Product / Service
Premise Health - Key offerings
SWOT

15.14 Privia Health Group Inc.

Privia Health Group Inc. - Overview
Privia Health Group Inc. - Product / Service
Privia Health Group Inc. - Key offerings
SWOT

15.15 Quest Diagnostics Inc.

Quest Diagnostics Inc. - Overview
Quest Diagnostics Inc. - Business segments
Quest Diagnostics Inc. - Key offerings
Quest Diagnostics Inc. - Segment focus
SWOT

15.16 The Cigna Group

The Cigna Group - Overview
The Cigna Group - Business segments
The Cigna Group - Key offerings
The Cigna Group - Segment focus
SWOT

15.17 Vitality Group LLC

Vitality Group LLC - Overview
Vitality Group LLC - Product / Service
Vitality Group LLC - Key offerings
SWOT

15.18 Wellable Inc

Wellable Inc - Overview
Wellable Inc - Product / Service
Wellable Inc - Key offerings
SWOT

16. Appendix

16.1 Scope of the report

Market definition
Objectives
Notes and caveats

16.2 Inclusions and exclusions checklist

Inclusions checklist
Exclusions checklist

16.3 Currency conversion rates for US$

16.4 Research methodology

16.5 Data procurement

Information sources

16.6 Data validation

16.7 Validation techniques employed for market sizing

16.8 Data synthesis

16.9 360 degree market analysis

16.10 List of abbreviations

Research Methodology

Technavio presents a detailed picture of the market by way of study, synthesis, and summation of data from multiple sources. The analysts have presented the various facets of the market with a particular focus on identifying the key industry influencers. The data thus presented is comprehensive, reliable, and the result of extensive research, both primary and secondary.

INFORMATION SOURCES

Primary sources

  • Manufacturers and suppliers
  • Channel partners
  • Industry experts
  • Strategic decision makers

Secondary sources

  • Industry journals and periodicals
  • Government data
  • Financial reports of key industry players
  • Historical data
  • Press releases

DATA ANALYSIS

Data Synthesis

  • Collation of data
  • Estimation of key figures
  • Analysis of derived insights

Data Validation

  • Triangulation with data models
  • Reference against proprietary databases
  • Corroboration with industry experts

REPORT WRITING

Qualitative

  • Market drivers
  • Market challenges
  • Market trends
  • Five forces analysis

Quantitative

  • Market size and forecast
  • Market segmentation
  • Geographical insights
  • Competitive landscape

Interested in this report?

Get your sample now to see our research methodology and insights!

Download Now

Frequently Asked Questions

Corporate Wellness market growth will increase by USD 45484.6 million during 2026-2030.

The Corporate Wellness market is expected to grow at a CAGR of 9.6% during 2026-2030.

Corporate Wellness market is segmented by Application (Health risk assessment, Stress management, Others) End-user (SMEs, Large organizations) Delivery mode (Onsite, Offsite)

Aduro LLC, ComPsych Corp., CoreHealth Technologies Inc, Corporate Wellness Inc, Exos Works Inc., Google LLC, Marathon Health LLC, Marino Wellness LLC, Optum Inc., Personify Health Inc., Premise Health, Privia Health Group Inc., Quest Diagnostics Inc., SOL Wellness LLC, Sonic Boom Wellness Inc, The Cigna Group, TotalWellness Health, Truworth Wellness, Vitality Group LLC, Wellable Inc are a few of the key vendors in the Corporate Wellness market.

North America will register the highest growth rate of 39% among the other regions. Therefore, the Corporate Wellness market in North America is expected to garner significant business opportunities for the vendors during the forecast period.

US, Canada, Mexico, Germany, UK, France, Italy, Spain, The Netherlands, China, Japan, India, South Korea, Australia, Indonesia, Brazil, Argentina, Chile, Saudi Arabia, UAE, South Africa, Israel, Turkey

  • Maturation of agentic AI and hyper-personalized wellness ecosystems is the driving factor this market.

The Corporate Wellness market vendors should focus on grabbing business opportunities from the Application segment as it accounted for the largest market share in the base year.
RIA - Research AI Assistant
Ask RIA