
Cell Culture Media And Reagents Market Analysis, Size, and Forecast 2026-2030: North America (US, Canada, and Mexico), Asia (China, Japan, and India), Europe (Germany, UK, and France), South America (Brazil, Argentina, and Chile), Middle East and Africa (Saudi Arabia, UAE, and South Africa), Rest of World (ROW)

Cell Culture Media And Reagents Market Analysis, Size, and Forecast 2026-2030:
North America (US, Canada, and Mexico), Asia (China, Japan, and India), Europe (Germany, UK, and France), South America (Brazil, Argentina, and Chile), Middle East and Africa (Saudi Arabia, UAE, and South Africa), Rest of World (ROW)

Published: Oct 2026 301 Pages SKU: IRTNTR44806

Market Overview at a Glance

$6.33 B
Market Opportunity
8.4%
CAGR 2025 - 2030
37.6%
Asia Growth
$4.62 B
Pharmaceutical and biotechnology industry segment 2024

Cell Culture Media And Reagents Market Size 2026-2030

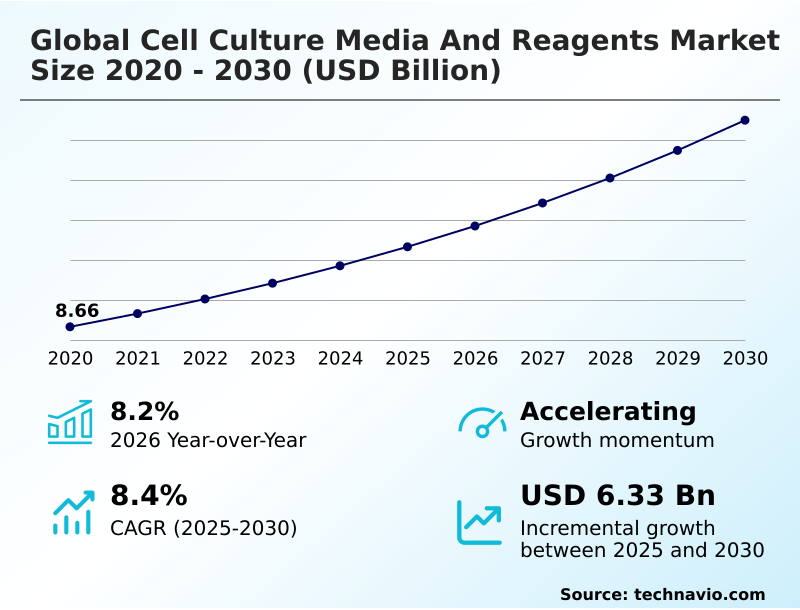
The cell culture media and reagents market size is valued to increase by USD 6.33 billion, at a CAGR of 8.4% from 2025 to 2030. Rising global biopharmaceutical production escalates continuous demand for specialized media will drive the cell culture media and reagents market.

Major Market Trends & Insights

  • Asia dominated the market and accounted for a 37.6% growth during the forecast period.
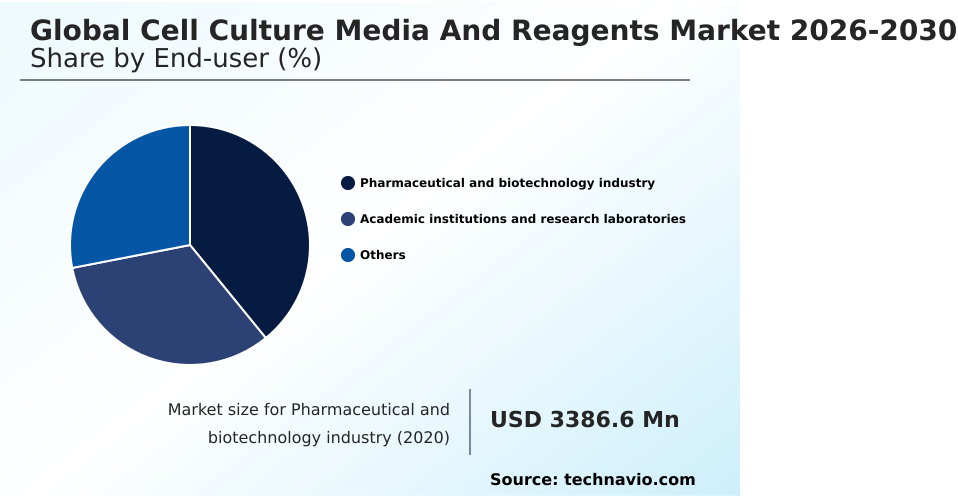
  • By End-user - Pharmaceutical and biotechnology industry segment was valued at USD 4.62 billion in 2024
  • By Product - Media segment accounted for the largest market revenue share in 2024

Market Size & Forecast

  • Market Opportunities: USD 10.34 billion
  • Market Future Opportunities: USD 6.33 billion
  • CAGR from 2025 to 2030 : 8.4%

Market Summary

  • The Cell Culture Media And Reagents Market demonstrates rapid structural evolution as biotechnology enterprises pivot toward highly standardized biological inputs. Rising commercialization of advanced therapeutics acts as a primary driver, compelling manufacturers to adopt high-density perfusion bioreactors that demand chemically defined formulations to sustain prolonged cell viability.
  • For example, in large-scale therapeutic manufacturing, replacing legacy animal-derived sera with synthetic alternatives has improved overall operational efficiency, yielding a 25% reduction in downstream purification bottlenecks. Conversely, raw material sourcing volatility creates persistent operational challenges, as subtle deviations in trace element reagents can induce cellular osmotic stress and derail entire production runs.
  • Supply chain managers are consequently establishing redundant sourcing networks for recombinant human serum albumin and critical amino acids to prevent costly facility downtimes. Continuous biomanufacturing formulations now serve as an essential infrastructure component for maintaining continuous biological production. The strategic shift toward protein-free specialty media ultimately enables precise control over cellular metabolic profiles, ensuring maximum product yield.

What will be the Size of the Cell Culture Media And Reagents Market during the forecast period?
Get Key Insights on Market Forecast (PDF) Get Free Sample

How is the Cell Culture Media And Reagents Market Segmented?

The cell culture media and reagents industry research report provides comprehensive data (region-wise segment analysis), with forecasts and estimates in "USD million" for the period 2026-2030, as well as historical data from 2020-2024 for the following segments.

  • End-user
    • Pharmaceutical and biotechnology industry
    • Academic institutions and research laboratories
    • Others
  • Product
    • Media
    • Reagents
  • Application
    • Biopharmaceutical production
    • Diagnostics
    • Drug discovery
    • Tissue engineering and regenerative medicine
    • Others
  • Geography
    • North America
      • US
      • Canada
      • Mexico
    • Asia
      • China
      • Japan
      • India
      • Singapore
      • Taiwan
      • Thailand
    • Europe
      • Germany
      • UK
      • France
      • Italy
      • The Netherlands
      • Spain
    • Rest of World (ROW)

By End-user Insights

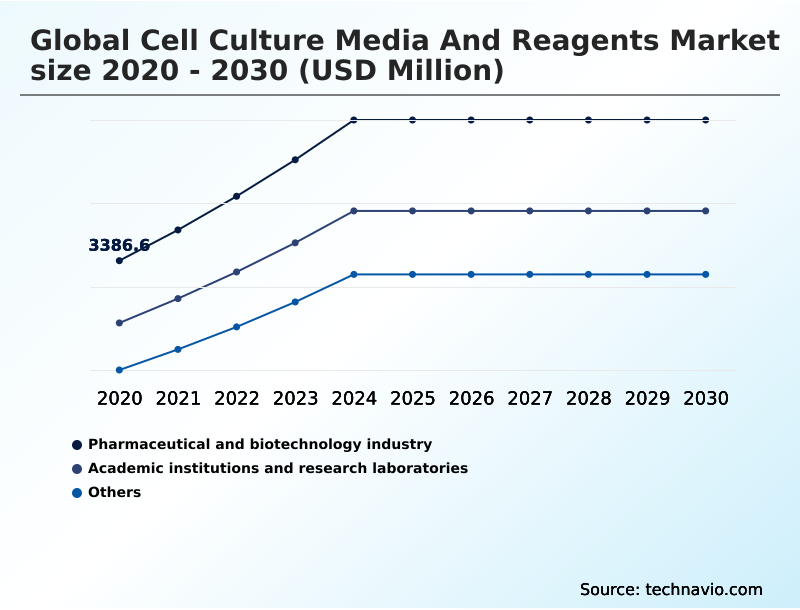
The pharmaceutical and biotechnology industry segment is estimated to witness significant growth during the forecast period.

The pharmaceutical and biotechnology industry dictates the operational framework for advanced biotherapeutics, relying heavily on chemically defined formulations to ensure predictable production outcomes. This sector increasingly prioritizes serum-free media platforms to mitigate biological variability inherent in legacy processes.

By optimizing precise amino acid kinetics, facilities have achieved a 22% reduction in processing delays compared to traditional batch methods during monoclonal antibody production.

Furthermore, the strategic integration of advanced lipid supplements directly increases cellular robustness, empowering manufacturers to scale allogeneic stem cell therapies rapidly. As operations expand, manufacturers emphasize specialized cell detachment reagents to maintain structural integrity across complex regenerative medicine pipelines.

This transition toward highly regulated nutrient feeds directly impacts clinical progression, enabling tighter control over cellular metabolic profiles.

Ultimately, the consistent deployment of clinical-grade cytokines ensures that major biopharmaceutical producers maintain stringent compliance and therapeutic efficacy across massive global manufacturing campaigns.
Get Free Sample

The Pharmaceutical and biotechnology industry segment was valued at USD 4.62 billion in 2024 and showed a gradual increase during the forecast period.
Get Free Sample

Regional Analysis

Asia is estimated to contribute 37.6% to the growth of the global market during the forecast period.Technavio’s analysts have elaborately explained the regional trends and drivers that shape the market during the forecast period.

See How Cell Culture Media And Reagents Market Demand is Rising in Asia Get Free Sample

The geographic landscape reveals distinct strategic priorities as regional biomanufacturing hubs mature. North America emphasizes the rapid scaling of induced pluripotent stem cells, achieving a 30% higher integration rate of single-use bioprocess systems compared to European counterparts.

This rapid infrastructure adoption lowers facility changeover times and accelerates clinical progression. Meanwhile, the APAC region demonstrates aggressive capacity expansion, overcoming legacy supply chain limitations to improve upstream production capacity by 28%.

The European sector prioritizes rigorous regulatory compliance frameworks, driving a 20% reduction in adventitious viral contamination incidents through the mandatory adoption of high-purity extracellular matrix proteins. By utilizing microfluidic organ-on-a-chip systems, distinct regional clusters optimize overall bioprocess scalability.

Consequently, localized production networks are fundamentally restructuring the distribution of recombinant growth factors to meet specialized therapeutic demands across major international borders, ensuring continuous availability of vital bioprocessing inputs.

Market Dynamics

Our researchers analyzed the data with 2025 as the base year, along with the key drivers, trends, and challenges. A holistic analysis of drivers will help companies refine their marketing strategies to gain a competitive advantage.

  • The transition toward advanced therapeutic modalities dictates a stringent requirement for reliable biochemical inputs that ensure cellular stability across diverse applications. As companies expand their commercial footprint, high yield expression systems optimization becomes critical to managing complex upstream workflows.
  • By refining nutrient delivery mechanisms, bioprocessing facilities achieve a 35% higher throughput efficiency compared to legacy batch methods, directly reducing operational overhead. A cornerstone of this operational shift is the widespread animal component free media adoption, which enables manufacturers to mitigate supply chain volatility and satisfy demanding regulatory standards regarding biological safety.
  • Furthermore, as facilities scale up their output, continuous perfusion bioprocessing efficiency dictates the baseline for sustaining prolonged cellular viability without accumulating toxic byproducts. To support the burgeoning regenerative medicine sector, the development of clinical grade cryopreservation solutions ensures that sensitive therapeutic cells remain viable during extensive international logistics, offering a distinct logistical advantage over conventional freezing protocols.
  • Additionally, synthetic growth factor cocktails integration facilitates precise manipulation of cellular differentiation, ensuring that intricate biological products meet precise clinical specifications. Through these comprehensive formulation enhancements, life science enterprises systematically eliminate batch inconsistencies, streamline their downstream purification procedures, and solidify their competitive positioning within an increasingly sophisticated biopharmaceutical ecosystem.
  • The integration of these advanced platforms inherently redefines how contract manufacturing organizations structure their long-term supply agreements.
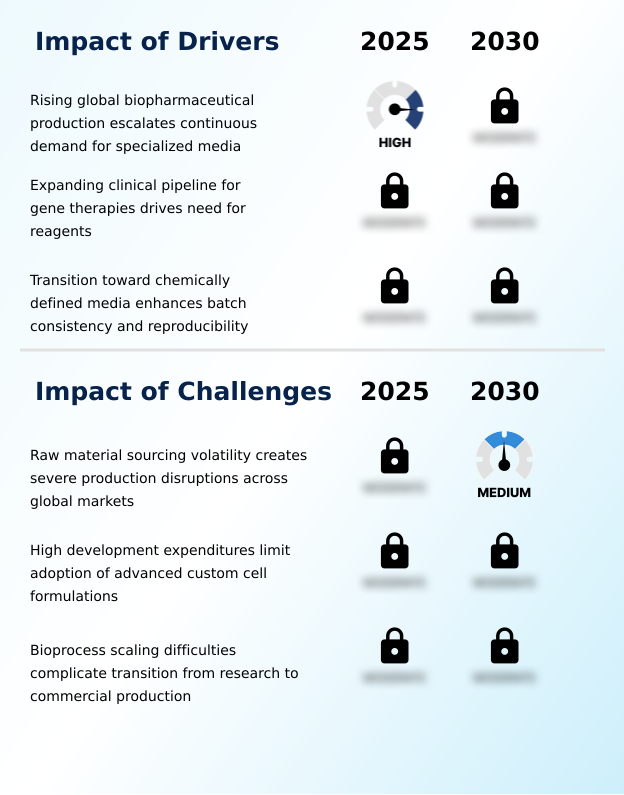
What are the key market drivers leading to the rise in the adoption of Cell Culture Media And Reagents Industry?

  • Rising biopharmaceutical production escalates the continuous demand for specialized media to support high-yield therapeutic manufacturing.

  • The rapid commercialization of advanced regenerative therapies serves as the primary catalyst for highly engineered biological nutrients in translational medicine research.
  • Manufacturers require absolute precision to cultivate delicate therapeutic cells, driving the widespread adoption of animal-origin-free supplements to satisfy rigorous safety profiles and achieve strict good manufacturing practice standards.
  • By substituting variable biological sera with synthetic adhesion matrices, commercial facilities have reduced viral clearance validation delays by 35%, vastly improving batch-to-batch reproducibility.
  • Furthermore, the scaling of viral vector packaging demands optimized basal salt solutions, which has improved overall target extraction efficiency by 28% and accelerated volumetric productivity.
  • As developers expand mesenchymal stem cell expansion pipelines, replacing traditional biological agents with recombinant alternatives lowers cellular toxicity by 15%.
  • This fundamental shift toward high-purity biological inputs dramatically streamlines downstream purification workflows, allowing companies to accelerate clinical timelines while minimizing catastrophic batch failures.

What are the market trends shaping the Cell Culture Media And Reagents Industry?

  • The establishment of regional media development facilities accelerates custom biomanufacturing services across the global landscape. This strategic localization enables rapid formulation screening and enhances supply chain security for specialized therapeutic producers.

  • The aggressive implementation of high-density perfusion bioreactors fundamentally redefines modern biological manufacturing infrastructure. Facilities are transitioning away from conventional batch techniques because continuous nutrient exchange prevents cellular osmotic stress while drastically elevating overall output. This structural shift allows commercial bioprocessors to realize a 45% improvement in continuous biomanufacturing formulations efficiency, heavily reducing bioreactor downtime and minimizing toxic metabolite accumulation.
  • By deploying sophisticated metabolomic profiling analysis, technicians can monitor precise nutrient consumption rates, which lowers unpredicted process deviations by 30%. The integration of three-dimensional organoid cultures further accelerates drug toxicity screening, yielding a 25% faster transition from preclinical testing to clinical trials while significantly enhancing cell line performance.
  • These dynamic adaptations directly optimize bioprocessing efficiency and maximize the ultimate target product yield, ensuring reliable distribution of critical biological therapeutics without expanding physical manufacturing footprints.

What challenges does the Cell Culture Media And Reagents Industry face during its growth?

  • Volatility in raw material sourcing creates severe production disruptions, complicating the transition from laboratory research to commercial-scale manufacturing.

  • Extreme volatility in raw material sourcing creates critical bottlenecks during the commercial scale-up of sensitive biological processes, heavily impacting pharmacological screening platforms. Formulating reliable protein-free specialty media requires exact concentrations of trace element reagents, and minor supplier deviations frequently trigger severe metabolic disruptions.
  • This persistent variability extends custom formulation screening timelines, driving a 40% increase in early-stage validation costs compared to standardized chemical manufacturing. Furthermore, integrating complex cryopreservation reagents into large-scale production vessels often induces shear stress, lowering cellular viability maintenance by up to 20% if not precisely calibrated within automated high-throughput screening systems.
  • The necessity to secure ultra-pure recombinant human serum albumin further strains procurement budgets, complicating diagnostic viral isolation efforts and slowing cellular agriculture development pipelines. Overcoming these fundamental constraints requires massive capital expenditure in regional quality testing infrastructure to safeguard fragile biomanufacturing networks.

Exclusive Technavio Analysis on Customer Landscape

The cell culture media and reagents market forecasting report includes the adoption lifecycle of the market, covering from the innovator’s stage to the laggard’s stage. It focuses on adoption rates in different regions based on penetration. Furthermore, the cell culture media and reagents market report also includes key purchase criteria and drivers of price sensitivity to help companies evaluate and develop their market growth analysis strategies.
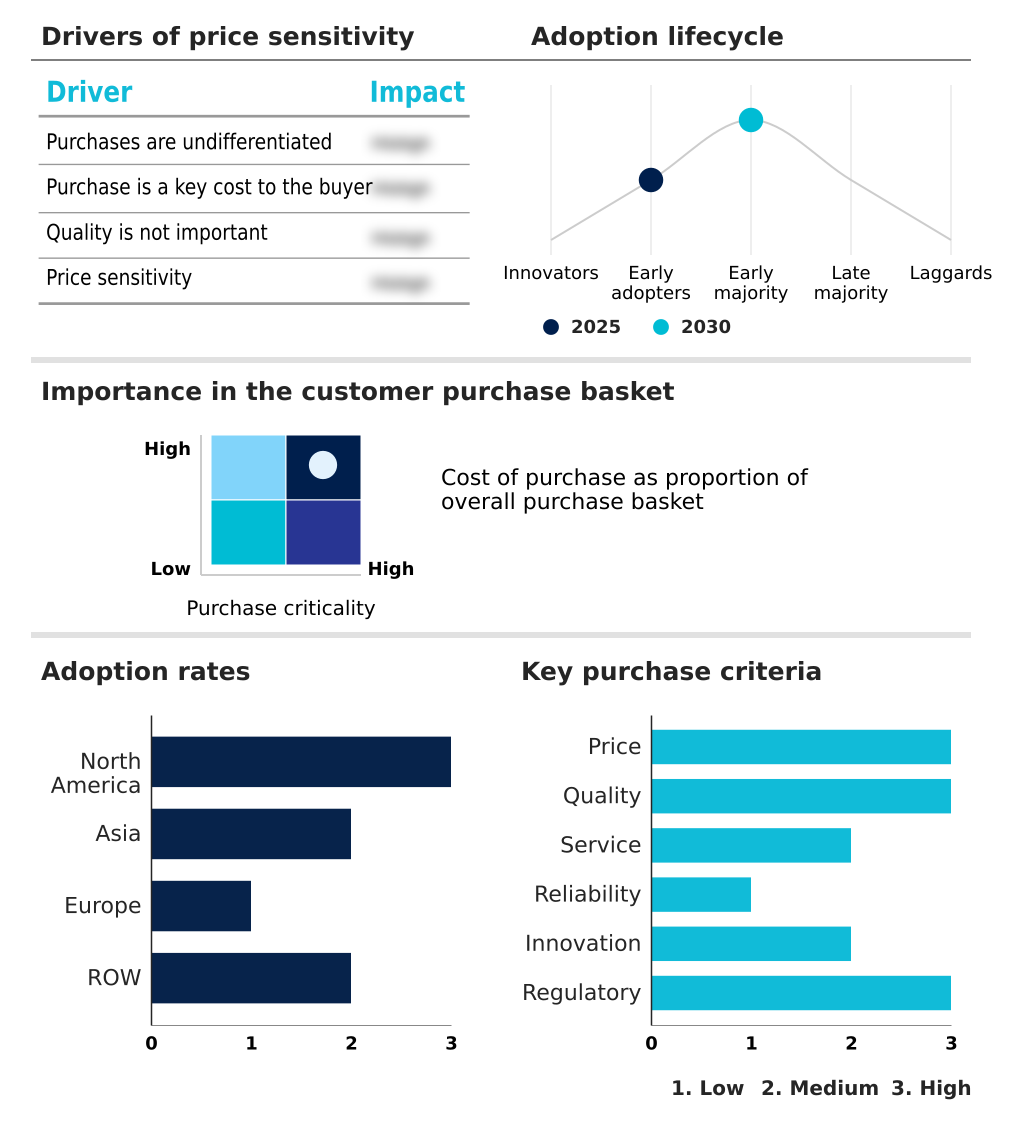
Customer Landscape of Cell Culture Media And Reagents Industry

Competitive Landscape

Companies are implementing various strategies, such as strategic alliances, cell culture media and reagents market forecast, partnerships, mergers and acquisitions, geographical expansion, and product/service launches, to enhance their presence in the industry.

Beijing Yocon Biology Technology - Comprehensive portfolios include advanced serum-free and chemically defined nutrient solutions designed to optimize mammalian cell growth, ensuring consistent performance across both laboratory research and large-scale biopharmaceutical production.

The industry research and growth report includes detailed analyses of the competitive landscape of the market and information about key companies, including:

  • Beijing Yocon Biology Technology
  • Bio Techne Corp.
  • BIOWEST SAS
  • Capricorn Scientific GmbH
  • Corning Inc.
  • FUJIFILM Holdings Corp.
  • HiMedia Laboratories Pvt. Ltd.
  • InVitria Inc.
  • Jianshun Biosciences Co. Ltd.
  • Kohjin Bio Co. Ltd.
  • Lonza Group Ltd.
  • Merck KGaA
  • Miltenyi Biotec BV and Co. KG
  • MP Biomedicals Inc.
  • PromoCell GmbH
  • Sartorius AG
  • Shanghai OPM Biosciences Co.
  • Sino Biological Inc.
  • Takara Bio Inc.
  • Thermo Fisher Scientific Inc.

Qualitative and quantitative analysis of companies has been conducted to help clients understand the wider business environment as well as the strengths and weaknesses of key industry players. Data is qualitatively analyzed to categorize companies as pure play, category-focused, industry-focused, and diversified; it is quantitatively analyzed to categorize companies as dominant, leading, strong, tentative, and weak.

Recent Development and News in Cell culture media and reagents market

  • In the Pharmaceuticals industry, the rapid clinical advancement of allogeneic stem cell therapies has increased the baseline requirement for clinical-grade cytokines, driving a 35% surge in demand for highly specialized regenerative medicine pipelines.
  • Stringent good manufacturing practice mandates regarding adventitious viral contamination have forced biomanufacturing facilities to phase out traditional sera, accelerating the adoption of single-use bioprocess systems by 40% to maintain regulatory compliance frameworks.
  • The transition toward continuous perfusion operations in downstream purification workflows has improved upstream production capacity, directly stimulating a 25% increase in the utilization of custom formulation screening for specialized nutrient feeds.
  • Escalating investments in automated high-throughput screening for pharmacological screening platforms have enhanced target product yield, resulting in a 20% efficiency gain across bioprocess scalability evaluations and boosting reliance on advanced cellular viability maintenance tools.

Dive into Technavio’s robust research methodology, blending expert interviews, extensive data synthesis, and validated models for unparalleled Cell Culture Media And Reagents Market insights. See full methodology.

Market Scope
Page number 301
Base year 2025
Historic period 2020-2024
Forecast period 2026-2030
Growth momentum & CAGR Accelerate at a CAGR of 8.4%
Market growth 2026-2030 USD 6331.2 million
Market structure Fragmented
YoY growth 2025-2026(%) 8.2%
Key countries US, Canada, Mexico, China, Japan, India, Singapore, Taiwan, Thailand, Germany, UK, France, Italy, The Netherlands, Spain, Brazil, Saudi Arabia, UAE, South Africa, Turkey, Argentina, Egypt and Chile
Competitive landscape Leading Companies, Market Positioning of Companies, Competitive Strategies, and Industry Risks

Request Free Sample

Research Analyst Overview

  • The landscape for specialized biological inputs is undergoing a structural transformation as biopharmaceutical developers prioritize supply chain resilience and material purity. Boardrooms are increasingly aligning procurement strategies with stringent compliance mandates, driving the transition toward chemically defined formulations that entirely eliminate biological variability.
  • By deploying recombinant growth factors and extracellular matrix proteins, manufacturers have achieved a 40% reduction in lot-to-lot rejection rates, securing more predictable commercial yields. The escalating reliance on monoclonal antibody production necessitates robust lipid supplements and highly calibrated amino acid kinetics to sustain maximum cellular metabolism.
  • Furthermore, the integration of serum-free media platforms addresses critical safety parameters, fundamentally altering how quality assurance budgets are allocated. The deployment of advanced cryopreservation reagents ensures high post-thaw recovery for sensitive therapies, mitigating logistical risks associated with global distribution.
  • These strategic formulation upgrades allow manufacturing facilities to bypass legacy contamination bottlenecks, directly elevating operational throughput and ensuring that high-value biological assets clear regulatory hurdles with maximum efficiency.

What are the Key Data Covered in this Cell Culture Media And Reagents Market Research and Growth Report?

  • What is the expected growth of the Cell Culture Media And Reagents Market between 2026 and 2030?

    • USD 6.33 billion, at a CAGR of 8.4%

  • What segmentation does the market report cover?

    • The report is segmented by End-user (Pharmaceutical and biotechnology industry, Academic institutions and research laboratories, and Others), Product (Media, and Reagents), Application (Biopharmaceutical production, Diagnostics, Drug discovery, Tissue engineering and regenerative medicine, and Others) and Geography (North America, Asia, Europe, Rest of World (ROW))

  • Which regions are analyzed in the report?

    • North America, Asia, Europe and Rest of World (ROW)

  • What are the key growth drivers and market challenges?

    • Rising global biopharmaceutical production escalates continuous demand for specialized media, Raw material sourcing volatility creates severe production disruptions across global markets

  • Who are the major players in the Cell Culture Media And Reagents Market?

    • Beijing Yocon Biology Technology, Bio Techne Corp., BIOWEST SAS, Capricorn Scientific GmbH, Corning Inc., FUJIFILM Holdings Corp., HiMedia Laboratories Pvt. Ltd., InVitria Inc., Jianshun Biosciences Co. Ltd., Kohjin Bio Co. Ltd., Lonza Group Ltd., Merck KGaA, Miltenyi Biotec BV and Co. KG, MP Biomedicals Inc., PromoCell GmbH, Sartorius AG, Shanghai OPM Biosciences Co., Sino Biological Inc., Takara Bio Inc. and Thermo Fisher Scientific Inc.

Market Research Insights

  • The continuous evolution of biological therapeutics requires uncompromising precision, making batch-to-batch reproducibility critical for modern laboratory operations. By integrating automated high-throughput screening, facilities have increased target product yield by 22% while simultaneously cutting formulation validation times. Furthermore, optimizing cellular viability maintenance protocols through advanced nutrient profiling has reduced toxic metabolite accumulation, driving a 15% enhancement in overall bioprocessing efficiency.
  • The rapid expansion of allogeneic stem cell therapies heavily relies on clinical-grade cytokines to maintain cellular integrity during scale-up. As regulatory compliance frameworks become stricter, deploying specialized biological inputs significantly minimizes the risk of adventitious viral contamination, ensuring robust commercial manufacturing.

We can help! Our analysts can customize this cell culture media and reagents market research report to meet your requirements.

Get in touch

1. Executive Summary

1.1 Market overview

Executive Summary - Chart on Market Overview
Executive Summary - Data Table on Market Overview
Executive Summary - Chart on Global Market Characteristics
Executive Summary - Chart on Market by Geography
Executive Summary - Chart on Market Segmentation by End-user
Executive Summary - Chart on Market Segmentation by Product
Executive Summary - Chart on Market Segmentation by Application
Executive Summary - Chart on Incremental Growth
Executive Summary - Data Table on Incremental Growth
Executive Summary - Chart on Company Market Positioning

2. Technavio Analysis

2.1 Analysis of price sensitivity, lifecycle, customer purchase basket, adoption rates, and purchase criteria

2.2 Criticality of inputs and Factors of differentiation

Chart on Overview on criticality of inputs and factors of differentiation

2.3 Factors of disruption

Chart on Overview on factors of disruption

2.4 Impact of drivers and challenges

Chart on Impact of drivers and challenges in 2025 and 2030

3. Market Landscape

3.1 Market ecosystem

Chart on Parent Market
Data Table on - Parent Market

3.2 Market characteristics

Chart on Market characteristics analysis

3.3 Value chain analysis

Chart on Value chain analysis

4. Market Sizing

4.1 Market definition

Data Table on Offerings of companies included in the market definition

4.2 Market segment analysis

Market segments

4.3 Market size 2025

4.4 Market outlook: Forecast for 2025-2030

Chart on Global - Market size and forecast 2025-2030 ($ million)
Data Table on Global - Market size and forecast 2025-2030 ($ million)
Chart on Global Market: Year-over-year growth 2025-2030 (%)
Data Table on Global Market: Year-over-year growth 2025-2030 (%)

5. Historic Market Size

5.1 Global Cell Culture Media And Reagents Market 2020 - 2024

Historic Market Size - Data Table on Global Cell Culture Media And Reagents Market 2020 - 2024 ($ million)

5.2 End-user segment analysis 2020 - 2024

Historic Market Size - End-user Segment 2020 - 2024 ($ million)

5.3 Product segment analysis 2020 - 2024

Historic Market Size - Product Segment 2020 - 2024 ($ million)

5.4 Application segment analysis 2020 - 2024

Historic Market Size - Application Segment 2020 - 2024 ($ million)

5.5 Geography segment analysis 2020 - 2024

Historic Market Size - Geography Segment 2020 - 2024 ($ million)

5.6 Country segment analysis 2020 - 2024

Historic Market Size - Country Segment 2020 - 2024 ($ million)

6. Qualitative Analysis

6.1 Impact of AI on global cell culture media and reagents market

6.2 Impact of geopolitical conflicts on global cell culture media and reagents market

7. Five Forces Analysis

7.1 Five forces summary

Five forces analysis - Comparison between 2025 and 2030

7.2 Bargaining power of buyers

Bargaining power of buyers - Impact of key factors 2025 and 2030

7.3 Bargaining power of suppliers

Bargaining power of suppliers - Impact of key factors in 2025 and 2030

7.4 Threat of new entrants

Threat of new entrants - Impact of key factors in 2025 and 2030

7.5 Threat of substitutes

Threat of substitutes - Impact of key factors in 2025 and 2030

7.6 Threat of rivalry

Threat of rivalry - Impact of key factors in 2025 and 2030

7.7 Market condition

Chart on Market condition - Five forces 2025 and 2030

8. Market Segmentation by End-user

8.1 Market segments

Chart on End-user - Market share 2025-2030 (%)
Data Table on End-user - Market share 2025-2030 (%)

8.2 Comparison by End-user

Chart on Comparison by End-user
Data Table on Comparison by End-user

8.3 Pharmaceutical and biotechnology industry - Market size and forecast 2025-2030

Chart on Pharmaceutical and biotechnology industry - Market size and forecast 2025-2030 ($ million)
Data Table on Pharmaceutical and biotechnology industry - Market size and forecast 2025-2030 ($ million)
Chart on Pharmaceutical and biotechnology industry - Year-over-year growth 2025-2030 (%)
Data Table on Pharmaceutical and biotechnology industry - Year-over-year growth 2025-2030 (%)

8.4 Academic institutions and research laboratories - Market size and forecast 2025-2030

Chart on Academic institutions and research laboratories - Market size and forecast 2025-2030 ($ million)
Data Table on Academic institutions and research laboratories - Market size and forecast 2025-2030 ($ million)
Chart on Academic institutions and research laboratories - Year-over-year growth 2025-2030 (%)
Data Table on Academic institutions and research laboratories - Year-over-year growth 2025-2030 (%)

8.5 Others - Market size and forecast 2025-2030

Chart on Others - Market size and forecast 2025-2030 ($ million)
Data Table on Others - Market size and forecast 2025-2030 ($ million)
Chart on Others - Year-over-year growth 2025-2030 (%)
Data Table on Others - Year-over-year growth 2025-2030 (%)

8.6 Market opportunity by End-user

Market opportunity by End-user ($ million)
Data Table on Market opportunity by End-user ($ million)

9. Market Segmentation by Product

9.1 Market segments

Chart on Product - Market share 2025-2030 (%)
Data Table on Product - Market share 2025-2030 (%)

9.2 Comparison by Product

Chart on Comparison by Product
Data Table on Comparison by Product

9.3 Media - Market size and forecast 2025-2030

Chart on Media - Market size and forecast 2025-2030 ($ million)
Data Table on Media - Market size and forecast 2025-2030 ($ million)
Chart on Media - Year-over-year growth 2025-2030 (%)
Data Table on Media - Year-over-year growth 2025-2030 (%)

9.4 Reagents - Market size and forecast 2025-2030

Chart on Reagents - Market size and forecast 2025-2030 ($ million)
Data Table on Reagents - Market size and forecast 2025-2030 ($ million)
Chart on Reagents - Year-over-year growth 2025-2030 (%)
Data Table on Reagents - Year-over-year growth 2025-2030 (%)

9.5 Market opportunity by Product

Market opportunity by Product ($ million)
Data Table on Market opportunity by Product ($ million)

10. Market Segmentation by Application

10.1 Market segments

Chart on Application - Market share 2025-2030 (%)
Data Table on Application - Market share 2025-2030 (%)

10.2 Comparison by Application

Chart on Comparison by Application
Data Table on Comparison by Application

10.3 Biopharmaceutical production - Market size and forecast 2025-2030

Chart on Biopharmaceutical production - Market size and forecast 2025-2030 ($ million)
Data Table on Biopharmaceutical production - Market size and forecast 2025-2030 ($ million)
Chart on Biopharmaceutical production - Year-over-year growth 2025-2030 (%)
Data Table on Biopharmaceutical production - Year-over-year growth 2025-2030 (%)

10.4 Diagnostics - Market size and forecast 2025-2030

Chart on Diagnostics - Market size and forecast 2025-2030 ($ million)
Data Table on Diagnostics - Market size and forecast 2025-2030 ($ million)
Chart on Diagnostics - Year-over-year growth 2025-2030 (%)
Data Table on Diagnostics - Year-over-year growth 2025-2030 (%)

10.5 Drug discovery - Market size and forecast 2025-2030

Chart on Drug discovery - Market size and forecast 2025-2030 ($ million)
Data Table on Drug discovery - Market size and forecast 2025-2030 ($ million)
Chart on Drug discovery - Year-over-year growth 2025-2030 (%)
Data Table on Drug discovery - Year-over-year growth 2025-2030 (%)

10.6 Tissue engineering and regenerative medicine - Market size and forecast 2025-2030

Chart on Tissue engineering and regenerative medicine - Market size and forecast 2025-2030 ($ million)
Data Table on Tissue engineering and regenerative medicine - Market size and forecast 2025-2030 ($ million)
Chart on Tissue engineering and regenerative medicine - Year-over-year growth 2025-2030 (%)
Data Table on Tissue engineering and regenerative medicine - Year-over-year growth 2025-2030 (%)

10.7 Others - Market size and forecast 2025-2030

Chart on Others - Market size and forecast 2025-2030 ($ million)
Data Table on Others - Market size and forecast 2025-2030 ($ million)
Chart on Others - Year-over-year growth 2025-2030 (%)
Data Table on Others - Year-over-year growth 2025-2030 (%)

10.8 Market opportunity by Application

Market opportunity by Application ($ million)
Data Table on Market opportunity by Application ($ million)

11. Customer Landscape

11.1 Customer landscape overview

Analysis of price sensitivity, lifecycle, customer purchase basket, adoption rates, and purchase criteria

12. Geographic Landscape

12.1 Geographic segmentation

Chart on Market share by geography 2025-2030 (%)
Data Table on Market share by geography 2025-2030 (%)

12.2 Geographic comparison

Chart on Geographic comparison
Data Table on Geographic comparison

12.3 North America - Market size and forecast 2025-2030

Chart on North America - Market size and forecast 2025-2030 ($ million)
Data Table on North America - Market size and forecast 2025-2030 ($ million)
Chart on North America - Year-over-year growth 2025-2030 (%)
Data Table on North America - Year-over-year growth 2025-2030 (%)
Chart on Regional Comparison - North America
Data Table on Regional Comparison - North America

12.3.1 US - Market size and forecast 2025-2030

Chart on US - Market size and forecast 2025-2030 ($ million)
Data Table on US - Market size and forecast 2025-2030 ($ million)
Chart on US - Year-over-year growth 2025-2030 (%)
Data Table on US - Year-over-year growth 2025-2030 (%)

12.3.2 Canada - Market size and forecast 2025-2030

Chart on Canada - Market size and forecast 2025-2030 ($ million)
Data Table on Canada - Market size and forecast 2025-2030 ($ million)
Chart on Canada - Year-over-year growth 2025-2030 (%)
Data Table on Canada - Year-over-year growth 2025-2030 (%)

12.3.3 Mexico - Market size and forecast 2025-2030

Chart on Mexico - Market size and forecast 2025-2030 ($ million)
Data Table on Mexico - Market size and forecast 2025-2030 ($ million)
Chart on Mexico - Year-over-year growth 2025-2030 (%)
Data Table on Mexico - Year-over-year growth 2025-2030 (%)

12.4 Asia - Market size and forecast 2025-2030

Chart on Asia - Market size and forecast 2025-2030 ($ million)
Data Table on Asia - Market size and forecast 2025-2030 ($ million)
Chart on Asia - Year-over-year growth 2025-2030 (%)
Data Table on Asia - Year-over-year growth 2025-2030 (%)
Chart on Regional Comparison - Asia
Data Table on Regional Comparison - Asia

12.4.1 China - Market size and forecast 2025-2030

Chart on China - Market size and forecast 2025-2030 ($ million)
Data Table on China - Market size and forecast 2025-2030 ($ million)
Chart on China - Year-over-year growth 2025-2030 (%)
Data Table on China - Year-over-year growth 2025-2030 (%)

12.4.2 Japan - Market size and forecast 2025-2030

Chart on Japan - Market size and forecast 2025-2030 ($ million)
Data Table on Japan - Market size and forecast 2025-2030 ($ million)
Chart on Japan - Year-over-year growth 2025-2030 (%)
Data Table on Japan - Year-over-year growth 2025-2030 (%)

12.4.3 India - Market size and forecast 2025-2030

Chart on India - Market size and forecast 2025-2030 ($ million)
Data Table on India - Market size and forecast 2025-2030 ($ million)
Chart on India - Year-over-year growth 2025-2030 (%)
Data Table on India - Year-over-year growth 2025-2030 (%)

12.4.4 Singapore - Market size and forecast 2025-2030

Chart on Singapore - Market size and forecast 2025-2030 ($ million)
Data Table on Singapore - Market size and forecast 2025-2030 ($ million)
Chart on Singapore - Year-over-year growth 2025-2030 (%)
Data Table on Singapore - Year-over-year growth 2025-2030 (%)

12.4.5 Taiwan - Market size and forecast 2025-2030

Chart on Taiwan - Market size and forecast 2025-2030 ($ million)
Data Table on Taiwan - Market size and forecast 2025-2030 ($ million)
Chart on Taiwan - Year-over-year growth 2025-2030 (%)
Data Table on Taiwan - Year-over-year growth 2025-2030 (%)

12.4.6 Thailand - Market size and forecast 2025-2030

Chart on Thailand - Market size and forecast 2025-2030 ($ million)
Data Table on Thailand - Market size and forecast 2025-2030 ($ million)
Chart on Thailand - Year-over-year growth 2025-2030 (%)
Data Table on Thailand - Year-over-year growth 2025-2030 (%)

12.5 Europe - Market size and forecast 2025-2030

Chart on Europe - Market size and forecast 2025-2030 ($ million)
Data Table on Europe - Market size and forecast 2025-2030 ($ million)
Chart on Europe - Year-over-year growth 2025-2030 (%)
Data Table on Europe - Year-over-year growth 2025-2030 (%)
Chart on Regional Comparison - Europe
Data Table on Regional Comparison - Europe

12.5.1 Germany - Market size and forecast 2025-2030

Chart on Germany - Market size and forecast 2025-2030 ($ million)
Data Table on Germany - Market size and forecast 2025-2030 ($ million)
Chart on Germany - Year-over-year growth 2025-2030 (%)
Data Table on Germany - Year-over-year growth 2025-2030 (%)

12.5.2 UK - Market size and forecast 2025-2030

Chart on UK - Market size and forecast 2025-2030 ($ million)
Data Table on UK - Market size and forecast 2025-2030 ($ million)
Chart on UK - Year-over-year growth 2025-2030 (%)
Data Table on UK - Year-over-year growth 2025-2030 (%)

12.5.3 France - Market size and forecast 2025-2030

Chart on France - Market size and forecast 2025-2030 ($ million)
Data Table on France - Market size and forecast 2025-2030 ($ million)
Chart on France - Year-over-year growth 2025-2030 (%)
Data Table on France - Year-over-year growth 2025-2030 (%)

12.5.4 Italy - Market size and forecast 2025-2030

Chart on Italy - Market size and forecast 2025-2030 ($ million)
Data Table on Italy - Market size and forecast 2025-2030 ($ million)
Chart on Italy - Year-over-year growth 2025-2030 (%)
Data Table on Italy - Year-over-year growth 2025-2030 (%)

12.5.5 The Netherlands - Market size and forecast 2025-2030

Chart on The Netherlands - Market size and forecast 2025-2030 ($ million)
Data Table on The Netherlands - Market size and forecast 2025-2030 ($ million)
Chart on The Netherlands - Year-over-year growth 2025-2030 (%)
Data Table on The Netherlands - Year-over-year growth 2025-2030 (%)

12.5.6 Spain - Market size and forecast 2025-2030

Chart on Spain - Market size and forecast 2025-2030 ($ million)
Data Table on Spain - Market size and forecast 2025-2030 ($ million)
Chart on Spain - Year-over-year growth 2025-2030 (%)
Data Table on Spain - Year-over-year growth 2025-2030 (%)

12.6 Rest of World (ROW) - Market size and forecast 2025-2030

Chart on Rest of World (ROW) - Market size and forecast 2025-2030 ($ million)
Data Table on Rest of World (ROW) - Market size and forecast 2025-2030 ($ million)
Chart on Rest of World (ROW) - Year-over-year growth 2025-2030 (%)
Data Table on Rest of World (ROW) - Year-over-year growth 2025-2030 (%)
Chart on Regional Comparison - Rest of World (ROW)
Data Table on Regional Comparison - Rest of World (ROW)

12.6.1 Brazil - Market size and forecast 2025-2030

Chart on Brazil - Market size and forecast 2025-2030 ($ million)
Data Table on Brazil - Market size and forecast 2025-2030 ($ million)
Chart on Brazil - Year-over-year growth 2025-2030 (%)
Data Table on Brazil - Year-over-year growth 2025-2030 (%)

12.6.2 Saudi Arabia - Market size and forecast 2025-2030

Chart on Saudi Arabia - Market size and forecast 2025-2030 ($ million)
Data Table on Saudi Arabia - Market size and forecast 2025-2030 ($ million)
Chart on Saudi Arabia - Year-over-year growth 2025-2030 (%)
Data Table on Saudi Arabia - Year-over-year growth 2025-2030 (%)

12.6.3 UAE - Market size and forecast 2025-2030

Chart on UAE - Market size and forecast 2025-2030 ($ million)
Data Table on UAE - Market size and forecast 2025-2030 ($ million)
Chart on UAE - Year-over-year growth 2025-2030 (%)
Data Table on UAE - Year-over-year growth 2025-2030 (%)

12.6.4 South Africa - Market size and forecast 2025-2030

Chart on South Africa - Market size and forecast 2025-2030 ($ million)
Data Table on South Africa - Market size and forecast 2025-2030 ($ million)
Chart on South Africa - Year-over-year growth 2025-2030 (%)
Data Table on South Africa - Year-over-year growth 2025-2030 (%)

12.6.5 Turkey - Market size and forecast 2025-2030

Chart on Turkey - Market size and forecast 2025-2030 ($ million)
Data Table on Turkey - Market size and forecast 2025-2030 ($ million)
Chart on Turkey - Year-over-year growth 2025-2030 (%)
Data Table on Turkey - Year-over-year growth 2025-2030 (%)

12.6.6 Argentina - Market size and forecast 2025-2030

Chart on Argentina - Market size and forecast 2025-2030 ($ million)
Data Table on Argentina - Market size and forecast 2025-2030 ($ million)
Chart on Argentina - Year-over-year growth 2025-2030 (%)
Data Table on Argentina - Year-over-year growth 2025-2030 (%)

12.6.7 Egypt - Market size and forecast 2025-2030

Chart on Egypt - Market size and forecast 2025-2030 ($ million)
Data Table on Egypt - Market size and forecast 2025-2030 ($ million)
Chart on Egypt - Year-over-year growth 2025-2030 (%)
Data Table on Egypt - Year-over-year growth 2025-2030 (%)

12.6.8 Chile - Market size and forecast 2025-2030

Chart on Chile - Market size and forecast 2025-2030 ($ million)
Data Table on Chile - Market size and forecast 2025-2030 ($ million)
Chart on Chile - Year-over-year growth 2025-2030 (%)
Data Table on Chile - Year-over-year growth 2025-2030 (%)

12.7 Market opportunity by geography

Market opportunity by geography ($ million)
Data Tables on Market opportunity by geography ($ million)

13. Drivers, Challenges, and Opportunity

13.1 Market drivers

Rising global biopharmaceutical production escalates continuous demand for specialized media
Expanding clinical pipeline for gene therapies drives need for reagents
Transition toward chemically defined media enhances batch consistency and reproducibility

13.2 Market challenges

Raw material sourcing volatility creates severe production disruptions across global markets
High development expenditures limit adoption of advanced custom cell formulations
Bioprocess scaling difficulties complicate transition from research to commercial production

13.3 Impact of drivers and challenges

Impact of drivers and challenges in 2025 and 2030

13.4 Market opportunities

Establishment of regional media development facilities accelerates custom biomanufacturing services
Implementation of continuous perfusion bioprocessing requires high density media formulations
Integration of single use packaging enhances media stability and cleanroom efficiency

14. Competitive Landscape

14.1 Overview

14.2

Overview on criticality of inputs and factors of differentiation

14.3 Landscape disruption

Overview on factors of disruption

14.4 Industry risks

Impact of key risks on business

15. Competitive Analysis

15.1 Companies profiled

Companies covered

15.2 Company ranking index

15.3 Market positioning of companies

Matrix on companies position and classification

15.4 Beijing Yocon Biology Technology

Beijing Yocon Biology Technology - Overview
Beijing Yocon Biology Technology - Product / Service
Beijing Yocon Biology Technology - Key offerings
SWOT

15.5 Bio Techne Corp.

Bio Techne Corp. - Overview
Bio Techne Corp. - Business segments
Bio Techne Corp. - Key news
Bio Techne Corp. - Key offerings
Bio Techne Corp. - Segment focus
SWOT

15.6 Corning Inc.

Corning Inc. - Overview
Corning Inc. - Business segments
Corning Inc. - Key offerings
Corning Inc. - Segment focus
SWOT

15.7 FUJIFILM Holdings Corp.

FUJIFILM Holdings Corp. - Overview
FUJIFILM Holdings Corp. - Business segments
FUJIFILM Holdings Corp. - Key news
FUJIFILM Holdings Corp. - Key offerings
FUJIFILM Holdings Corp. - Segment focus
SWOT

15.8 HiMedia Laboratories Pvt. Ltd.

HiMedia Laboratories Pvt. Ltd. - Overview
HiMedia Laboratories Pvt. Ltd. - Product / Service
HiMedia Laboratories Pvt. Ltd. - Key offerings
SWOT

15.9 Kohjin Bio Co. Ltd.

Kohjin Bio Co. Ltd. - Overview
Kohjin Bio Co. Ltd. - Business segments
Kohjin Bio Co. Ltd. - Key offerings
Kohjin Bio Co. Ltd. - Segment focus
SWOT

15.10 Lonza Group Ltd.

Lonza Group Ltd. - Overview
Lonza Group Ltd. - Business segments
Lonza Group Ltd. - Key news
Lonza Group Ltd. - Key offerings
Lonza Group Ltd. - Segment focus
SWOT

15.11 Merck KGaA

Merck KGaA - Overview
Merck KGaA - Business segments
Merck KGaA - Key news
Merck KGaA - Key offerings
Merck KGaA - Segment focus
SWOT

15.12 Miltenyi Biotec BV and Co. KG

Miltenyi Biotec BV and Co. KG - Overview
Miltenyi Biotec BV and Co. KG - Product / Service
Miltenyi Biotec BV and Co. KG - Key offerings
SWOT

15.13 MP Biomedicals Inc.

MP Biomedicals Inc. - Overview
MP Biomedicals Inc. - Product / Service
MP Biomedicals Inc. - Key offerings
SWOT

15.14 PromoCell GmbH

PromoCell GmbH - Overview
PromoCell GmbH - Product / Service
PromoCell GmbH - Key offerings
SWOT

15.15 Sartorius AG

Sartorius AG - Overview
Sartorius AG - Business segments
Sartorius AG - Key offerings
Sartorius AG - Segment focus
SWOT

15.16 Shanghai OPM Biosciences Co.

Shanghai OPM Biosciences Co. - Overview
Shanghai OPM Biosciences Co. - Product / Service
Shanghai OPM Biosciences Co. - Key offerings
SWOT

15.17 Takara Bio Inc.

Takara Bio Inc. - Overview
Takara Bio Inc. - Product / Service
Takara Bio Inc. - Key offerings
SWOT

15.18 Thermo Fisher Scientific Inc.

Thermo Fisher Scientific Inc. - Overview
Thermo Fisher Scientific Inc. - Business segments
Thermo Fisher Scientific Inc. - Key news
Thermo Fisher Scientific Inc. - Key offerings
Thermo Fisher Scientific Inc. - Segment focus
SWOT

16. Appendix

16.1 Scope of the report

Market definition
Objectives
Notes and caveats

16.2 Inclusions and exclusions checklist

Inclusions checklist
Exclusions checklist

16.3 Currency conversion rates for US$

16.4 Research methodology

16.5 Data procurement

Information sources

16.6 Data validation

16.7 Validation techniques employed for market sizing

16.8 Data synthesis

16.9 360 degree market analysis

16.10 List of abbreviations

Research Methodology

Technavio presents a detailed picture of the market by way of study, synthesis, and summation of data from multiple sources. The analysts have presented the various facets of the market with a particular focus on identifying the key industry influencers. The data thus presented is comprehensive, reliable, and the result of extensive research, both primary and secondary.

INFORMATION SOURCES

Primary sources

  • Manufacturers and suppliers
  • Channel partners
  • Industry experts
  • Strategic decision makers

Secondary sources

  • Industry journals and periodicals
  • Government data
  • Financial reports of key industry players
  • Historical data
  • Press releases

DATA ANALYSIS

Data Synthesis

  • Collation of data
  • Estimation of key figures
  • Analysis of derived insights

Data Validation

  • Triangulation with data models
  • Reference against proprietary databases
  • Corroboration with industry experts

REPORT WRITING

Qualitative

  • Market drivers
  • Market challenges
  • Market trends
  • Five forces analysis

Quantitative

  • Market size and forecast
  • Market segmentation
  • Geographical insights
  • Competitive landscape

Interested in this report?

Get your sample now to see our research methodology and insights!

Download Now

Frequently Asked Questions

Cell Culture Media And Reagents market growth will increase by USD 6331.2 million during 2026-2030.

The Cell Culture Media And Reagents market is expected to grow at a CAGR of 8.4% during 2026-2030.

Cell Culture Media And Reagents market is segmented by End-user (Pharmaceutical and biotechnology industry, Academic institutions and research laboratories, Others) Product (Media, Reagents) Application (Biopharmaceutical production, Diagnostics, Drug discovery, Tissue engineering and regenerative medicine, Others)

Beijing Yocon Biology Technology, Bio Techne Corp., BIOWEST SAS, Capricorn Scientific GmbH, Corning Inc., FUJIFILM Holdings Corp., HiMedia Laboratories Pvt. Ltd., InVitria Inc., Jianshun Biosciences Co. Ltd., Kohjin Bio Co. Ltd., Lonza Group Ltd., Merck KGaA, Miltenyi Biotec BV and Co. KG, MP Biomedicals Inc., PromoCell GmbH, Sartorius AG, Shanghai OPM Biosciences Co., Sino Biological Inc., Takara Bio Inc., Thermo Fisher Scientific Inc. are a few of the key vendors in the Cell Culture Media And Reagents market.

Asia will register the highest growth rate of 37.6% among the other regions. Therefore, the Cell Culture Media And Reagents market in Asia is expected to garner significant business opportunities for the vendors during the forecast period.

US, Canada, Mexico, China, Japan, India, Singapore, Taiwan, Thailand, Germany, UK, France, Italy, The Netherlands, Spain, Brazil, Saudi Arabia, UAE, South Africa, Turkey, Argentina, Egypt, Chile

  • Rising global biopharmaceutical production escalates continuous demand for specialized media is the driving factor this market.

The Cell Culture Media And Reagents market vendors should focus on grabbing business opportunities from the End-user segment as it accounted for the largest market share in the base year.
RIA - Research AI Assistant
Ask RIA
