
Cancer Immunotherapy Market Analysis, Size, and Forecast 2026-2030: North America (US, Canada, and Mexico), Europe (Germany, UK, and France), Asia (Japan, China, and India), South America (Brazil, Argentina, and Colombia), Middle East and Africa (Saudi Arabia, South Africa, and Turkey), Rest of World (ROW)

Cancer Immunotherapy Market Analysis, Size, and Forecast 2026-2030:
North America (US, Canada, and Mexico), Europe (Germany, UK, and France), Asia (Japan, China, and India), South America (Brazil, Argentina, and Colombia), Middle East and Africa (Saudi Arabia, South Africa, and Turkey), Rest of World (ROW)

Published: Oct 2026 295 Pages SKU: IRTNTR71598

Market Overview at a Glance

$53.90 B
Market Opportunity
8.3%
CAGR 2025 - 2030
44.2%
North America Growth
$52.09 B
Monoclonal antibodies segment 2024

Cancer Immunotherapy Market Size 2026-2030

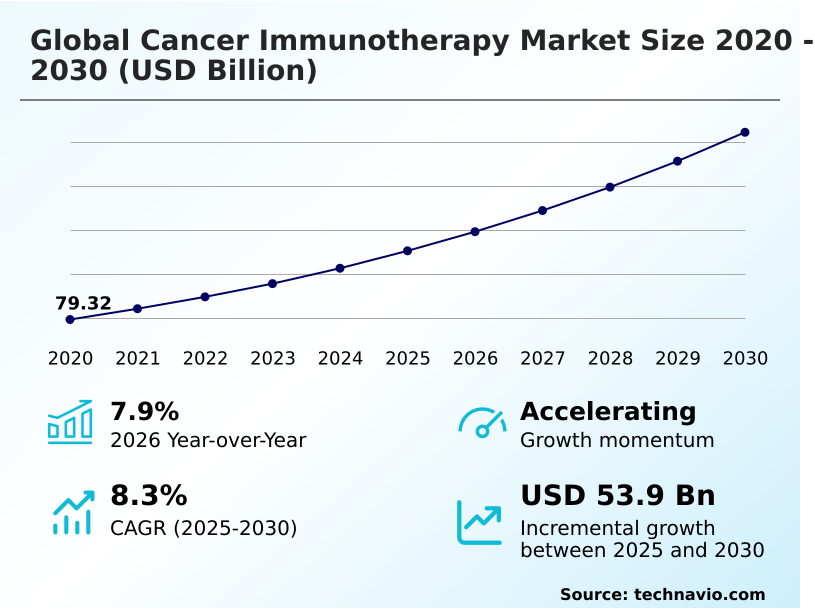
The cancer immunotherapy market size is valued to increase by USD 53.90 billion, at a CAGR of 8.3% from 2025 to 2030. Expanding regulatory approvals for combination therapies will drive the cancer immunotherapy market.

Major Market Trends & Insights

  • North America dominated the market and accounted for a 44.2% growth during the forecast period.
  • By Type - Monoclonal antibodies segment was valued at USD 52.09 billion in 2024
  • By Application - Lung cancer segment accounted for the largest market revenue share in 2024

Market Size & Forecast

  • Market Opportunities: USD 85.10 billion
  • Market Future Opportunities: USD 53.90 billion
  • CAGR from 2025 to 2030 : 8.3%

Market Summary

  • The Cancer Immunotherapy Market operates as a highly specialized sector driven by precision medicine and targeted biological interventions. Clinical demand is propelled by the continuous expansion of regulatory approvals for combination therapeutic regimens, which allow healthcare providers to simultaneously target multiple immune evasion pathways to maximize patient survival rates.
  • Healthcare networks implementing centralized biomarker screening workflows report a 35% increase in diagnostic throughput compared to decentralized testing models. This operational efficiency ensures that eligible patients are matched with appropriate targeted therapies rapidly. Conversely, the industry faces substantial friction due to intricate manufacturing requirements and systemic supply chain vulnerabilities associated with personalized cellular treatments.
  • Extracting, modifying, and transporting patient-specific biological material requires strict adherence to cold chain protocols, which frequently creates logistical bottlenecks and delays critical care. Establishing localized production infrastructure mitigates these vulnerabilities, ensuring continuous access to temperature-sensitive active pharmaceutical ingredients. As molecular profiling technologies mature, institutions continue to refine patient stratification, fundamentally elevating the standard of targeted oncology care.

What will be the Size of the Cancer Immunotherapy Market during the forecast period?
Get Key Insights on Market Forecast (PDF) Get Free Sample

How is the Cancer Immunotherapy Market Segmented?

The cancer immunotherapy industry research report provides comprehensive data (region-wise segment analysis), with forecasts and estimates in "USD million" for the period 2026-2030, as well as historical data from 2020-2024 for the following segments.

  • Type
    • Monoclonal antibodies
    • Check point inhibitors
    • Cancer vaccines
  • Application
    • Lung cancer
    • Breast cancer
    • Colorectal cancer
    • Others
  • End-user
    • Hospitals and clinics
    • Cancer research centers
  • Geography
    • North America
      • US
      • Canada
      • Mexico
    • Europe
      • Germany
      • UK
      • France
      • Italy
      • Spain
      • The Netherlands
    • Asia
      • Japan
      • China
      • India
      • South Korea
      • Taiwan
      • Singapore
    • Rest of World (ROW)

By Type Insights

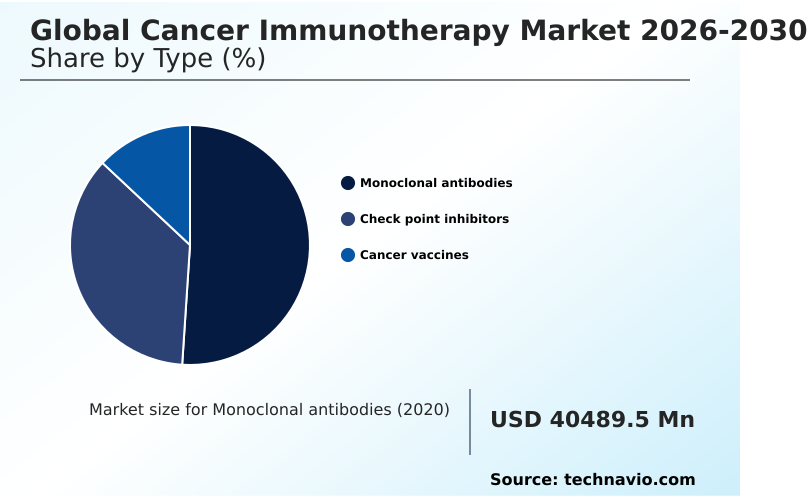
The monoclonal antibodies segment is estimated to witness significant growth during the forecast period.

Monoclonal antibody engineering dictates therapeutic targeting strategies, allowing oncologists to precisely neutralize malignant growth pathways. The transition toward bispecific T-cell engager platforms improves target specificity, enabling robust immune checkpoint blockade against evasive cellular mechanisms.

Healthcare facilities utilizing advanced solid tumor infiltration metrics report a 25% improvement in patient stratification accuracy compared to conventional screening protocols. Furthermore, evaluating cytotoxic T-lymphocyte antigen expression streamlines outpatient infusion workflows by prioritizing highly responsive demographics.

Biomanufacturing automation reduces recombinant protein synthesis delays, accelerating commercial distribution and increasing production yields by 18% over traditional batch processing methods.

Integrating these complex immunomodulatory pathways fundamentally enhances hematological malignancy profiling, allowing healthcare systems to systematically elevate treatment efficacy while optimizing overall operational capacity.
Get Free Sample

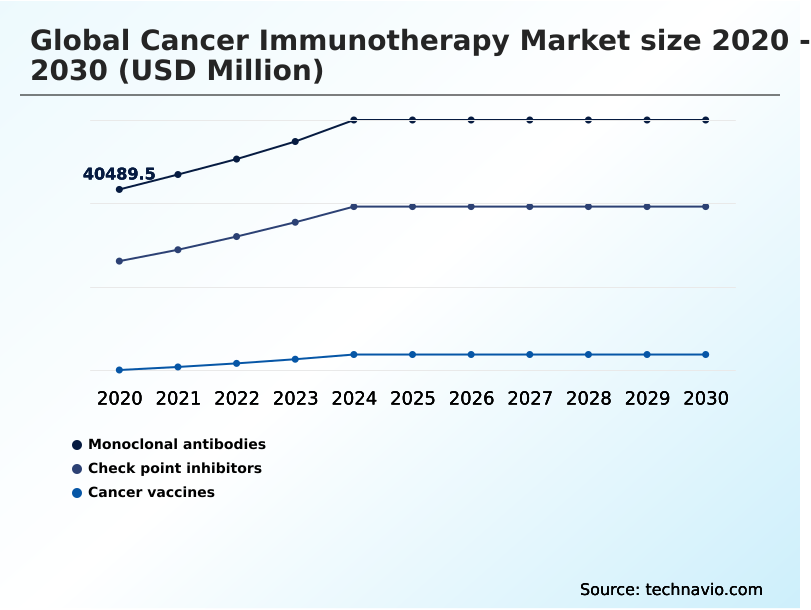
The Monoclonal antibodies segment was valued at USD 52.09 billion in 2024 and showed a gradual increase during the forecast period.
Get Free Sample

Regional Analysis

North America is estimated to contribute 44.2% to the growth of the global market during the forecast period.Technavio’s analysts have elaborately explained the regional trends and drivers that shape the market during the forecast period.
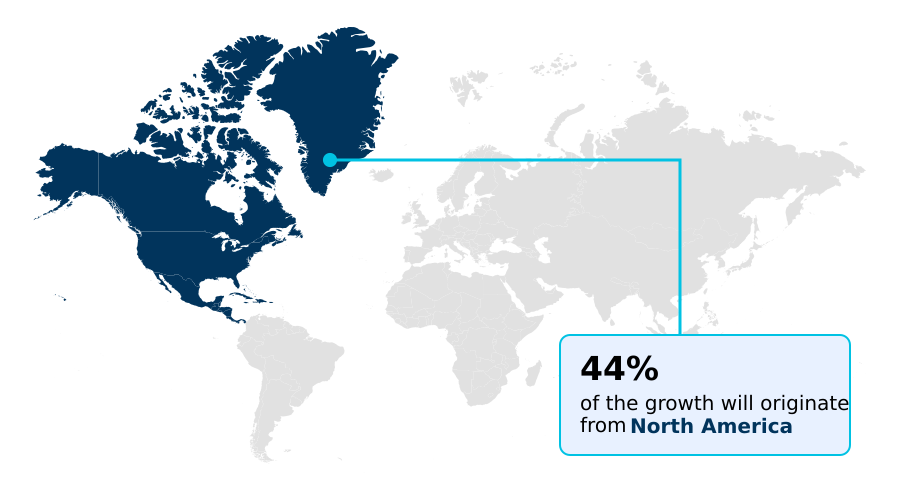
See How Cancer Immunotherapy Market Demand is Rising in North America Get Free Sample

Regional disparities in the Cancer Immunotherapy Market stem primarily from varying levels of genomic sequencing integration and access to translational oncology research facilities.

North America processes liquid biopsy monitoring diagnostics at a 40% higher volume than Europe, driven by aggressive policies favoring precision screening.

This infrastructure allows institutions in the United States to systematically track circulating tumor DNA, yielding a 22% improvement in early therapeutic resistance mitigation compared to European counterparts.

Businesses adapt by localizing their diagnostic partnerships to align with regional tumor mutational burden tracking standards. Furthermore, North American healthcare providers prioritize advanced microsatellite instability profiling and breakthroughs in glycoimmunology to accelerate immunosuppressive reversal strategies in complex malignancies.

European markets maintain a more conservative approach, focusing on standardized pathological complete response evaluations to validate clinical efficacy before broad deployment.

Market Dynamics

Our researchers analyzed the data with 2025 as the base year, along with the key drivers, trends, and challenges. A holistic analysis of drivers will help companies refine their marketing strategies to gain a competitive advantage.

  • The progression of oncology care relies heavily on implementing advanced diagnostic criteria and specialized biological treatment modalities. Modern clinical facilities increasingly utilize programmed death ligand expression profiling to systematically categorize patient cohorts, ensuring expensive therapies are allocated to individuals with the highest probability of durable response.
  • This rigorous patient stratification yields a 30% reduction in unnecessary treatment expenditures compared to broad-spectrum therapeutic applications, directly optimizing institutional supply chain and operational planning. Furthermore, researchers are deploying chimeric antigen receptor cellular modifications to engineer robust in vivo immune responses against resilient solid malignancies.
  • Operational focus has concurrently shifted toward refining personalized therapeutic neoantigen vaccine formulations, a process requiring meticulous genetic sequencing and rapid manufacturing turnarounds. By identifying unique mutational signatures, these customized vaccines instruct the host immune system to target specific disease markers aggressively.
  • In parallel, developers are pioneering tumor microenvironment immunosuppression reversal protocols to dismantle the physical and chemical barriers that traditionally shield malignant cells from systemic interventions. Addressing these complex biological structures is critically important during microsatellite instability high tumor targeting, where heightened immunogenicity offers a distinct therapeutic window.
  • Integrating these sophisticated molecular strategies allows healthcare enterprises to streamline clinical workflows, reduce adverse treatment outcomes, and maximize the overall efficacy of targeted care programs globally.
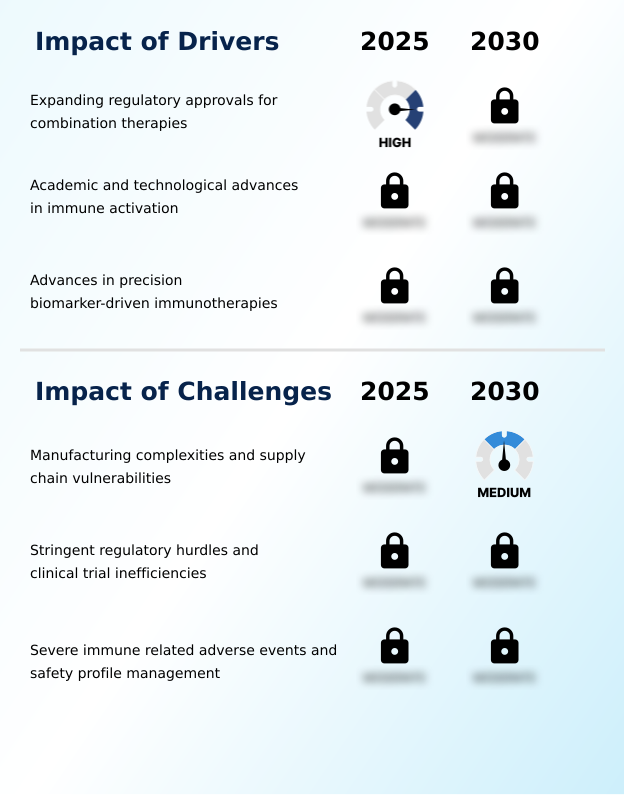
What are the key market drivers leading to the rise in the adoption of Cancer Immunotherapy Industry?

  • The strategic expansion of regulatory approvals for combination therapeutic regimens serves as a primary catalyst for industry acceleration, significantly enhancing clinical efficacy and durable patient outcomes.

  • The rapid commercial integration of programmed cell death protein inhibitors is heavily propelling therapeutic advancements within modern oncology. This clinical momentum is primarily caused by accelerating neoantigen discovery platforms, which identify highly specific mutational targets within the resilient tumor microenvironment.
  • Applying biomarker targeted validation protocols increases diagnostic matching efficiency by 30% compared to traditional non-specific testing methodologies. As a direct result, healthcare providers can deploy targeted macrophage activation and dendritic cell polarization therapies with unprecedented accuracy.
  • Implementing these precise adjuvant treatment protocols alongside neoadjuvant therapy regimens reduces postoperative recurrence rates by 18%, substantially lowering long-term clinical management costs for hospital networks.
  • This rigorous clinical trial stratification directly compels biopharmaceutical organizations to continuously refine their portfolios, ensuring alignment with emerging value based reimbursement frameworks and widespread institutional adoption.

What are the market trends shaping the Cancer Immunotherapy Industry?

  • Advanced chimeric antigen receptor cellular therapies are rapidly emerging as a transformative modality for treating complex solid tumors. This clinical evolution fundamentally shifts therapeutic protocols by engineering targeted in vivo cellular responses to overcome immunosuppressive microenvironments.

  • The widespread adoption of chimeric antigen receptor platforms fundamentally transforms the clinical management of severe malignancies. This therapeutic shift is driven by the urgent need to overcome limitations associated with complex cold chain logistics and external manufacturing cycles.
  • By utilizing targeted lipid nanoparticle delivery alongside messenger RNA technology, scientists facilitate direct in vivo cellular reprogramming, which drastically reduces traditional processing dependencies. Consequently, institutions implementing these localized workflows report a 40% reduction in treatment preparation time compared to standard ex vivo models. This accelerated adoptive cell transfer approach directly improves patient survival rates.
  • Furthermore, integrating next generation sequencing with companion diagnostic tools enhances precision oncology diagnostics, increasing patient matching accuracy by 25%. These technological shifts necessitate significant investments in scalable cellular production capabilities, forcing facilities to automate processes.

What challenges does the Cancer Immunotherapy Industry face during its growth?

  • Intricate biological manufacturing requirements and systemic supply chain vulnerabilities present substantial barriers that restrict the seamless clinical distribution of advanced personalized therapies.

  • Managing severe toxicity profiles presents a substantial structural limitation for the widespread clinical deployment of advanced biological treatments. The administration of engineered immune effector cell platforms frequently triggers cytokine release syndrome, causing severe systemic inflammation that requires immediate intensive care intervention. This operational burden increases patient hospitalization durations by 25% compared to conventional therapies.
  • Furthermore, the inherent complexities of pseudoprogression evaluation during oncolytic viral therapy and tumor infiltrating lymphocytes regimens routinely complicate clinical response assessments. Analyzing baseline stromal tumor infiltrating lymphocytes provides predictive value, yet the absolute unpredictability of severe immune related adverse events forces healthcare networks to increase their investments in rigorous pharmacovigilance monitoring by roughly 20%.
  • Additionally, maintaining strict sterility compliance standards while managing volatile active pharmaceutical ingredient sourcing fundamentally limits broad geographical market penetration.

Exclusive Technavio Analysis on Customer Landscape

The cancer immunotherapy market forecasting report includes the adoption lifecycle of the market, covering from the innovator’s stage to the laggard’s stage. It focuses on adoption rates in different regions based on penetration. Furthermore, the cancer immunotherapy market report also includes key purchase criteria and drivers of price sensitivity to help companies evaluate and develop their market growth analysis strategies.
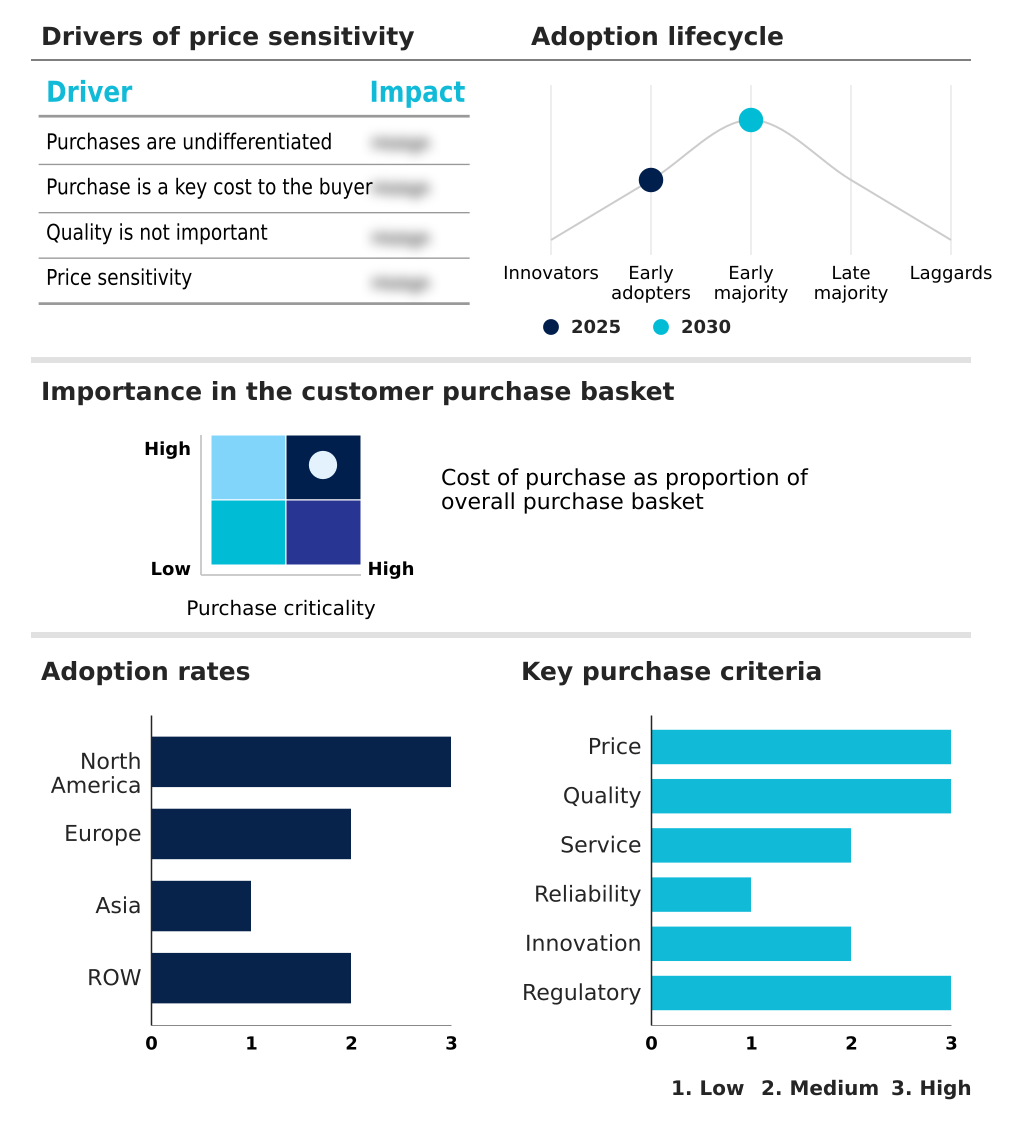
Customer Landscape of Cancer Immunotherapy Industry

Competitive Landscape

Companies are implementing various strategies, such as strategic alliances, cancer immunotherapy market forecast, partnerships, mergers and acquisitions, geographical expansion, and product/service launches, to enhance their presence in the industry.

AbbVie Inc. - The organization delivers specialized oncology biologics and advanced immunomodulatory therapies, focusing on comprehensive antibody-based treatments and investigational immuno-oncology clinical pipelines designed for complex malignancies.

The industry research and growth report includes detailed analyses of the competitive landscape of the market and information about key companies, including:

  • AbbVie Inc.
  • Amgen Inc.
  • AstraZeneca Plc
  • Bayer AG
  • BioNTech SE
  • Bristol Myers Squibb Co.
  • Eisai Co. Ltd.
  • Eli Lilly and Co.
  • F. Hoffmann La Roche Ltd.
  • GlaxoSmithKline Plc
  • Incyte Corp.
  • Ipsen Pharma
  • Jiangsu Hengrui Pharmaceuticals
  • Kyowa Kirin Co. Ltd.
  • Merck and Co. Inc.
  • Novartis AG
  • Ono Pharmaceutical Co. Ltd.
  • Regeneron Pharmaceuticals Inc.
  • Sanofi SA
  • Takeda Pharmaceutical Ltd.
  • Thermo Fisher Scientific Inc.

Qualitative and quantitative analysis of companies has been conducted to help clients understand the wider business environment as well as the strengths and weaknesses of key industry players. Data is qualitatively analyzed to categorize companies as pure play, category-focused, industry-focused, and diversified; it is quantitatively analyzed to categorize companies as dominant, leading, strong, tentative, and weak.

Recent Development and News in Cancer immunotherapy market

  • In the Pharmaceuticals industry, the shift toward localized biomanufacturing automation has reduced cross-border biological vector supply chain delays by 40%, directly impacting Cancer Immunotherapy demand by accelerating the delivery of temperature-sensitive personalized treatments to clinical facilities.
  • The widespread integration of genomic sequencing integration mandates in standard clinical diagnostic pathways has increased biomarker identification rates by 25%, directly impacting Cancer Immunotherapy demand by expanding the eligible patient population for targeted monoclonal therapies.
  • Stringent regulatory frameworks enforcing enhanced sterility compliance standards across recombinant protein synthesis facilities have increased initial operational capital requirements by 15%, directly impacting Cancer Immunotherapy supply by driving consolidation among smaller contract manufacturing organizations.
  • The adoption of lipid nanoparticle delivery optimization protocols in biological research pipelines has improved therapeutic target binding efficiency by 30%, directly impacting Cancer Immunotherapy demand by enabling more effective interventions for resilient solid tumors.

Dive into Technavio’s robust research methodology, blending expert interviews, extensive data synthesis, and validated models for unparalleled Cancer Immunotherapy Market insights. See full methodology.

Market Scope
Page number 295
Base year 2025
Historic period 2020-2024
Forecast period 2026-2030
Growth momentum & CAGR Accelerate at a CAGR of 8.3%
Market growth 2026-2030 USD 53897.5 million
Market structure Fragmented
YoY growth 2025-2026(%) 7.9%
Key countries US, Canada, Mexico, Germany, UK, France, Italy, Spain, The Netherlands, Japan, China, India, South Korea, Taiwan, Singapore, Brazil, Saudi Arabia, South Africa, Turkey, UAE, Argentina, Israel and Colombia
Competitive landscape Leading Companies, Market Positioning of Companies, Competitive Strategies, and Industry Risks

Request Free Sample

Research Analyst Overview

  • Strategic decision-making is increasingly dictated by the clinical demand for complex, targeted therapeutic interventions. Boardroom executives are heavily prioritizing investments in advanced biological pipelines to secure proprietary assets in high-growth oncology segments. The integration of precision screening protocols directly shapes product pricing and market access strategies, as diagnostic accuracy ensures therapies reach highly responsive demographics.
  • Facilities implementing these targeted protocols have achieved a 35% reduction in severe systemic toxicities compared to broad-spectrum applications. Furthermore, structural shifts toward localized cellular engineering methodologies require substantial capital commitments to dedicated biomanufacturing infrastructure. Companies leveraging innovative delivery systems successfully bypass traditional ex vivo manufacturing bottlenecks.
  • This ongoing biological evolution allows organizations to circumvent severe supply chain vulnerabilities while drastically shortening therapeutic turnaround times. As research unveils new mechanisms of tumor evasion, pharmaceutical developers continuously adapt their clinical portfolios to maintain regulatory compliance and competitive differentiation.

What are the Key Data Covered in this Cancer Immunotherapy Market Research and Growth Report?

  • What is the expected growth of the Cancer Immunotherapy Market between 2026 and 2030?

    • USD 53.90 billion, at a CAGR of 8.3%

  • What segmentation does the market report cover?

    • The report is segmented by Type (Monoclonal antibodies, Check point inhibitors, and Cancer vaccines), Application (Lung cancer, Breast cancer, Colorectal cancer, and Others), End-user (Hospitals and clinics, and Cancer research centers) and Geography (North America, Europe, Asia, Rest of World (ROW))

  • Which regions are analyzed in the report?

    • North America, Europe, Asia and Rest of World (ROW)

  • What are the key growth drivers and market challenges?

    • Expanding regulatory approvals for combination therapies, Manufacturing complexities and supply chain vulnerabilities

  • Who are the major players in the Cancer Immunotherapy Market?

    • AbbVie Inc., Amgen Inc., AstraZeneca Plc, Bayer AG, BioNTech SE, Bristol Myers Squibb Co., Eisai Co. Ltd., Eli Lilly and Co., F. Hoffmann La Roche Ltd., GlaxoSmithKline Plc, Incyte Corp., Ipsen Pharma, Jiangsu Hengrui Pharmaceuticals, Kyowa Kirin Co. Ltd., Merck and Co. Inc., Novartis AG, Ono Pharmaceutical Co. Ltd., Regeneron Pharmaceuticals Inc., Sanofi SA, Takeda Pharmaceutical Ltd. and Thermo Fisher Scientific Inc.

Market Research Insights

  • The market is rapidly advancing through the integration of sophisticated precision oncology diagnostics. Utilizing targeted companion diagnostic tools allows clinical facilities to accurately match patients with optimal biologic interventions, generating a 28% improvement in treatment response rates over conventional screening methods.
  • Furthermore, the strategic deployment of neoadjuvant therapy regimens has reduced postoperative tumor recurrence by 15%, fundamentally altering standard surgical timelines. Implementing stringent patient stratification based on precise molecular profiles lowers phase-trial attrition rates by roughly 20%, significantly accelerating commercialization timelines.
  • By transitioning patients toward highly effective adjuvant treatment protocols, healthcare institutions systematically lower long-term disease management costs while elevating overall survival metrics.

We can help! Our analysts can customize this cancer immunotherapy market research report to meet your requirements.

Get in touch

1. Executive Summary

1.1 Market overview

Executive Summary - Chart on Market Overview
Executive Summary - Data Table on Market Overview
Executive Summary - Chart on Global Market Characteristics
Executive Summary - Chart on Market by Geography
Executive Summary - Chart on Market Segmentation by Type
Executive Summary - Chart on Market Segmentation by Application
Executive Summary - Chart on Market Segmentation by End-user
Executive Summary - Chart on Incremental Growth
Executive Summary - Data Table on Incremental Growth
Executive Summary - Chart on Company Market Positioning

2. Technavio Analysis

2.1 Analysis of price sensitivity, lifecycle, customer purchase basket, adoption rates, and purchase criteria

2.2 Criticality of inputs and Factors of differentiation

Chart on Overview on criticality of inputs and factors of differentiation

2.3 Factors of disruption

Chart on Overview on factors of disruption

2.4 Impact of drivers and challenges

Chart on Impact of drivers and challenges in 2025 and 2030

3. Market Landscape

3.1 Market ecosystem

Chart on Parent Market
Data Table on - Parent Market

3.2 Market characteristics

Chart on Market characteristics analysis

3.3 Value chain analysis

Chart on Value chain analysis

4. Market Sizing

4.1 Market definition

Data Table on Offerings of companies included in the market definition

4.2 Market segment analysis

Market segments

4.3 Market size 2025

4.4 Market outlook: Forecast for 2025-2030

Chart on Global - Market size and forecast 2025-2030 ($ million)
Data Table on Global - Market size and forecast 2025-2030 ($ million)
Chart on Global Market: Year-over-year growth 2025-2030 (%)
Data Table on Global Market: Year-over-year growth 2025-2030 (%)

5. Historic Market Size

5.1 Global Cancer Immunotherapy Market 2020 - 2024

Historic Market Size - Data Table on Global Cancer Immunotherapy Market 2020 - 2024 ($ million)

5.2 Type segment analysis 2020 - 2024

Historic Market Size - Type Segment 2020 - 2024 ($ million)

5.3 Application segment analysis 2020 - 2024

Historic Market Size - Application Segment 2020 - 2024 ($ million)

5.4 End-user segment analysis 2020 - 2024

Historic Market Size - End-user Segment 2020 - 2024 ($ million)

5.5 Geography segment analysis 2020 - 2024

Historic Market Size - Geography Segment 2020 - 2024 ($ million)

5.6 Country segment analysis 2020 - 2024

Historic Market Size - Country Segment 2020 - 2024 ($ million)

6. Qualitative Analysis

6.1 Impact of AI on Global Cancer Immunotherapy Market

6.2 Impact of Geopolitical Conflicts on Global Cancer Immunotherapy Market

7. Five Forces Analysis

7.1 Five forces summary

Five forces analysis - Comparison between 2025 and 2030

7.2 Bargaining power of buyers

Bargaining power of buyers - Impact of key factors 2025 and 2030

7.3 Bargaining power of suppliers

Bargaining power of suppliers - Impact of key factors in 2025 and 2030

7.4 Threat of new entrants

Threat of new entrants - Impact of key factors in 2025 and 2030

7.5 Threat of substitutes

Threat of substitutes - Impact of key factors in 2025 and 2030

7.6 Threat of rivalry

Threat of rivalry - Impact of key factors in 2025 and 2030

7.7 Market condition

Chart on Market condition - Five forces 2025 and 2030

8. Market Segmentation by Type

8.1 Market segments

Chart on Type - Market share 2025-2030 (%)
Data Table on Type - Market share 2025-2030 (%)

8.2 Comparison by Type

Chart on Comparison by Type
Data Table on Comparison by Type

8.3 Monoclonal antibodies - Market size and forecast 2025-2030

Chart on Monoclonal antibodies - Market size and forecast 2025-2030 ($ million)
Data Table on Monoclonal antibodies - Market size and forecast 2025-2030 ($ million)
Chart on Monoclonal antibodies - Year-over-year growth 2025-2030 (%)
Data Table on Monoclonal antibodies - Year-over-year growth 2025-2030 (%)

8.4 Check point inhibitors - Market size and forecast 2025-2030

Chart on Check point inhibitors - Market size and forecast 2025-2030 ($ million)
Data Table on Check point inhibitors - Market size and forecast 2025-2030 ($ million)
Chart on Check point inhibitors - Year-over-year growth 2025-2030 (%)
Data Table on Check point inhibitors - Year-over-year growth 2025-2030 (%)

8.5 Cancer vaccines - Market size and forecast 2025-2030

Chart on Cancer vaccines - Market size and forecast 2025-2030 ($ million)
Data Table on Cancer vaccines - Market size and forecast 2025-2030 ($ million)
Chart on Cancer vaccines - Year-over-year growth 2025-2030 (%)
Data Table on Cancer vaccines - Year-over-year growth 2025-2030 (%)

8.6 Market opportunity by Type

Market opportunity by Type ($ million)
Data Table on Market opportunity by Type ($ million)

9. Market Segmentation by Application

9.1 Market segments

Chart on Application - Market share 2025-2030 (%)
Data Table on Application - Market share 2025-2030 (%)

9.2 Comparison by Application

Chart on Comparison by Application
Data Table on Comparison by Application

9.3 Lung cancer - Market size and forecast 2025-2030

Chart on Lung cancer - Market size and forecast 2025-2030 ($ million)
Data Table on Lung cancer - Market size and forecast 2025-2030 ($ million)
Chart on Lung cancer - Year-over-year growth 2025-2030 (%)
Data Table on Lung cancer - Year-over-year growth 2025-2030 (%)

9.4 Breast cancer - Market size and forecast 2025-2030

Chart on Breast cancer - Market size and forecast 2025-2030 ($ million)
Data Table on Breast cancer - Market size and forecast 2025-2030 ($ million)
Chart on Breast cancer - Year-over-year growth 2025-2030 (%)
Data Table on Breast cancer - Year-over-year growth 2025-2030 (%)

9.5 Colorectal cancer - Market size and forecast 2025-2030

Chart on Colorectal cancer - Market size and forecast 2025-2030 ($ million)
Data Table on Colorectal cancer - Market size and forecast 2025-2030 ($ million)
Chart on Colorectal cancer - Year-over-year growth 2025-2030 (%)
Data Table on Colorectal cancer - Year-over-year growth 2025-2030 (%)

9.6 Others - Market size and forecast 2025-2030

Chart on Others - Market size and forecast 2025-2030 ($ million)
Data Table on Others - Market size and forecast 2025-2030 ($ million)
Chart on Others - Year-over-year growth 2025-2030 (%)
Data Table on Others - Year-over-year growth 2025-2030 (%)

9.7 Market opportunity by Application

Market opportunity by Application ($ million)
Data Table on Market opportunity by Application ($ million)

10. Market Segmentation by End-user

10.1 Market segments

Chart on End-user - Market share 2025-2030 (%)
Data Table on End-user - Market share 2025-2030 (%)

10.2 Comparison by End-user

Chart on Comparison by End-user
Data Table on Comparison by End-user

10.3 Hospitals and clinics - Market size and forecast 2025-2030

Chart on Hospitals and clinics - Market size and forecast 2025-2030 ($ million)
Data Table on Hospitals and clinics - Market size and forecast 2025-2030 ($ million)
Chart on Hospitals and clinics - Year-over-year growth 2025-2030 (%)
Data Table on Hospitals and clinics - Year-over-year growth 2025-2030 (%)

10.4 Cancer research centers - Market size and forecast 2025-2030

Chart on Cancer research centers - Market size and forecast 2025-2030 ($ million)
Data Table on Cancer research centers - Market size and forecast 2025-2030 ($ million)
Chart on Cancer research centers - Year-over-year growth 2025-2030 (%)
Data Table on Cancer research centers - Year-over-year growth 2025-2030 (%)

10.5 Market opportunity by End-user

Market opportunity by End-user ($ million)
Data Table on Market opportunity by End-user ($ million)

11. Customer Landscape

11.1 Customer landscape overview

Analysis of price sensitivity, lifecycle, customer purchase basket, adoption rates, and purchase criteria

12. Geographic Landscape

12.1 Geographic segmentation

Chart on Market share by geography 2025-2030 (%)
Data Table on Market share by geography 2025-2030 (%)

12.2 Geographic comparison

Chart on Geographic comparison
Data Table on Geographic comparison

12.3 North America - Market size and forecast 2025-2030

Chart on North America - Market size and forecast 2025-2030 ($ million)
Data Table on North America - Market size and forecast 2025-2030 ($ million)
Chart on North America - Year-over-year growth 2025-2030 (%)
Data Table on North America - Year-over-year growth 2025-2030 (%)
Chart on Regional Comparison - North America
Data Table on Regional Comparison - North America

12.3.1 US - Market size and forecast 2025-2030

Chart on US - Market size and forecast 2025-2030 ($ million)
Data Table on US - Market size and forecast 2025-2030 ($ million)
Chart on US - Year-over-year growth 2025-2030 (%)
Data Table on US - Year-over-year growth 2025-2030 (%)

12.3.2 Canada - Market size and forecast 2025-2030

Chart on Canada - Market size and forecast 2025-2030 ($ million)
Data Table on Canada - Market size and forecast 2025-2030 ($ million)
Chart on Canada - Year-over-year growth 2025-2030 (%)
Data Table on Canada - Year-over-year growth 2025-2030 (%)

12.3.3 Mexico - Market size and forecast 2025-2030

Chart on Mexico - Market size and forecast 2025-2030 ($ million)
Data Table on Mexico - Market size and forecast 2025-2030 ($ million)
Chart on Mexico - Year-over-year growth 2025-2030 (%)
Data Table on Mexico - Year-over-year growth 2025-2030 (%)

12.4 Europe - Market size and forecast 2025-2030

Chart on Europe - Market size and forecast 2025-2030 ($ million)
Data Table on Europe - Market size and forecast 2025-2030 ($ million)
Chart on Europe - Year-over-year growth 2025-2030 (%)
Data Table on Europe - Year-over-year growth 2025-2030 (%)
Chart on Regional Comparison - Europe
Data Table on Regional Comparison - Europe

12.4.1 Germany - Market size and forecast 2025-2030

Chart on Germany - Market size and forecast 2025-2030 ($ million)
Data Table on Germany - Market size and forecast 2025-2030 ($ million)
Chart on Germany - Year-over-year growth 2025-2030 (%)
Data Table on Germany - Year-over-year growth 2025-2030 (%)

12.4.2 UK - Market size and forecast 2025-2030

Chart on UK - Market size and forecast 2025-2030 ($ million)
Data Table on UK - Market size and forecast 2025-2030 ($ million)
Chart on UK - Year-over-year growth 2025-2030 (%)
Data Table on UK - Year-over-year growth 2025-2030 (%)

12.4.3 France - Market size and forecast 2025-2030

Chart on France - Market size and forecast 2025-2030 ($ million)
Data Table on France - Market size and forecast 2025-2030 ($ million)
Chart on France - Year-over-year growth 2025-2030 (%)
Data Table on France - Year-over-year growth 2025-2030 (%)

12.4.4 Italy - Market size and forecast 2025-2030

Chart on Italy - Market size and forecast 2025-2030 ($ million)
Data Table on Italy - Market size and forecast 2025-2030 ($ million)
Chart on Italy - Year-over-year growth 2025-2030 (%)
Data Table on Italy - Year-over-year growth 2025-2030 (%)

12.4.5 Spain - Market size and forecast 2025-2030

Chart on Spain - Market size and forecast 2025-2030 ($ million)
Data Table on Spain - Market size and forecast 2025-2030 ($ million)
Chart on Spain - Year-over-year growth 2025-2030 (%)
Data Table on Spain - Year-over-year growth 2025-2030 (%)

12.4.6 The Netherlands - Market size and forecast 2025-2030

Chart on The Netherlands - Market size and forecast 2025-2030 ($ million)
Data Table on The Netherlands - Market size and forecast 2025-2030 ($ million)
Chart on The Netherlands - Year-over-year growth 2025-2030 (%)
Data Table on The Netherlands - Year-over-year growth 2025-2030 (%)

12.5 Asia - Market size and forecast 2025-2030

Chart on Asia - Market size and forecast 2025-2030 ($ million)
Data Table on Asia - Market size and forecast 2025-2030 ($ million)
Chart on Asia - Year-over-year growth 2025-2030 (%)
Data Table on Asia - Year-over-year growth 2025-2030 (%)
Chart on Regional Comparison - Asia
Data Table on Regional Comparison - Asia

12.5.1 Japan - Market size and forecast 2025-2030

Chart on Japan - Market size and forecast 2025-2030 ($ million)
Data Table on Japan - Market size and forecast 2025-2030 ($ million)
Chart on Japan - Year-over-year growth 2025-2030 (%)
Data Table on Japan - Year-over-year growth 2025-2030 (%)

12.5.2 China - Market size and forecast 2025-2030

Chart on China - Market size and forecast 2025-2030 ($ million)
Data Table on China - Market size and forecast 2025-2030 ($ million)
Chart on China - Year-over-year growth 2025-2030 (%)
Data Table on China - Year-over-year growth 2025-2030 (%)

12.5.3 India - Market size and forecast 2025-2030

Chart on India - Market size and forecast 2025-2030 ($ million)
Data Table on India - Market size and forecast 2025-2030 ($ million)
Chart on India - Year-over-year growth 2025-2030 (%)
Data Table on India - Year-over-year growth 2025-2030 (%)

12.5.4 South Korea - Market size and forecast 2025-2030

Chart on South Korea - Market size and forecast 2025-2030 ($ million)
Data Table on South Korea - Market size and forecast 2025-2030 ($ million)
Chart on South Korea - Year-over-year growth 2025-2030 (%)
Data Table on South Korea - Year-over-year growth 2025-2030 (%)

12.5.5 Taiwan - Market size and forecast 2025-2030

Chart on Taiwan - Market size and forecast 2025-2030 ($ million)
Data Table on Taiwan - Market size and forecast 2025-2030 ($ million)
Chart on Taiwan - Year-over-year growth 2025-2030 (%)
Data Table on Taiwan - Year-over-year growth 2025-2030 (%)

12.5.6 Singapore - Market size and forecast 2025-2030

Chart on Singapore - Market size and forecast 2025-2030 ($ million)
Data Table on Singapore - Market size and forecast 2025-2030 ($ million)
Chart on Singapore - Year-over-year growth 2025-2030 (%)
Data Table on Singapore - Year-over-year growth 2025-2030 (%)

12.6 Rest of World (ROW) - Market size and forecast 2025-2030

Chart on Rest of World (ROW) - Market size and forecast 2025-2030 ($ million)
Data Table on Rest of World (ROW) - Market size and forecast 2025-2030 ($ million)
Chart on Rest of World (ROW) - Year-over-year growth 2025-2030 (%)
Data Table on Rest of World (ROW) - Year-over-year growth 2025-2030 (%)
Chart on Regional Comparison - Rest of World (ROW)
Data Table on Regional Comparison - Rest of World (ROW)

12.6.1 Brazil - Market size and forecast 2025-2030

Chart on Brazil - Market size and forecast 2025-2030 ($ million)
Data Table on Brazil - Market size and forecast 2025-2030 ($ million)
Chart on Brazil - Year-over-year growth 2025-2030 (%)
Data Table on Brazil - Year-over-year growth 2025-2030 (%)

12.6.2 Saudi Arabia - Market size and forecast 2025-2030

Chart on Saudi Arabia - Market size and forecast 2025-2030 ($ million)
Data Table on Saudi Arabia - Market size and forecast 2025-2030 ($ million)
Chart on Saudi Arabia - Year-over-year growth 2025-2030 (%)
Data Table on Saudi Arabia - Year-over-year growth 2025-2030 (%)

12.6.3 South Africa - Market size and forecast 2025-2030

Chart on South Africa - Market size and forecast 2025-2030 ($ million)
Data Table on South Africa - Market size and forecast 2025-2030 ($ million)
Chart on South Africa - Year-over-year growth 2025-2030 (%)
Data Table on South Africa - Year-over-year growth 2025-2030 (%)

12.6.4 Turkey - Market size and forecast 2025-2030

Chart on Turkey - Market size and forecast 2025-2030 ($ million)
Data Table on Turkey - Market size and forecast 2025-2030 ($ million)
Chart on Turkey - Year-over-year growth 2025-2030 (%)
Data Table on Turkey - Year-over-year growth 2025-2030 (%)

12.6.5 UAE - Market size and forecast 2025-2030

Chart on UAE - Market size and forecast 2025-2030 ($ million)
Data Table on UAE - Market size and forecast 2025-2030 ($ million)
Chart on UAE - Year-over-year growth 2025-2030 (%)
Data Table on UAE - Year-over-year growth 2025-2030 (%)

12.6.6 Argentina - Market size and forecast 2025-2030

Chart on Argentina - Market size and forecast 2025-2030 ($ million)
Data Table on Argentina - Market size and forecast 2025-2030 ($ million)
Chart on Argentina - Year-over-year growth 2025-2030 (%)
Data Table on Argentina - Year-over-year growth 2025-2030 (%)

12.6.7 Israel - Market size and forecast 2025-2030

Chart on Israel - Market size and forecast 2025-2030 ($ million)
Data Table on Israel - Market size and forecast 2025-2030 ($ million)
Chart on Israel - Year-over-year growth 2025-2030 (%)
Data Table on Israel - Year-over-year growth 2025-2030 (%)

12.6.8 Colombia - Market size and forecast 2025-2030

Chart on Colombia - Market size and forecast 2025-2030 ($ million)
Data Table on Colombia - Market size and forecast 2025-2030 ($ million)
Chart on Colombia - Year-over-year growth 2025-2030 (%)
Data Table on Colombia - Year-over-year growth 2025-2030 (%)

12.7 Market opportunity by geography

Market opportunity by geography ($ million)
Data Tables on Market opportunity by geography ($ million)

13. Drivers, Challenges, and Opportunity

13.1 Market drivers

Expanding regulatory approvals for combination therapies
Academic and technological advances in immune activation
Advances in precision biomarker-driven immunotherapies

13.2 Market challenges

Manufacturing complexities and supply chain vulnerabilities
Stringent regulatory hurdles and clinical trial inefficiencies
Severe immune related adverse events and safety profile management

13.3 Impact of drivers and challenges

Impact of drivers and challenges in 2025 and 2030

13.4 Market opportunities

Advances in CAR cell therapies for complex cancers
Strategic collaborations and manufacturing agreements
Advances in personalized mRNA cancer vaccines

14. Competitive Landscape

14.1 Overview

14.2

Overview on criticality of inputs and factors of differentiation

14.3 Landscape disruption

Overview on factors of disruption

14.4 Industry risks

Impact of key risks on business

15. Competitive Analysis

15.1 Companies profiled

Companies covered

15.2 Company ranking index

15.3 Market positioning of companies

Matrix on companies position and classification

15.4 AbbVie Inc.

AbbVie Inc. - Overview
AbbVie Inc. - Business segments
AbbVie Inc. - Key news
AbbVie Inc. - Key offerings
AbbVie Inc. - Segment focus
SWOT

15.5 Amgen Inc.

Amgen Inc. - Overview
Amgen Inc. - Product / Service
Amgen Inc. - Key news
Amgen Inc. - Key offerings
SWOT

15.6 AstraZeneca Plc

AstraZeneca Plc - Overview
AstraZeneca Plc - Business segments
AstraZeneca Plc - Key news
AstraZeneca Plc - Key offerings
AstraZeneca Plc - Segment focus
SWOT

15.7 Bayer AG

Bayer AG - Overview
Bayer AG - Business segments
Bayer AG - Key news
Bayer AG - Key offerings
Bayer AG - Segment focus
SWOT

15.8 BioNTech SE

BioNTech SE - Overview
BioNTech SE - Product / Service
BioNTech SE - Key offerings
SWOT

15.9 Bristol Myers Squibb Co.

Bristol Myers Squibb Co. - Overview
Bristol Myers Squibb Co. - Product / Service
Bristol Myers Squibb Co. - Key news
Bristol Myers Squibb Co. - Key offerings
SWOT

15.10 Eli Lilly and Co.

Eli Lilly and Co. - Overview
Eli Lilly and Co. - Product / Service
Eli Lilly and Co. - Key news
Eli Lilly and Co. - Key offerings
SWOT

15.11 F. Hoffmann La Roche Ltd.

F. Hoffmann La Roche Ltd. - Overview
F. Hoffmann La Roche Ltd. - Business segments
F. Hoffmann La Roche Ltd. - Key news
F. Hoffmann La Roche Ltd. - Key offerings
F. Hoffmann La Roche Ltd. - Segment focus
SWOT

15.12 GlaxoSmithKline Plc

GlaxoSmithKline Plc - Overview
GlaxoSmithKline Plc - Business segments
GlaxoSmithKline Plc - Key news
GlaxoSmithKline Plc - Key offerings
GlaxoSmithKline Plc - Segment focus
SWOT

15.13 Ipsen Pharma

Ipsen Pharma - Overview
Ipsen Pharma - Business segments
Ipsen Pharma - Key offerings
Ipsen Pharma - Segment focus
SWOT

15.14 Merck and Co. Inc.

Merck and Co. Inc. - Overview
Merck and Co. Inc. - Business segments
Merck and Co. Inc. - Key news
Merck and Co. Inc. - Key offerings
Merck and Co. Inc. - Segment focus
SWOT

15.15 Novartis AG

Novartis AG - Overview
Novartis AG - Business segments
Novartis AG - Key news
Novartis AG - Key offerings
Novartis AG - Segment focus
SWOT

15.16 Sanofi SA

Sanofi SA - Overview
Sanofi SA - Business segments
Sanofi SA - Key news
Sanofi SA - Key offerings
Sanofi SA - Segment focus
SWOT

15.17 Takeda Pharmaceutical Ltd.

Takeda Pharmaceutical Ltd. - Overview
Takeda Pharmaceutical Ltd. - Business segments
Takeda Pharmaceutical Ltd. - Key news
Takeda Pharmaceutical Ltd. - Key offerings
Takeda Pharmaceutical Ltd. - Segment focus
SWOT

15.18 Thermo Fisher Scientific Inc.

Thermo Fisher Scientific Inc. - Overview
Thermo Fisher Scientific Inc. - Business segments
Thermo Fisher Scientific Inc. - Key news
Thermo Fisher Scientific Inc. - Key offerings
Thermo Fisher Scientific Inc. - Segment focus
SWOT

16. Appendix

16.1 Scope of the report

Market definition
Objectives
Notes and caveats

16.2 Inclusions and exclusions checklist

Inclusions checklist
Exclusions checklist

16.3 Currency conversion rates for US$

16.4 Research methodology

16.5 Data procurement

Information sources

16.6 Data validation

16.7 Validation techniques employed for market sizing

16.8 Data synthesis

16.9 360 degree market analysis

16.10 List of abbreviations

Research Methodology

Technavio presents a detailed picture of the market by way of study, synthesis, and summation of data from multiple sources. The analysts have presented the various facets of the market with a particular focus on identifying the key industry influencers. The data thus presented is comprehensive, reliable, and the result of extensive research, both primary and secondary.

INFORMATION SOURCES

Primary sources

  • Manufacturers and suppliers
  • Channel partners
  • Industry experts
  • Strategic decision makers

Secondary sources

  • Industry journals and periodicals
  • Government data
  • Financial reports of key industry players
  • Historical data
  • Press releases

DATA ANALYSIS

Data Synthesis

  • Collation of data
  • Estimation of key figures
  • Analysis of derived insights

Data Validation

  • Triangulation with data models
  • Reference against proprietary databases
  • Corroboration with industry experts

REPORT WRITING

Qualitative

  • Market drivers
  • Market challenges
  • Market trends
  • Five forces analysis

Quantitative

  • Market size and forecast
  • Market segmentation
  • Geographical insights
  • Competitive landscape

Interested in this report?

Get your sample now to see our research methodology and insights!

Download Now

Frequently Asked Questions

Cancer Immunotherapy market growth will increase by USD 53897.5 million during 2026-2030.

The Cancer Immunotherapy market is expected to grow at a CAGR of 8.3% during 2026-2030.

Cancer Immunotherapy market is segmented by Type (Monoclonal antibodies, Check point inhibitors, Cancer vaccines) Application (Lung cancer, Breast cancer, Colorectal cancer, Others) End-user (Hospitals and clinics, Cancer research centers)

AbbVie Inc., Amgen Inc., AstraZeneca Plc, Bayer AG, BioNTech SE, Bristol Myers Squibb Co., Eisai Co. Ltd., Eli Lilly and Co., F. Hoffmann La Roche Ltd., GlaxoSmithKline Plc, Incyte Corp., Ipsen Pharma, Jiangsu Hengrui Pharmaceuticals, Kyowa Kirin Co. Ltd., Merck and Co. Inc., Novartis AG, Ono Pharmaceutical Co. Ltd., Regeneron Pharmaceuticals Inc., Sanofi SA, Takeda Pharmaceutical Ltd., Thermo Fisher Scientific Inc. are a few of the key vendors in the Cancer Immunotherapy market.

North America will register the highest growth rate of 44.2% among the other regions. Therefore, the Cancer Immunotherapy market in North America is expected to garner significant business opportunities for the vendors during the forecast period.

US, Canada, Mexico, Germany, UK, France, Italy, Spain, The Netherlands, Japan, China, India, South Korea, Taiwan, Singapore, Brazil, Saudi Arabia, South Africa, Turkey, UAE, Argentina, Israel, Colombia

  • Expanding regulatory approvals for combination therapies is the driving factor this market.

The Cancer Immunotherapy market vendors should focus on grabbing business opportunities from the Type segment as it accounted for the largest market share in the base year.
RIA - Research AI Assistant
Ask RIA
