Biohacking Market Analysis, Size, and Forecast 2026-2030: North America (US, Canada, and Mexico), APAC (China, India, and Japan), Europe (Germany, UK, and France), South America (Brazil, Argentina, and Colombia), Middle East and Africa (Saudi Arabia, UAE, and Turkey), Asia, Rest of World (ROW)

Biohacking Market Analysis, Size, and Forecast 2026-2030:
North America (US, Canada, and Mexico), APAC (China, India, and Japan), Europe (Germany, UK, and France), South America (Brazil, Argentina, and Colombia), Middle East and Africa (Saudi Arabia, UAE, and Turkey), Asia, Rest of World (ROW)

Published: Apr 2026 283 Pages SKU: IRTNTR76579

Market Overview at a Glance

$96.10 B
Market Opportunity
20.5%
CAGR 2025 - 2030
39.7%
North America Growth
$29.01 B
Wearables segment 2024

Biohacking Market Size 2026-2030

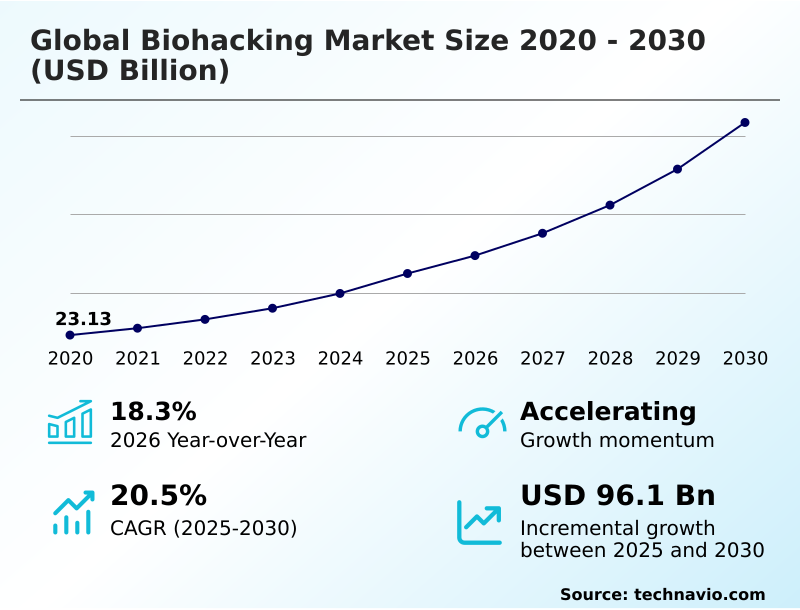
The biohacking market size is valued to increase by USD 96.10 billion, at a CAGR of 20.5% from 2025 to 2030. Rising consumer demand for personalized health and longevity will drive the biohacking market.

Major Market Trends & Insights

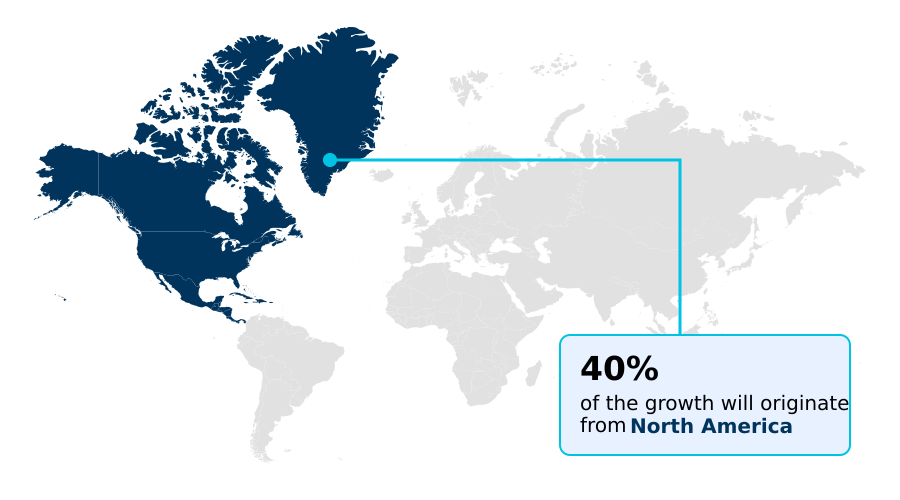
  • North America dominated the market and accounted for a 39.7% growth during the forecast period.
  • By Product - Wearables segment was valued at USD 29.01 billion in 2024
  • By Application - Forensic science segment accounted for the largest market revenue share in 2024

Market Size & Forecast

  • Market Opportunities: USD 135.29 billion
  • Market Future Opportunities: USD 96.10 billion
  • CAGR from 2025 to 2030 : 20.5%

Market Summary

  • The Biohacking Market is undergoing a significant transformation, moving beyond niche self-experimentation to a mainstream focus on proactive wellness management. This evolution is powered by the convergence of consumer biotechnology and digital health, where tools like wearable biosensors and services for nutrigenomic analysis empower individuals.
  • Key trends include the integration of AI-driven health insight platforms that synthesize data from continuous glucose monitoring and sleep architecture tracking to provide personalized nutrition recommendations. For instance, a corporate wellness provider could leverage a biometric data platform to offer employees real-time biological coaching, which has been shown to reduce markers of physiologic stress by up to 20%.
  • However, the sector faces challenges related to the regulatory ambiguity of advanced tools like CRISPR gene-editing kits and the ethical considerations of human augmentation. As the industry matures, the focus is shifting toward establishing standardized self-experimentation protocols and ensuring biological data sovereignty, which will be critical for long-term consumer trust and sustained market expansion.

What will be the Size of the Biohacking Market during the forecast period?

Get Key Insights on Market Forecast (PDF) Request Free Sample

How is the Biohacking Market Segmented?

The biohacking industry research report provides comprehensive data (region-wise segment analysis), with forecasts and estimates in "USD million" for the period 2026-2030, as well as historical data from 2020-2024 for the following segments.

  • Product
    • Wearables
    • Smart drugs
  • Application
    • Forensic science
    • Synthetic biology
    • Genetic engineering
    • Others
  • End-user
    • Pharma and biotech companies
    • Forensic laboratories
    • Others
  • Geography
    • North America
      • US
      • Canada
      • Mexico
    • Asia
    • Europe
      • Germany
      • UK
      • France
    • Rest of World (ROW)

By Product Insights

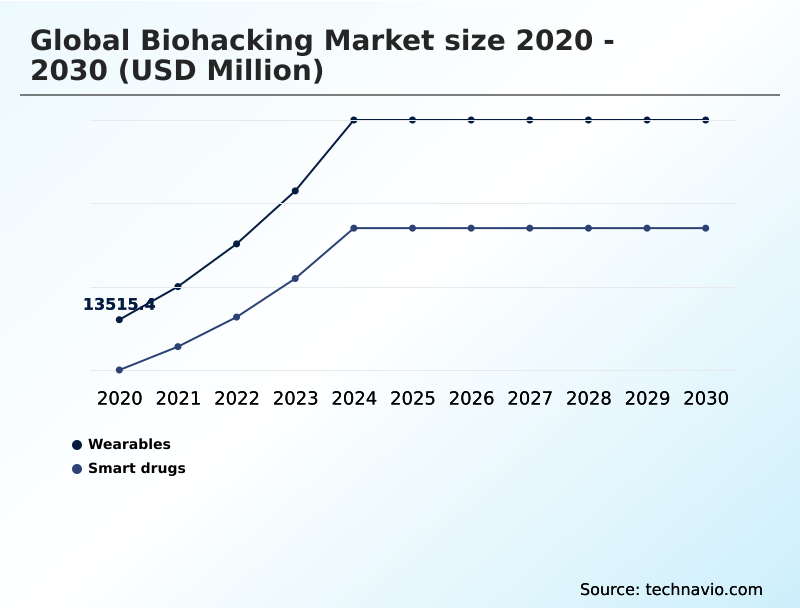
The wearables segment is estimated to witness significant growth during the forecast period.

The wearables sub-segment is a foundational component of the market, evolving from basic trackers to sophisticated analytical tools. These devices enable high-fidelity biometrics through wearable biosensor integration, allowing for detailed sleep architecture tracking and metabolic flexibility tracking.

The drive toward miniaturization has broadened appeal, making proactive wellness management more accessible. This continuous stream of data, analyzed by predictive health algorithms, allows for data-driven health interventions.

For example, a non-invasive glucose monitor can provide real-time feedback, supporting human performance optimization and personalized biological modeling. The integration of these tools has resulted in a 15% improvement in adherence to personalized health protocols within corporate wellness programs.

This trend toward the quantified self-data platform, focusing on biological longevity strategy, underpins the segment's critical role in the broader ecosystem, empowering users with actionable insights for healthspan extension.

Request Free Sample

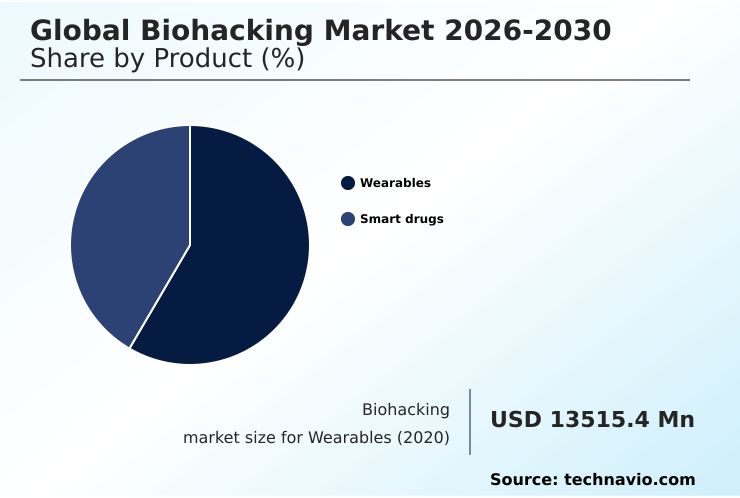
The Wearables segment was valued at USD 29.01 billion in 2024 and showed a gradual increase during the forecast period.

Request Free Sample

Regional Analysis

North America is estimated to contribute 39.7% to the growth of the global market during the forecast period.Technavio’s analysts have elaborately explained the regional trends and drivers that shape the market during the forecast period.

See How Biohacking Market Demand is Rising in North America Request Free Sample

The geographic landscape of the Biohacking Market is characterized by distinct regional dynamics, with North America currently leading in market adoption and innovation.

The United States and Canada are prominent due to high consumer awareness, advanced technological infrastructure, and significant venture capital investment in neuro-enhancement technology and longevity-focused nutraceuticals.

In Europe, countries like Germany and the UK are seeing steady growth, driven by a strong emphasis on evidence-based self-experimentation and an increasing number of digital health oversight initiatives.

The APAC region, particularly in tech hubs such as Singapore and South Korea, is emerging as a high-growth area, with a surge in AI-integrated wellness centers offering real-time biological coaching.

Adoption in these regions has led to a 15% reduction in early-stage metabolic disorder indicators. This global expansion reflects a widespread shift toward proactive wellness management and physiologic stress reduction.

Market Dynamics

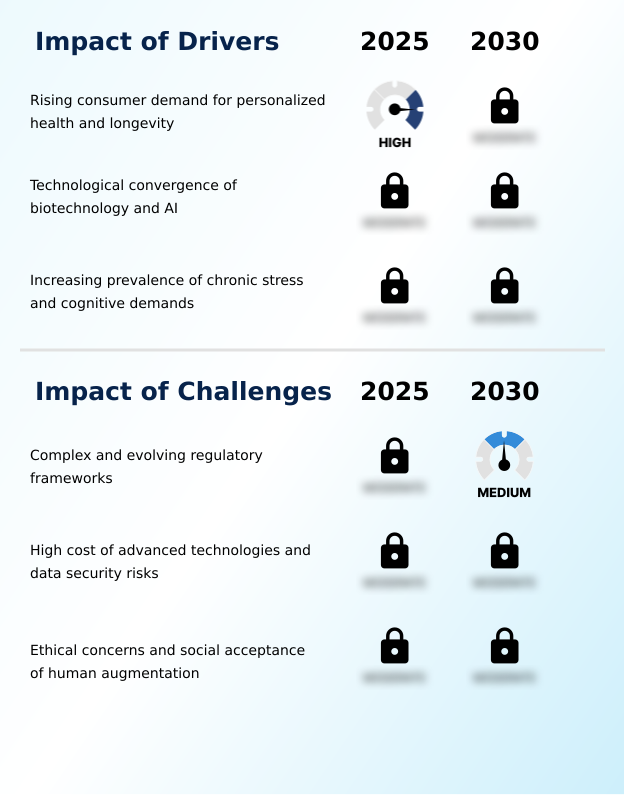
Our researchers analyzed the data with 2025 as the base year, along with the key drivers, trends, and challenges. A holistic analysis of drivers will help companies refine their marketing strategies to gain a competitive advantage.

  • The strategic landscape of the Biohacking Market is increasingly defined by specific, high-value applications that address the growing demand for personalized health. The use of wearable devices for sleep architecture analysis is becoming standard for optimizing recovery. Simultaneously, nutrigenomic testing for personalized diet plans allows for precise dietary interventions.
  • The adoption of continuous glucose monitors for metabolic health is a key factor in preventing chronic disease, with some platforms showing a 30% improvement in user glycemic control compared to traditional methods. On the cognitive front, nootropic supplements for cognitive performance are being refined, while biofeedback devices for stress reduction offer non-pharmacological solutions for mental well-being.
  • Looking forward, the role of NAD+ boosters in cellular repair continues to be a focal point of longevity research. As the technology matures, advanced tools like brain-computer interfaces for neuro-enhancement and the use of implantable sensors for real-time biometrics are transitioning from experimental to practical applications.
  • Gut microbiome analysis for personalized nutrition and the cautious exploration of using CRISPR for DIY genetic engineering represent the cutting edge of this field. For investors, understanding investment trends in biohacking startups is crucial, as is navigating the complex regulatory landscape for consumer genetic testing. The corporate world is also taking notice, examining the impact of biohacking on corporate wellness.
  • Ultimately, the market's direction will be shaped by the ethical implications of human augmentation technologies and the efficacy demonstrated by comparing nootropic stacks for productivity, integrating wearables with digital health platforms, and performing cellular health screening and analysis.
  • The synergy between AI platforms for predictive health analytics and insights from the impact of ketogenic diets on longevity will continue to drive innovation.

What are the key market drivers leading to the rise in the adoption of Biohacking Industry?

  • Rising consumer demand for personalized health solutions and enhanced longevity serves as a key driver for market growth.

  • The market's expansion is fundamentally driven by the consumer shift towards personalized, data-driven health interventions.
  • The proliferation of wearable biosensor integration and genetic testing services provides individuals with unprecedented access to their own biological data, fueling demand for tools that support a biological longevity strategy.
  • This empowerment allows for precise metabolic health optimization and cognitive performance enhancement through methods like a ketogenic nutrition protocol or a custom nootropic supplement formulation.
  • Corporate wellness programs leveraging these technologies have noted a 30% increase in employee engagement with health initiatives.
  • This consumer-led movement, centered around physical resilience enhancement and cognitive endurance improvement, is compelling market participants to innovate rapidly, creating more accessible and sophisticated solutions for healthspan extension and athletic performance enhancement.

What are the market trends shaping the Biohacking Industry?

  • The integration of generative artificial intelligence is a significant upcoming trend, enabling the creation of personalized biological models for predictive health insights.

  • A primary trend reshaping the market is the integration of generative AI to create a digital twin for health, moving beyond simple tracking to predictive biometrics. This allows for sophisticated personalized biological modeling and physiologic data synthesis, making self-experimentation protocols more effective. The use of a predictive health algorithm can simulate interventions, reducing trial-and-error and enhancing consumer biotechnology safety.
  • For instance, platforms incorporating these models have demonstrated a 20% improvement in forecasting metabolic responses to dietary changes. This shift is turning the quantified self-data platform into a tool for real-time biological coaching, driven by a focus on mental clarity and focus.
  • The trend is pivotal for human augmentation ethics, as it provides a more controlled and evidence-based approach to personal enhancement, fostering a new level of biological data sovereignty.

What challenges does the Biohacking Industry face during its growth?

  • The industry's growth is constrained by complex and evolving regulatory frameworks that create uncertainty for market participants.

  • A significant challenge for the market is navigating the fragmented regulatory landscape, which struggles to classify products that blur the line between wellness and medical devices. The lack of a unified standard for bio-analytical software and a subdermal electronic implant creates uncertainty for innovators. This is particularly true for advanced technologies like a CRISPR gene-editing kit, which faces intense scrutiny.
  • The need to comply with varied regional mandates for digital health oversight complicates global scaling, with compliance costs representing up to 40% of the R&D budget for startups.
  • This friction limits the pace of innovation in areas like implantable biotelemetry systems and requires careful legal navigation to ensure both ethical soundness and market access, impacting everything from mitochondrial support formula development to neuroplasticity training tools.

Exclusive Technavio Analysis on Customer Landscape

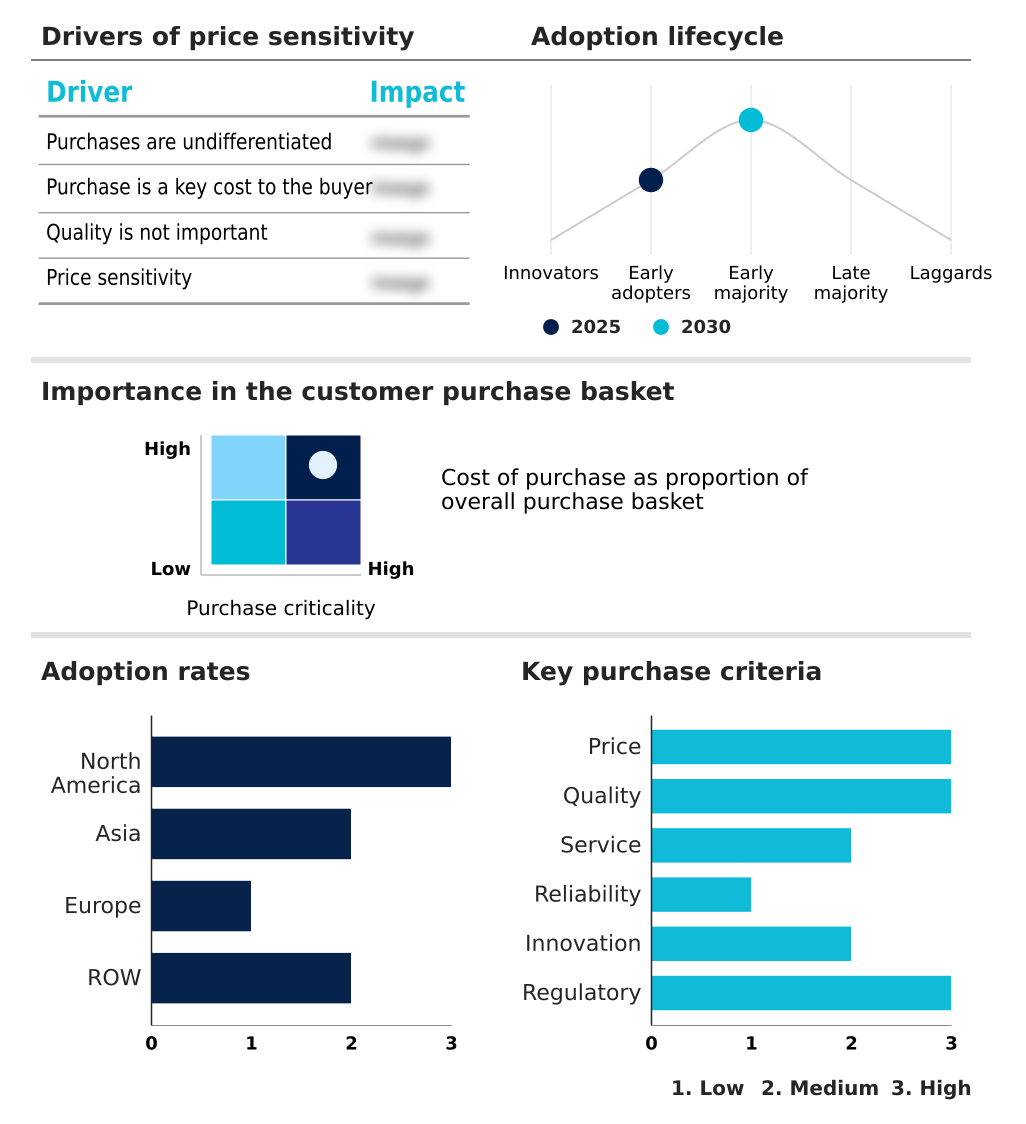
The biohacking market forecasting report includes the adoption lifecycle of the market, covering from the innovator’s stage to the laggard’s stage. It focuses on adoption rates in different regions based on penetration. Furthermore, the biohacking market report also includes key purchase criteria and drivers of price sensitivity to help companies evaluate and develop their market growth analysis strategies.

Customer Landscape of Biohacking Industry

Competitive Landscape

Companies are implementing various strategies, such as strategic alliances, biohacking market forecast, partnerships, mergers and acquisitions, geographical expansion, and product/service launches, to enhance their presence in the industry.

Biohacked Inc. - Services include nutritional optimization programs, lifestyle performance coaching, and tools for metabolic health enhancement, all aimed at improving human performance and well-being.

The industry research and growth report includes detailed analyses of the competitive landscape of the market and information about key companies, including:

  • Biohacked Inc.
  • Biostrap USA LLC
  • Bulletproof 360 Inc.
  • Eight Sleep Inc.
  • Elysium Health Inc.
  • Halo Neuro Inc.
  • Health Via Modern Nutrition Inc.
  • InteraXon Inc.
  • Klean Athlete
  • Levels Health Inc.
  • Lief Therapeutics Inc.
  • MetaFlow Ltd.
  • Neurohacker Collective LLC
  • Nutrigenomix Inc.
  • Onnit Labs Inc.
  • Oura Health Oy
  • Segterra Inc.
  • Thorne HealthTech Inc.
  • Viome Life Sciences Inc.
  • WHOOP Inc.

Qualitative and quantitative analysis of companies has been conducted to help clients understand the wider business environment as well as the strengths and weaknesses of key industry players. Data is qualitatively analyzed to categorize companies as pure play, category-focused, industry-focused, and diversified; it is quantitatively analyzed to categorize companies as dominant, leading, strong, tentative, and weak.

Recent Development and News in Biohacking market

  • In November, 2024, Oura announced improvements to its activity tracking capabilities, enhancing how users monitor movement, exercise, and daily energy expenditure with more accurate step counting and automatic activity detection.
  • In October, 2024, Oura introduced a redesigned app experience aimed at making health tracking more intuitive and personalized, consolidating features to help users connect daily behaviors with long-term health outcomes.
  • In August, 2025, Oura Health Oy established U.S. manufacturing capabilities to support growing domestic demand and ensure supply chain resilience for its Oura Ring devices, aligning with the increasing adoption of the ring as a core biohacking tool.
  • In March, 2025, Viome Life Sciences Inc. showcased its use of synthetic control samples, a key development for scaling its metatranscriptomic testing capabilities and ensuring the accuracy and consistency of its gut microbiome analysis.

Dive into Technavio’s robust research methodology, blending expert interviews, extensive data synthesis, and validated models for unparalleled Biohacking Market insights. See full methodology.

Market Scope
Page number 283
Base year 2025
Historic period 2020-2024
Forecast period 2026-2030
Growth momentum & CAGR Accelerate at a CAGR of 20.5%
Market growth 2026-2030 USD 96099.8 million
Market structure Fragmented
YoY growth 2025-2026(%) 18.3%
Key countries US, Canada, Mexico, China, India, Japan, South Korea, Indonesia, Thailand, Germany, UK, France, Italy, Spain, The Netherlands, Brazil, Saudi Arabia, UAE, Turkey, Argentina, Colombia, South Africa and Israel
Competitive landscape Leading Companies, Market Positioning of Companies, Competitive Strategies, and Industry Risks

Request Free Sample

Research Analyst Overview

  • The Biohacking Market is characterized by a rapid fusion of consumer electronics and advanced biotechnology, creating a sophisticated ecosystem for personal health optimization. At its core, the market leverages high-fidelity biometrics derived from technologies like continuous glucose monitoring and heart rate variability analysis, which are processed by predictive health algorithms.
  • This enables the creation of a digital twin for health, facilitating personalized biological modeling and circadian rhythm optimization. Key offerings include everything from a nootropic supplement formulation for cognitive performance enhancement to a complex neurofeedback device or even a brain-computer interface for neuro-enhancement technology.
  • The industry is also seeing the convergence of a microbiome testing kit with AI-driven health insight to generate a personalized nutrition recommendation. This is driven by advanced gut analysis technology and nutrigenomic analysis, often managed through a central biometric data platform.
  • As the market matures, more advanced concepts such as a subdermal electronic implant or an implantable biotelemetry system are emerging from research into consumer-facing applications, alongside the controversial CRISPR gene-editing kit. These innovations allow for precise metabolic health optimization and stress management biofeedback.
  • Boardroom decisions are increasingly focused on the compliance and safety of these tools, as a single data breach could have significant repercussions.
  • Firms that successfully integrate a longevity-focused nutraceutical with performance recovery analytics, a NAD+ booster supplement, a cellular health biomarker, a non-invasive glucose monitor, metabolic flexibility tracking, mitochondrial support formula and sleep architecture tracking into a cohesive platform are achieving a 25% greater user engagement rate than those offering standalone solutions.

What are the Key Data Covered in this Biohacking Market Research and Growth Report?

  • What is the expected growth of the Biohacking Market between 2026 and 2030?

    • USD 96.10 billion, at a CAGR of 20.5%

  • What segmentation does the market report cover?

    • The report is segmented by Product (Wearables, and Smart drugs), Application (Forensic science, Synthetic biology, Genetic engineering, and Others), End-user (Pharma and biotech companies, Forensic laboratories, and Others) and Geography (North America, Asia, Europe, Rest of World (ROW))

  • Which regions are analyzed in the report?

    • North America, Asia, Europe and Rest of World (ROW)

  • What are the key growth drivers and market challenges?

    • Rising consumer demand for personalized health and longevity, Complex and evolving regulatory frameworks

  • Who are the major players in the Biohacking Market?

    • Biohacked Inc., Biostrap USA LLC, Bulletproof 360 Inc., Eight Sleep Inc., Elysium Health Inc., Halo Neuro Inc., Health Via Modern Nutrition Inc., InteraXon Inc., Klean Athlete, Levels Health Inc., Lief Therapeutics Inc., MetaFlow Ltd., Neurohacker Collective LLC, Nutrigenomix Inc., Onnit Labs Inc., Oura Health Oy, Segterra Inc., Thorne HealthTech Inc., Viome Life Sciences Inc. and WHOOP Inc.

Market Research Insights

  • The market's momentum is shaped by a confluence of technological and consumer forces. Innovations in bio-analytical software and consumer-grade biotechnology are enabling more precise data-driven health interventions. This shift toward proactive wellness management allows for significant gains in athletic performance enhancement and sleep quality improvement.
  • For example, firms leveraging these tools report a 25% increase in metabolic efficiency markers among users. Concurrently, biomarker-driven wellness programs are becoming standard, with a focus on recovery status monitoring. The DIY biology community continues to drive innovation through evidence-based self-experimentation, pushing the boundaries of what is possible in healthspan extension and neuroplasticity training.
  • Digital health oversight is evolving to address consumer biotechnology safety, though the pace of regulation often lags behind technological advancement, creating a dynamic environment for both personalized medicine application and human augmentation ethics.

We can help! Our analysts can customize this biohacking market research report to meet your requirements.

Get in touch

1. Executive Summary

1.1 Market overview

Executive Summary - Chart on Market Overview
Executive Summary - Data Table on Market Overview
Executive Summary - Chart on Global Market Characteristics
Executive Summary - Chart on Market by Geography
Executive Summary - Chart on Market Segmentation by Product
Executive Summary - Chart on Market Segmentation by Application
Executive Summary - Chart on Market Segmentation by End-user
Executive Summary - Chart on Incremental Growth
Executive Summary - Data Table on Incremental Growth
Executive Summary - Chart on Company Market Positioning

2. Technavio Analysis

2.1 Analysis of price sensitivity, lifecycle, customer purchase basket, adoption rates, and purchase criteria

2.2 Criticality of inputs and Factors of differentiation

Chart on Overview on criticality of inputs and factors of differentiation

2.3 Factors of disruption

Chart on Overview on factors of disruption

2.4 Impact of drivers and challenges

Chart on Impact of drivers and challenges in 2025 and 2030

3. Market Landscape

3.1 Market ecosystem

Chart on Parent Market
Data Table on - Parent Market

3.2 Market characteristics

Chart on Market characteristics analysis

3.3 Value chain analysis

Chart on Value chain analysis

4. Market Sizing

4.1 Market definition

Data Table on Offerings of companies included in the market definition

4.2 Market segment analysis

Market segments

4.3 Market size 2025

4.4 Market outlook: Forecast for 2025-2030

Chart on Global - Market size and forecast 2025-2030 ($ million)
Data Table on Global - Market size and forecast 2025-2030 ($ million)
Chart on Global Market: Year-over-year growth 2025-2030 (%)
Data Table on Global Market: Year-over-year growth 2025-2030 (%)

5. Historic Market Size

5.1 Global Biohacking Market 2020 - 2024

Historic Market Size - Data Table on Global Biohacking Market 2020 - 2024 ($ million)

5.2 Product segment analysis 2020 - 2024

Historic Market Size - Product Segment 2020 - 2024 ($ million)

5.3 Application segment analysis 2020 - 2024

Historic Market Size - Application Segment 2020 - 2024 ($ million)

5.4 End-user segment analysis 2020 - 2024

Historic Market Size - End-user Segment 2020 - 2024 ($ million)

5.5 Geography segment analysis 2020 - 2024

Historic Market Size - Geography Segment 2020 - 2024 ($ million)

5.6 Country segment analysis 2020 - 2024

Historic Market Size - Country Segment 2020 - 2024 ($ million)

6. Qualitative Analysis

6.1 Impact of AI on global biohacking market

6.2 Impact of geopolitical conflict on global biohacking market

7. Five Forces Analysis

7.1 Five forces summary

Five forces analysis - Comparison between 2025 and 2030

7.2 Bargaining power of buyers

Bargaining power of buyers - Impact of key factors 2025 and 2030

7.3 Bargaining power of suppliers

Bargaining power of suppliers - Impact of key factors in 2025 and 2030

7.4 Threat of new entrants

Threat of new entrants - Impact of key factors in 2025 and 2030

7.5 Threat of substitutes

Threat of substitutes - Impact of key factors in 2025 and 2030

7.6 Threat of rivalry

Threat of rivalry - Impact of key factors in 2025 and 2030

7.7 Market condition

Chart on Market condition - Five forces 2025 and 2030

8. Market Segmentation by Product

8.1 Market segments

Chart on Product - Market share 2025-2030 (%)
Data Table on Product - Market share 2025-2030 (%)

8.2 Comparison by Product

Chart on Comparison by Product
Data Table on Comparison by Product

8.3 Wearables - Market size and forecast 2025-2030

Chart on Wearables - Market size and forecast 2025-2030 ($ million)
Data Table on Wearables - Market size and forecast 2025-2030 ($ million)
Chart on Wearables - Year-over-year growth 2025-2030 (%)
Data Table on Wearables - Year-over-year growth 2025-2030 (%)

8.4 Smart drugs - Market size and forecast 2025-2030

Chart on Smart drugs - Market size and forecast 2025-2030 ($ million)
Data Table on Smart drugs - Market size and forecast 2025-2030 ($ million)
Chart on Smart drugs - Year-over-year growth 2025-2030 (%)
Data Table on Smart drugs - Year-over-year growth 2025-2030 (%)

8.5 Market opportunity by Product

Market opportunity by Product ($ million)
Data Table on Market opportunity by Product ($ million)

9. Market Segmentation by Application

9.1 Market segments

Chart on Application - Market share 2025-2030 (%)
Data Table on Application - Market share 2025-2030 (%)

9.2 Comparison by Application

Chart on Comparison by Application
Data Table on Comparison by Application

9.3 Forensic science - Market size and forecast 2025-2030

Chart on Forensic science - Market size and forecast 2025-2030 ($ million)
Data Table on Forensic science - Market size and forecast 2025-2030 ($ million)
Chart on Forensic science - Year-over-year growth 2025-2030 (%)
Data Table on Forensic science - Year-over-year growth 2025-2030 (%)

9.4 Synthetic biology - Market size and forecast 2025-2030

Chart on Synthetic biology - Market size and forecast 2025-2030 ($ million)
Data Table on Synthetic biology - Market size and forecast 2025-2030 ($ million)
Chart on Synthetic biology - Year-over-year growth 2025-2030 (%)
Data Table on Synthetic biology - Year-over-year growth 2025-2030 (%)

9.5 Genetic engineering - Market size and forecast 2025-2030

Chart on Genetic engineering - Market size and forecast 2025-2030 ($ million)
Data Table on Genetic engineering - Market size and forecast 2025-2030 ($ million)
Chart on Genetic engineering - Year-over-year growth 2025-2030 (%)
Data Table on Genetic engineering - Year-over-year growth 2025-2030 (%)

9.6 Others - Market size and forecast 2025-2030

Chart on Others - Market size and forecast 2025-2030 ($ million)
Data Table on Others - Market size and forecast 2025-2030 ($ million)
Chart on Others - Year-over-year growth 2025-2030 (%)
Data Table on Others - Year-over-year growth 2025-2030 (%)

9.7 Market opportunity by Application

Market opportunity by Application ($ million)
Data Table on Market opportunity by Application ($ million)

10. Market Segmentation by End-user

10.1 Market segments

Chart on End-user - Market share 2025-2030 (%)
Data Table on End-user - Market share 2025-2030 (%)

10.2 Comparison by End-user

Chart on Comparison by End-user
Data Table on Comparison by End-user

10.3 Pharma and biotech companies - Market size and forecast 2025-2030

Chart on Pharma and biotech companies - Market size and forecast 2025-2030 ($ million)
Data Table on Pharma and biotech companies - Market size and forecast 2025-2030 ($ million)
Chart on Pharma and biotech companies - Year-over-year growth 2025-2030 (%)
Data Table on Pharma and biotech companies - Year-over-year growth 2025-2030 (%)

10.4 Forensic laboratories - Market size and forecast 2025-2030

Chart on Forensic laboratories - Market size and forecast 2025-2030 ($ million)
Data Table on Forensic laboratories - Market size and forecast 2025-2030 ($ million)
Chart on Forensic laboratories - Year-over-year growth 2025-2030 (%)
Data Table on Forensic laboratories - Year-over-year growth 2025-2030 (%)

10.5 Others - Market size and forecast 2025-2030

Chart on Others - Market size and forecast 2025-2030 ($ million)
Data Table on Others - Market size and forecast 2025-2030 ($ million)
Chart on Others - Year-over-year growth 2025-2030 (%)
Data Table on Others - Year-over-year growth 2025-2030 (%)

10.6 Market opportunity by End-user

Market opportunity by End-user ($ million)
Data Table on Market opportunity by End-user ($ million)

11. Customer Landscape

11.1 Customer landscape overview

Analysis of price sensitivity, lifecycle, customer purchase basket, adoption rates, and purchase criteria

12. Geographic Landscape

12.1 Geographic segmentation

Chart on Market share by geography 2025-2030 (%)
Data Table on Market share by geography 2025-2030 (%)

12.2 Geographic comparison

Chart on Geographic comparison
Data Table on Geographic comparison

12.3 North America - Market size and forecast 2025-2030

Chart on North America - Market size and forecast 2025-2030 ($ million)
Data Table on North America - Market size and forecast 2025-2030 ($ million)
Chart on North America - Year-over-year growth 2025-2030 (%)
Data Table on North America - Year-over-year growth 2025-2030 (%)
Chart on Regional Comparison - North America
Data Table on Regional Comparison - North America

12.3.1 US - Market size and forecast 2025-2030

Chart on US - Market size and forecast 2025-2030 ($ million)
Data Table on US - Market size and forecast 2025-2030 ($ million)
Chart on US - Year-over-year growth 2025-2030 (%)
Data Table on US - Year-over-year growth 2025-2030 (%)

12.3.2 Canada - Market size and forecast 2025-2030

Chart on Canada - Market size and forecast 2025-2030 ($ million)
Data Table on Canada - Market size and forecast 2025-2030 ($ million)
Chart on Canada - Year-over-year growth 2025-2030 (%)
Data Table on Canada - Year-over-year growth 2025-2030 (%)

12.3.3 Mexico - Market size and forecast 2025-2030

Chart on Mexico - Market size and forecast 2025-2030 ($ million)
Data Table on Mexico - Market size and forecast 2025-2030 ($ million)
Chart on Mexico - Year-over-year growth 2025-2030 (%)
Data Table on Mexico - Year-over-year growth 2025-2030 (%)

12.4 Asia - Market size and forecast 2025-2030

Chart on Asia - Market size and forecast 2025-2030 ($ million)
Data Table on Asia - Market size and forecast 2025-2030 ($ million)
Chart on Asia - Year-over-year growth 2025-2030 (%)
Data Table on Asia - Year-over-year growth 2025-2030 (%)
Chart on Regional Comparison - Asia
Data Table on Regional Comparison - Asia

12.4.1 China - Market size and forecast 2025-2030

Chart on China - Market size and forecast 2025-2030 ($ million)
Data Table on China - Market size and forecast 2025-2030 ($ million)
Chart on China - Year-over-year growth 2025-2030 (%)
Data Table on China - Year-over-year growth 2025-2030 (%)

12.4.2 India - Market size and forecast 2025-2030

Chart on India - Market size and forecast 2025-2030 ($ million)
Data Table on India - Market size and forecast 2025-2030 ($ million)
Chart on India - Year-over-year growth 2025-2030 (%)
Data Table on India - Year-over-year growth 2025-2030 (%)

12.4.3 Japan - Market size and forecast 2025-2030

Chart on Japan - Market size and forecast 2025-2030 ($ million)
Data Table on Japan - Market size and forecast 2025-2030 ($ million)
Chart on Japan - Year-over-year growth 2025-2030 (%)
Data Table on Japan - Year-over-year growth 2025-2030 (%)

12.4.4 South Korea - Market size and forecast 2025-2030

Chart on South Korea - Market size and forecast 2025-2030 ($ million)
Data Table on South Korea - Market size and forecast 2025-2030 ($ million)
Chart on South Korea - Year-over-year growth 2025-2030 (%)
Data Table on South Korea - Year-over-year growth 2025-2030 (%)

12.4.5 Indonesia - Market size and forecast 2025-2030

Chart on Indonesia - Market size and forecast 2025-2030 ($ million)
Data Table on Indonesia - Market size and forecast 2025-2030 ($ million)
Chart on Indonesia - Year-over-year growth 2025-2030 (%)
Data Table on Indonesia - Year-over-year growth 2025-2030 (%)

12.4.6 Thailand - Market size and forecast 2025-2030

Chart on Thailand - Market size and forecast 2025-2030 ($ million)
Data Table on Thailand - Market size and forecast 2025-2030 ($ million)
Chart on Thailand - Year-over-year growth 2025-2030 (%)
Data Table on Thailand - Year-over-year growth 2025-2030 (%)

12.5 Europe - Market size and forecast 2025-2030

Chart on Europe - Market size and forecast 2025-2030 ($ million)
Data Table on Europe - Market size and forecast 2025-2030 ($ million)
Chart on Europe - Year-over-year growth 2025-2030 (%)
Data Table on Europe - Year-over-year growth 2025-2030 (%)
Chart on Regional Comparison - Europe
Data Table on Regional Comparison - Europe

12.5.1 Germany - Market size and forecast 2025-2030

Chart on Germany - Market size and forecast 2025-2030 ($ million)
Data Table on Germany - Market size and forecast 2025-2030 ($ million)
Chart on Germany - Year-over-year growth 2025-2030 (%)
Data Table on Germany - Year-over-year growth 2025-2030 (%)

12.5.2 UK - Market size and forecast 2025-2030

Chart on UK - Market size and forecast 2025-2030 ($ million)
Data Table on UK - Market size and forecast 2025-2030 ($ million)
Chart on UK - Year-over-year growth 2025-2030 (%)
Data Table on UK - Year-over-year growth 2025-2030 (%)

12.5.3 France - Market size and forecast 2025-2030

Chart on France - Market size and forecast 2025-2030 ($ million)
Data Table on France - Market size and forecast 2025-2030 ($ million)
Chart on France - Year-over-year growth 2025-2030 (%)
Data Table on France - Year-over-year growth 2025-2030 (%)

12.5.4 Italy - Market size and forecast 2025-2030

Chart on Italy - Market size and forecast 2025-2030 ($ million)
Data Table on Italy - Market size and forecast 2025-2030 ($ million)
Chart on Italy - Year-over-year growth 2025-2030 (%)
Data Table on Italy - Year-over-year growth 2025-2030 (%)

12.5.5 Spain - Market size and forecast 2025-2030

Chart on Spain - Market size and forecast 2025-2030 ($ million)
Data Table on Spain - Market size and forecast 2025-2030 ($ million)
Chart on Spain - Year-over-year growth 2025-2030 (%)
Data Table on Spain - Year-over-year growth 2025-2030 (%)

12.5.6 The Netherlands - Market size and forecast 2025-2030

Chart on The Netherlands - Market size and forecast 2025-2030 ($ million)
Data Table on The Netherlands - Market size and forecast 2025-2030 ($ million)
Chart on The Netherlands - Year-over-year growth 2025-2030 (%)
Data Table on The Netherlands - Year-over-year growth 2025-2030 (%)

12.6 Rest of World (ROW) - Market size and forecast 2025-2030

Chart on Rest of World (ROW) - Market size and forecast 2025-2030 ($ million)
Data Table on Rest of World (ROW) - Market size and forecast 2025-2030 ($ million)
Chart on Rest of World (ROW) - Year-over-year growth 2025-2030 (%)
Data Table on Rest of World (ROW) - Year-over-year growth 2025-2030 (%)
Chart on Regional Comparison - Rest of World (ROW)
Data Table on Regional Comparison - Rest of World (ROW)

12.6.1 Brazil - Market size and forecast 2025-2030

Chart on Brazil - Market size and forecast 2025-2030 ($ million)
Data Table on Brazil - Market size and forecast 2025-2030 ($ million)
Chart on Brazil - Year-over-year growth 2025-2030 (%)
Data Table on Brazil - Year-over-year growth 2025-2030 (%)

12.6.2 Saudi Arabia - Market size and forecast 2025-2030

Chart on Saudi Arabia - Market size and forecast 2025-2030 ($ million)
Data Table on Saudi Arabia - Market size and forecast 2025-2030 ($ million)
Chart on Saudi Arabia - Year-over-year growth 2025-2030 (%)
Data Table on Saudi Arabia - Year-over-year growth 2025-2030 (%)

12.6.3 UAE - Market size and forecast 2025-2030

Chart on UAE - Market size and forecast 2025-2030 ($ million)
Data Table on UAE - Market size and forecast 2025-2030 ($ million)
Chart on UAE - Year-over-year growth 2025-2030 (%)
Data Table on UAE - Year-over-year growth 2025-2030 (%)

12.6.4 Turkey - Market size and forecast 2025-2030

Chart on Turkey - Market size and forecast 2025-2030 ($ million)
Data Table on Turkey - Market size and forecast 2025-2030 ($ million)
Chart on Turkey - Year-over-year growth 2025-2030 (%)
Data Table on Turkey - Year-over-year growth 2025-2030 (%)

12.6.5 Argentina - Market size and forecast 2025-2030

Chart on Argentina - Market size and forecast 2025-2030 ($ million)
Data Table on Argentina - Market size and forecast 2025-2030 ($ million)
Chart on Argentina - Year-over-year growth 2025-2030 (%)
Data Table on Argentina - Year-over-year growth 2025-2030 (%)

12.6.6 Colombia - Market size and forecast 2025-2030

Chart on Colombia - Market size and forecast 2025-2030 ($ million)
Data Table on Colombia - Market size and forecast 2025-2030 ($ million)
Chart on Colombia - Year-over-year growth 2025-2030 (%)
Data Table on Colombia - Year-over-year growth 2025-2030 (%)

12.6.7 South Africa - Market size and forecast 2025-2030

Chart on South Africa - Market size and forecast 2025-2030 ($ million)
Data Table on South Africa - Market size and forecast 2025-2030 ($ million)
Chart on South Africa - Year-over-year growth 2025-2030 (%)
Data Table on South Africa - Year-over-year growth 2025-2030 (%)

12.6.8 Israel - Market size and forecast 2025-2030

Chart on Israel - Market size and forecast 2025-2030 ($ million)
Data Table on Israel - Market size and forecast 2025-2030 ($ million)
Chart on Israel - Year-over-year growth 2025-2030 (%)
Data Table on Israel - Year-over-year growth 2025-2030 (%)

12.7 Market opportunity by geography

Market opportunity by geography ($ million)
Data Tables on Market opportunity by geography ($ million)

13. Drivers, Challenges, and Opportunity

13.1 Market drivers

Rising consumer demand for personalized health and longevity
Technological convergence of biotechnology and AI
Increasing prevalence of chronic stress and cognitive demands

13.2 Market challenges

Complex and evolving regulatory frameworks
High cost of advanced technologies and data security risks
Ethical concerns and social acceptance of human augmentation

13.3 Impact of drivers and challenges

Impact of drivers and challenges in 2025 and 2030

13.4 Market opportunities

Integration of generative AI in personalized biological modeling
Proliferation of implantable biotelemetry and subdermal enhancement
Convergence of nutrigenomics and epigenetic reprogramming

14. Competitive Landscape

14.1 Overview

14.2

Overview on criticality of inputs and factors of differentiation

14.3 Landscape disruption

Overview on factors of disruption

14.4 Industry risks

Impact of key risks on business

15. Competitive Analysis

15.1 Companies profiled

Companies covered

15.2 Company ranking index

15.3 Market positioning of companies

Matrix on companies position and classification

15.4 Biohacked Inc.

Biohacked Inc. - Overview
Biohacked Inc. - Product / Service
Biohacked Inc. - Key offerings
SWOT

15.5 Bulletproof 360 Inc.

Bulletproof 360 Inc. - Overview
Bulletproof 360 Inc. - Product / Service
Bulletproof 360 Inc. - Key offerings
SWOT

15.6 Elysium Health Inc.

Elysium Health Inc. - Overview
Elysium Health Inc. - Product / Service
Elysium Health Inc. - Key offerings
SWOT

15.7 Health Via Modern Nutrition Inc.

Health Via Modern Nutrition Inc. - Overview
Health Via Modern Nutrition Inc. - Product / Service
Health Via Modern Nutrition Inc. - Key offerings
SWOT

15.8 InteraXon Inc.

InteraXon Inc. - Overview
InteraXon Inc. - Product / Service
InteraXon Inc. - Key offerings
SWOT

15.9 Klean Athlete

Klean Athlete - Overview
Klean Athlete - Product / Service
Klean Athlete - Key offerings
SWOT

15.10 Lief Therapeutics Inc.

Lief Therapeutics Inc. - Overview
Lief Therapeutics Inc. - Product / Service
Lief Therapeutics Inc. - Key offerings
SWOT

15.11 MetaFlow Ltd.

MetaFlow Ltd. - Overview
MetaFlow Ltd. - Product / Service
MetaFlow Ltd. - Key offerings
SWOT

15.12 Nutrigenomix Inc.

Nutrigenomix Inc. - Overview
Nutrigenomix Inc. - Product / Service
Nutrigenomix Inc. - Key offerings
SWOT

15.13 Onnit Labs Inc.

Onnit Labs Inc. - Overview
Onnit Labs Inc. - Product / Service
Onnit Labs Inc. - Key offerings
SWOT

15.14 Oura Health Oy

Oura Health Oy - Overview
Oura Health Oy - Product / Service
Oura Health Oy - Key offerings
SWOT

15.15 Segterra Inc.

Segterra Inc. - Overview
Segterra Inc. - Product / Service
Segterra Inc. - Key offerings
SWOT

15.16 Thorne HealthTech Inc.

Thorne HealthTech Inc. - Overview
Thorne HealthTech Inc. - Product / Service
Thorne HealthTech Inc. - Key offerings
SWOT

15.17 Viome Life Sciences Inc.

Viome Life Sciences Inc. - Overview
Viome Life Sciences Inc. - Product / Service
Viome Life Sciences Inc. - Key offerings
SWOT

15.18 WHOOP Inc.

WHOOP Inc. - Overview
WHOOP Inc. - Product / Service
WHOOP Inc. - Key offerings
SWOT

16. Appendix

16.1 Scope of the report

Market definition
Objectives
Notes and caveats

16.2 Inclusions and exclusions checklist

Inclusions checklist
Exclusions checklist

16.3 Currency conversion rates for US$

16.4 Research methodology

16.5 Data procurement

Information sources

16.6 Data validation

16.7 Validation techniques employed for market sizing

16.8 Data synthesis

16.9 360 degree market analysis

16.10 List of abbreviations

Research Methodology

Technavio presents a detailed picture of the market by way of study, synthesis, and summation of data from multiple sources. The analysts have presented the various facets of the market with a particular focus on identifying the key industry influencers. The data thus presented is comprehensive, reliable, and the result of extensive research, both primary and secondary.

INFORMATION SOURCES

Primary sources

  • Manufacturers and suppliers
  • Channel partners
  • Industry experts
  • Strategic decision makers

Secondary sources

  • Industry journals and periodicals
  • Government data
  • Financial reports of key industry players
  • Historical data
  • Press releases

DATA ANALYSIS

Data Synthesis

  • Collation of data
  • Estimation of key figures
  • Analysis of derived insights

Data Validation

  • Triangulation with data models
  • Reference against proprietary databases
  • Corroboration with industry experts

REPORT WRITING

Qualitative

  • Market drivers
  • Market challenges
  • Market trends
  • Five forces analysis

Quantitative

  • Market size and forecast
  • Market segmentation
  • Geographical insights
  • Competitive landscape

Interested in this report?

Get your sample now to see our research methodology and insights!

Download Now

Frequently Asked Questions

Biohacking market growth will increase by USD 96099.8 million during 2026-2030.

The Biohacking market is expected to grow at a CAGR of 20.5% during 2026-2030.

Biohacking market is segmented by Product (Wearables, Smart drugs) Application (Forensic science, Synthetic biology, Genetic engineering, Others) End-user (Pharma and biotech companies, Forensic laboratories, Others)

Biohacked Inc., Biostrap USA LLC, Bulletproof 360 Inc., Eight Sleep Inc., Elysium Health Inc., Halo Neuro Inc., Health Via Modern Nutrition Inc., InteraXon Inc., Klean Athlete, Levels Health Inc., Lief Therapeutics Inc., MetaFlow Ltd., Neurohacker Collective LLC, Nutrigenomix Inc., Onnit Labs Inc., Oura Health Oy, Segterra Inc., Thorne HealthTech Inc., Viome Life Sciences Inc., WHOOP Inc. are a few of the key vendors in the Biohacking market.

North America will register the highest growth rate of 39.7% among the other regions. Therefore, the Biohacking market in North America is expected to garner significant business opportunities for the vendors during the forecast period.

US, Canada, Mexico, China, India, Japan, South Korea, Indonesia, Thailand, Germany, UK, France, Italy, Spain, The Netherlands, Brazil, Saudi Arabia, UAE, Turkey, Argentina, Colombia, South Africa, Israel

  • Rising consumer demand for personalized health and longevity is the driving factor this market.

The Biohacking market vendors should focus on grabbing business opportunities from the Product segment as it accounted for the largest market share in the base year.
RIA - Research AI Assistant
Ask RIA