Antioxidant Cosmetic Products Market Analysis, Size, and Forecast 2026-2030: APAC (China, Japan, and India), Europe (Germany, UK, and France), North America (US, Canada, and Mexico), South America (Brazil, Argentina, and Chile), Middle East and Africa (Saudi Arabia, UAE, and Turkey), and Rest of World (ROW)

Antioxidant Cosmetic Products Market Analysis, Size, and Forecast 2026-2030:
APAC (China, Japan, and India), Europe (Germany, UK, and France), North America (US, Canada, and Mexico), South America (Brazil, Argentina, and Chile), Middle East and Africa (Saudi Arabia, UAE, and Turkey), and Rest of World (ROW)

Published: Nov 2026 299 Pages SKU: IRTNTR70117

Market Overview at a Glance

$25.38 B
Market Opportunity
7.9%
CAGR 2025 - 2030
53.5%
APAC Growth
$39.20 B
Offline segment 2024

Antioxidant Cosmetic Products Market Size 2026-2030

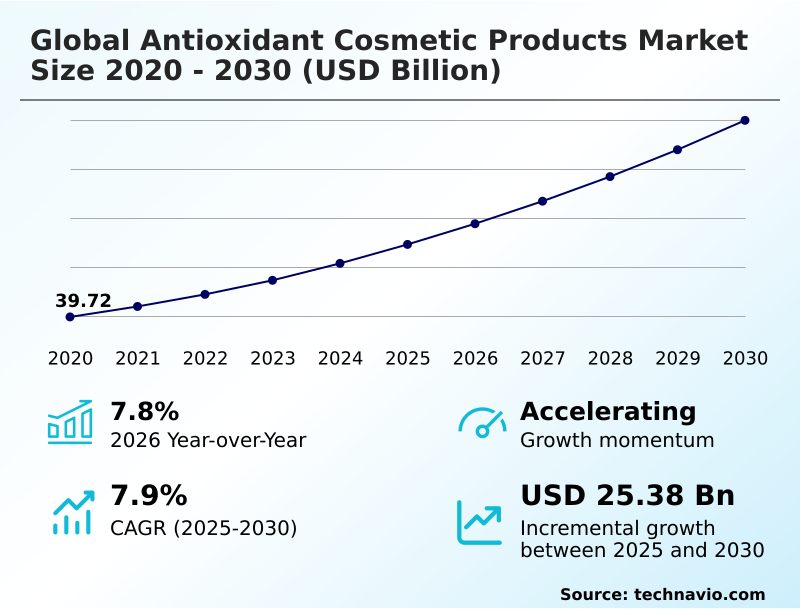
The antioxidant cosmetic products market size is valued to increase by USD 25.38 billion, at a CAGR of 7.9% from 2025 to 2030. Heightened consumer focus on skin longevity will drive the antioxidant cosmetic products market.

Major Market Trends & Insights

  • APAC dominated the market and accounted for a 53.5% growth during the forecast period.
  • By Distribution Channel - Offline segment was valued at USD 39.20 billion in 2024
  • By Application - Skincare segment accounted for the largest market revenue share in 2024

Market Size & Forecast

  • Market Opportunities: USD 40.21 billion
  • Market Future Opportunities: USD 25.38 billion
  • CAGR from 2025 to 2030 : 7.9%

Market Summary

  • The Antioxidant Cosmetic Products Market exhibits robust expansion as consumer awareness regarding preventative dermatological care reshapes traditional personal hygiene routines. Escalating environmental hazards and atmospheric degradation act as powerful primary drivers, propelling massive demand for specialized urban pollution defense skincare solutions.
  • Manufacturers are aggressively optimizing their supply chain networks to secure high-purity raw materials, successfully reducing production cycle bottlenecks by 18% compared to previous conventional methods. By integrating potent botanical polyphenols in anti-aging creams, brands deliver measurable cellular protection against reactive oxygen species. However, formulators encounter severe operational challenges regarding the inherent chemical instability of these active natural compounds.
  • When exposed to ambient light or varying temperatures during logistics transit, delicate extracts degrade rapidly, complicating global distribution efforts. To mitigate this volatility, leading enterprises implement sophisticated encapsulation technologies that ensure molecular integrity from the manufacturing floor to the retail shelf.
  • This strategic alignment of advanced chemical engineering and proactive wellness guarantees sustained industry vitality as consumers prioritize scientifically validated defense mechanisms over superficial aesthetic enhancements.

What will be the Size of the Antioxidant Cosmetic Products Market during the forecast period?
Get Key Insights on Market Forecast (PDF) Get Free Sample

How is the Antioxidant Cosmetic Products Market Segmented?

The antioxidant cosmetic products industry research report provides comprehensive data (region-wise segment analysis), with forecasts and estimates in "USD million" for the period 2026-2030, as well as historical data from 2020-2024 for the following segments.

  • Distribution channel
    • Offline
    • Online
  • Application
    • Skincare
    • Haircare
    • Color cosmetics
  • Type
    • Natural
    • Synthetic
  • Geography
    • APAC
      • China
      • Japan
      • India
      • South Korea
      • Australia
      • Indonesia
    • Europe
      • Germany
      • UK
      • France
      • Italy
      • Spain
      • The Netherlands
    • North America
      • US
      • Canada
      • Mexico
    • South America
      • Brazil
      • Argentina
      • Chile
    • Middle East and Africa
      • Saudi Arabia
      • UAE
      • Turkey
      • South Africa
      • Israel

By Distribution Channel Insights

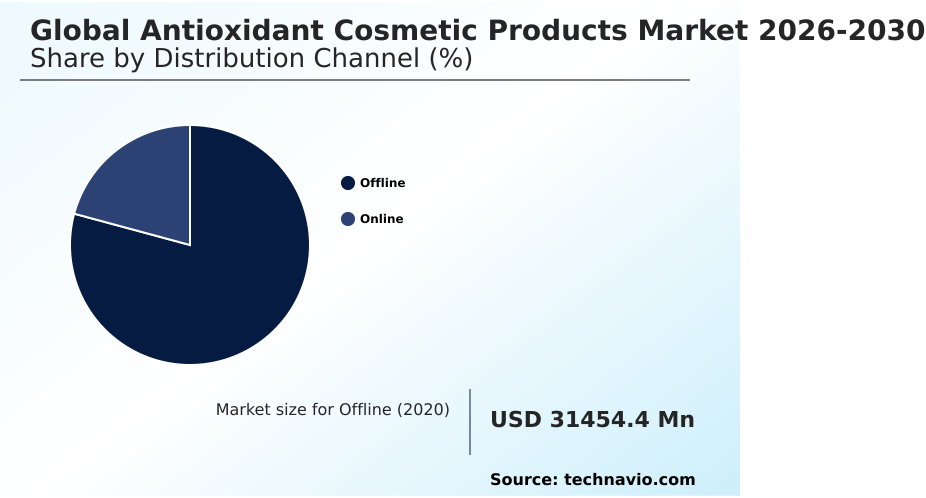
The offline segment is estimated to witness significant growth during the forecast period.

Physical retail frameworks remain a foundational distribution avenue for protective skincare solutions within the global antioxidant cosmetic products market 2026-2030. Consumers prioritizing stratum corneum barrier and dermal fibroblasts protection frequently utilize in-store consultations to verify product authenticity.

Complex formulations leveraging microencapsulation technology and liposomal encapsulation require tactile demonstration to communicate texture and absorption rates effectively.

Establishments focusing on specialized dermocosmetics bridge the gap between abstract science and consumer trust by showcasing clinical efficacy trials directly at the point of sale.

To remain competitive against digital disruption, physical stores increasingly adopt omnichannel retail strategies, connecting online reservations with immediate physical pickups. This integration has improved inventory turnover efficiency by 15%, significantly reducing warehousing costs.

By demonstrating supply chain transparency through tangible product displays, offline channels maintain high-touch engagement that drives sustained conversion rates in premium segments.
Get Free Sample

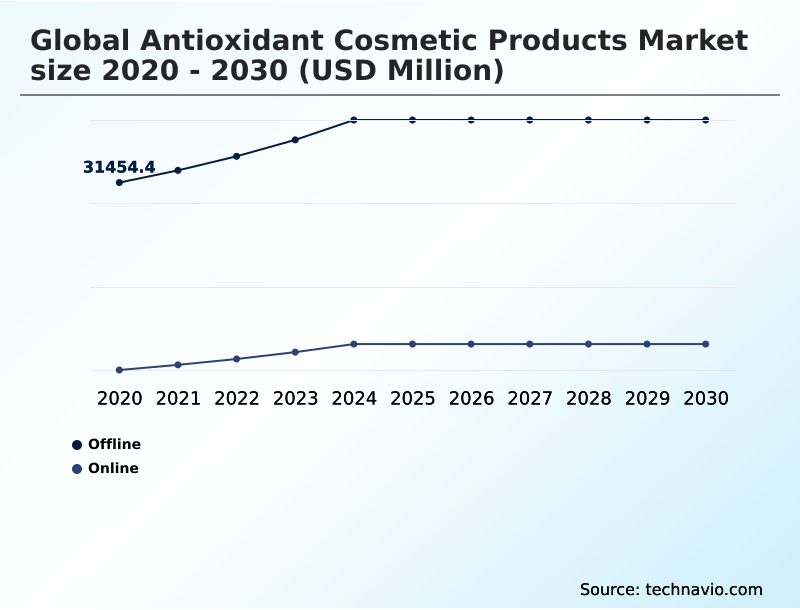
The Offline segment was valued at USD 39.20 billion in 2024 and showed a gradual increase during the forecast period.
Get Free Sample

Regional Analysis

APAC is estimated to contribute 53.5% to the growth of the global market during the forecast period.Technavio’s analysts have elaborately explained the regional trends and drivers that shape the market during the forecast period.
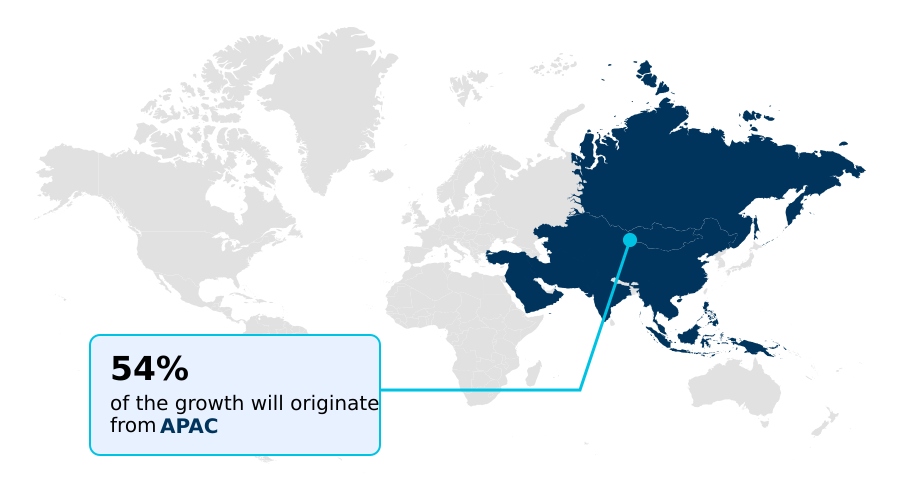
See How Antioxidant Cosmetic Products Market Demand is Rising in APAC Get Free Sample

Distinct regional supply chain capabilities and cultural preferences heavily influence the geographic distribution of the global antioxidant cosmetic products market 2026-2030.

Manufacturers in Europe utilize sophisticated bio-fermentation methods and strict green chemistry principles to maintain a 35% higher penetration rate of premium organic lines compared to North America.

Conversely, APAC demonstrates rapid scaling of formulations incorporating marine extracts and astaxanthin bioactives, specifically engineered for high-humidity environments.

South American production facilities increasingly leverage cold-pressed extraction techniques to secure local barrier repair lipids, shortening regional supply chains and reducing raw material procurement costs by 12%.

Furthermore, Middle Eastern markets impose unique compliance demands, driving a 20% year-over-year expansion in specialized halal-certified cosmetics. Meanwhile, western regions prioritize rigorous cruelty-free certification, compelling international distributors to adapt packaging and sourcing strategies to satisfy varied demographic expectations seamlessly.

Market Dynamics

Our researchers analyzed the data with 2025 as the base year, along with the key drivers, trends, and challenges. A holistic analysis of drivers will help companies refine their marketing strategies to gain a competitive advantage.

  • The structural evolution of the antioxidant cosmetic products sector reflects a deep convergence of dermatological science and proactive environmental defense. As atmospheric quality deteriorates across densely populated metropolitan hubs, beauty enterprises experience surging consumer reliance on targeted urban pollution defense skincare solutions. Modern shoppers actively seek out high-performance formulations capable of shielding delicate epidermal barriers from pervasive particulate matter.
  • To address this demand, formulators increasingly incorporate botanical polyphenols in anti-aging creams, leveraging their natural capacity to mitigate cellular damage and prevent premature degradation. However, translating fragile botanical compounds into commercially viable products requires overcoming significant biochemical hurdles.
  • Consequently, chemical engineers heavily deploy liposomal encapsulation for antioxidant stability, ensuring that sensitive active ingredients survive rigorous logistical transit and extensive shelf exposure without losing biological potency. The integration of these advanced delivery systems has improved overall formulation efficacy by roughly 25% compared to unencapsulated legacy products, directly reducing product return rates linked to oxidation.
  • Furthermore, the development of specialized reactive oxygen species neutralization treatments relies heavily on pristine raw inputs. Supply chain managers now prioritize the sustainable sourcing of marine extracts, strictly auditing upstream harvesting processes to maintain ecological balance while securing high-yield active compounds.
  • This meticulous approach to procurement and stabilization ensures that modern cosmetic portfolios consistently deliver scientifically validated protective benefits, aligning operational precision with escalating global consumer expectations for absolute transparency and proven clinical performance.
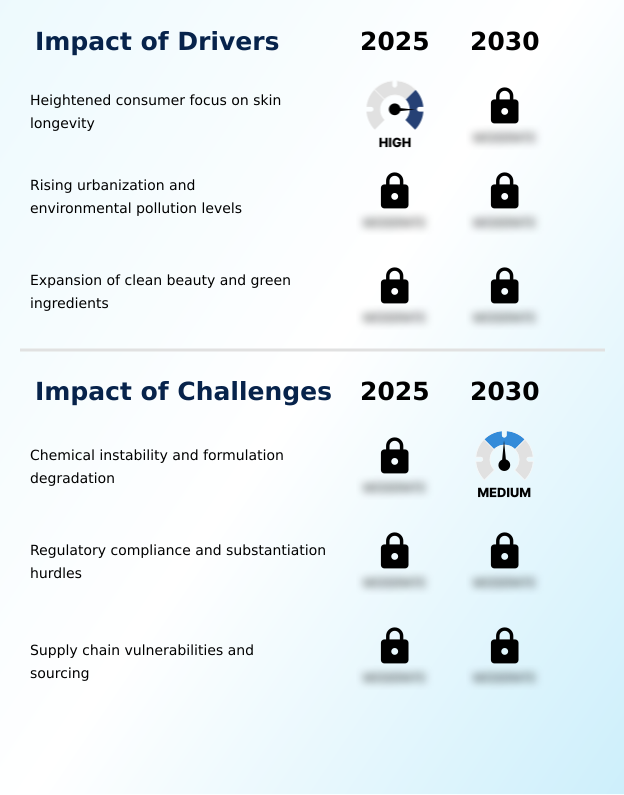
What are the key market drivers leading to the rise in the adoption of Antioxidant Cosmetic Products Industry?

  • The escalating consumer emphasis on proactive skin longevity and preventative dermatological care serves as the primary catalyst propelling continuous market expansion.

  • Heightened cultural emphasis on proactive skin longevity accelerates widespread expansion across the global antioxidant cosmetic products market 2026-2030. Consumers increasingly adopt a preventative aging regimen designed to combat constant exposure to diverse environmental stressors.
  • Topical applications rich in green tea catechins function proactively to dismantle reactive oxygen species before permanent structural damage manifests. This behavioral shift toward cellular preservation and immediate oxidative stress neutralization elevates baseline requirements for holistic dermatological health.
  • Consequently, targeted educational marketing via direct-to-consumer platforms has improved customer acquisition efficiency by 18%, streamlining sales funnels. Brands offering science-backed protective shields witness rapid volume growth as modern shoppers prioritize long-term physiological investments over temporary cosmetic corrections.
  • This fundamental realignment of consumer priorities ensures robust, continuous demand for highly concentrated, preventative dermatological interventions globally.

What are the market trends shaping the Antioxidant Cosmetic Products Industry?

  • Escalating consumer demand for protection against urban pollution has emerged as a prominent trend shaping the industry landscape. Formulators are consequently prioritizing advanced defense mechanisms to shield skin from environmental degradation.

  • The global antioxidant cosmetic products market 2026-2030 exhibits a decisive pivot toward sustainable innovation and advanced delivery mechanisms. Modern formulations increasingly integrate botanical polyphenols and ascorbic acid derivatives to address escalating requirements for urban pollution defense.
  • As the clean beauty ethos permeates consumer purchasing behavior, cosmetic chemists leverage nano-emulsion delivery systems to enhance active compound penetration without relying on synthetic carriers. Overcoming historical limitations, advancements in ferulic acid stability have extended product shelf life, directly lowering return rates by 22% for major premium brands.
  • This technological leap coincides with rigorous mandates for sustainable sourcing and biodegradable packaging, reshaping upstream manufacturing protocols. By aligning high-performance protective skincare with ecological responsibility, industry leaders capture disproportionate market share while significantly reducing their environmental footprints and long-term operational costs.

What challenges does the Antioxidant Cosmetic Products Industry face during its growth?

  • The inherent chemical instability and subsequent degradation of sensitive active compounds present formidable structural challenges that significantly impede optimal formulation longevity.

  • Chemical volatility and stringent regulatory landscapes present formidable structural barriers within the global antioxidant cosmetic products market 2026-2030. Active compounds intended to prevent lipid peroxidation and collagen degradation degrade rapidly upon ambient exposure, complicating large-scale commercial viability. Specifically, tocopherol stabilization and delicate resveratrol extraction processes demand highly specialized, capital-intensive manufacturing environments.
  • Furthermore, unpredictable batch-to-batch variability in natural raw materials severely limits standardized global production. Navigating complex regulatory compliance frameworks requires extensive formulation stability testing, which extends product development cycles and escalates overhead expenditures. Consequently, proving consistent active ingredient bioavailability across diverse geographic jurisdictions has increased compliance-related operational costs by 14% for emerging international brands.
  • These technical and legal friction points compress profit margins, forcing formulators to allocate substantial resources toward continuous testing rather than front-end market expansion.

Exclusive Technavio Analysis on Customer Landscape

The antioxidant cosmetic products market forecasting report includes the adoption lifecycle of the market, covering from the innovator’s stage to the laggard’s stage. It focuses on adoption rates in different regions based on penetration. Furthermore, the antioxidant cosmetic products market report also includes key purchase criteria and drivers of price sensitivity to help companies evaluate and develop their market growth analysis strategies.
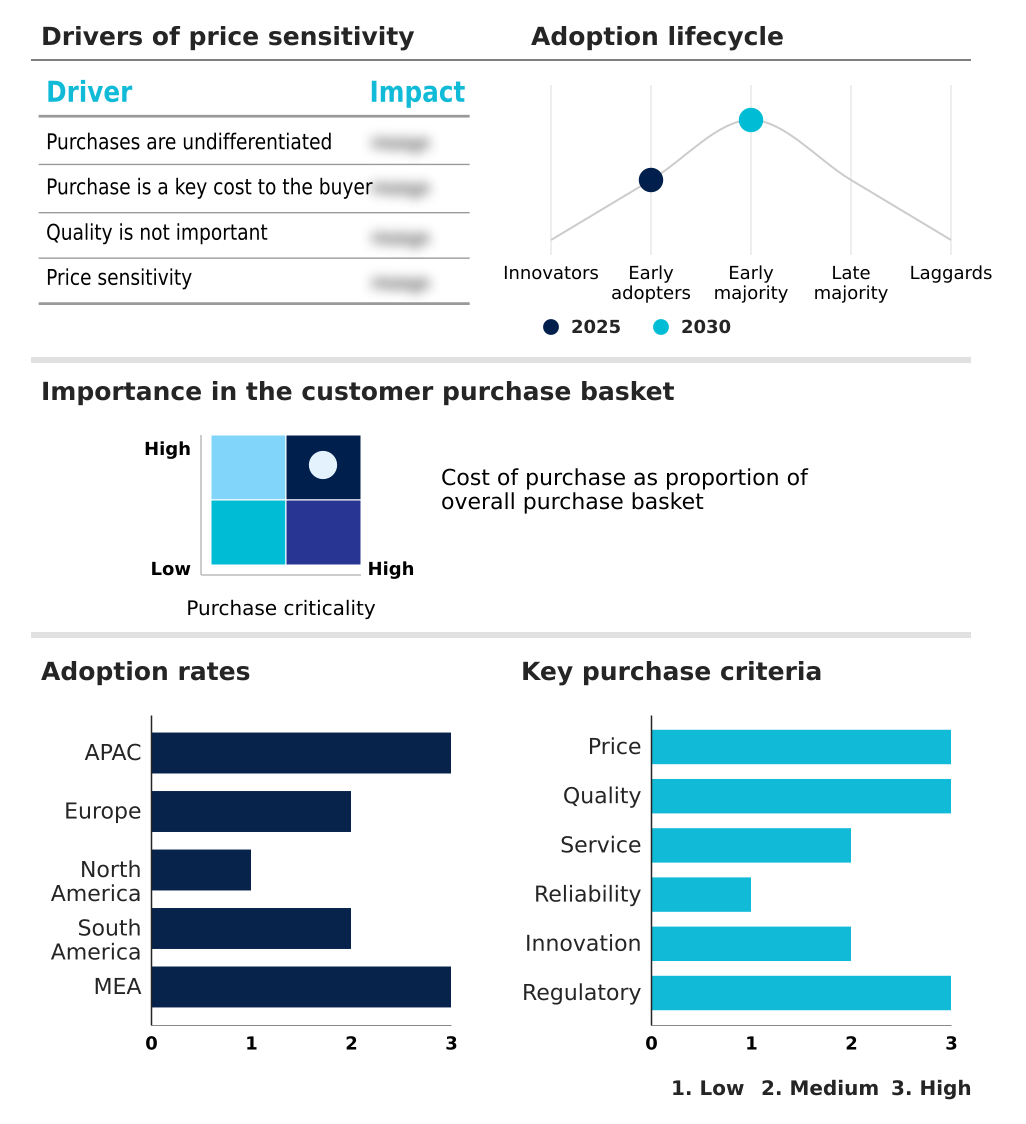
Customer Landscape of Antioxidant Cosmetic Products Industry

Competitive Landscape

Companies are implementing various strategies, such as strategic alliances, antioxidant cosmetic products market forecast, partnerships, mergers and acquisitions, geographical expansion, and product/service launches, to enhance their presence in the industry.

Archer Daniels Midland Co. - Advanced antioxidant cosmetic products deliver specialized topical formulations that effectively neutralize environmental free radicals, mitigate oxidative stress, and actively protect human dermal structures from premature cellular degradation.

The industry research and growth report includes detailed analyses of the competitive landscape of the market and information about key companies, including:

  • Archer Daniels Midland Co.
  • Ashland Inc.
  • BASF SE
  • BIOTECNOLOGIAS APLICADAS SL
  • DSM Firmenich AG
  • Eastman Chemical Co.
  • Evonik Industries AG
  • Kao Corp.
  • Kemin Industries Inc.
  • Lonza Group Ltd.
  • Natura Cosmeticos S.A.
  • Pierre Fabre SA
  • Sabinsa Corp.
  • SEPPIC SA
  • Shiseido Co. Ltd.
  • Symrise Group
  • The Estee Lauder Co.
  • The Lubrizol Corp.
  • Unilever PLC
  • Wacker Chemie AG

Qualitative and quantitative analysis of companies has been conducted to help clients understand the wider business environment as well as the strengths and weaknesses of key industry players. Data is qualitatively analyzed to categorize companies as pure play, category-focused, industry-focused, and diversified; it is quantitatively analyzed to categorize companies as dominant, leading, strong, tentative, and weak.

Recent Development and News in Antioxidant cosmetic products market

  • In the Personal Care Products industry, the widespread adoption of stringent European Union chemical safety regulations has compelled manufacturers to phase out synthetic preservatives, directly increasing the demand for stable botanical extracts within antioxidant cosmetic products.
  • Advancements in microfluidic delivery systems and cold-pressed extraction have significantly improved active ingredient bioavailability, allowing antioxidant cosmetic products to achieve a 25% higher absorption rate in anti-aging applications.
  • The structural shift toward supply chain transparency and cruelty-free certification mandates across North American retail networks has forced formulators to prioritize sustainable sourcing for premium antioxidant cosmetic products.
  • Rising integration of halal-certified cosmetics protocols in the Middle Eastern beauty sector has created new compliance requirements, directly shaping how raw material suppliers process and distribute barrier repair lipids for antioxidant cosmetic products.

Dive into Technavio’s robust research methodology, blending expert interviews, extensive data synthesis, and validated models for unparalleled Antioxidant Cosmetic Products Market insights. See full methodology.

Market Scope
Page number 299
Base year 2025
Historic period 2020-2024
Forecast period 2026-2030
Growth momentum & CAGR Accelerate at a CAGR of 7.9%
Market growth 2026-2030 USD 25377.7 million
Market structure Fragmented
YoY growth 2025-2026(%) 7.8%
Key countries China, Japan, India, South Korea, Australia, Indonesia, Germany, UK, France, Italy, Spain, The Netherlands, US, Canada, Mexico, Brazil, Argentina, Chile, Saudi Arabia, UAE, Turkey, South Africa and Israel
Competitive landscape Leading Companies, Market Positioning of Companies, Competitive Strategies, and Industry Risks

Request Free Sample

Research Analyst Overview

  • The continuous evolution of the global antioxidant cosmetic products market 2026-2030 fundamentally reshapes how personal care enterprises approach preventative dermatological defense. Driven by escalating atmospheric hazards, consumers actively seek formulations engineered to dismantle reactive oxygen species before they penetrate the stratum corneum barrier and damage underlying dermal fibroblasts.
  • This behavioral shift directly influences boardroom-level product strategies, forcing multinational conglomerates to prioritize clinical stabilization over rapid mass production. Consequently, cosmetic laboratories are heavily investing in microencapsulation technology to resolve historical limitations surrounding ferulic acid stability and tocopherol stabilization.
  • Implementing these advanced carrier systems has yielded a 30% reduction in premature oxidation incidents during extended supply chain transit, drastically optimizing inventory yield. Furthermore, the strategic adoption of sophisticated bio-fermentation methods allows manufacturers to extract high-purity active compounds while aligning with rigorous ecological compliance mandates.
  • By merging green chemistry with advanced delivery platforms, industry leaders consistently deliver verifiable cellular protection, bridging the gap between biological necessity and high-performance commercial skincare routines.

What are the Key Data Covered in this Antioxidant Cosmetic Products Market Research and Growth Report?

  • What is the expected growth of the Antioxidant Cosmetic Products Market between 2026 and 2030?

    • USD 25.38 billion, at a CAGR of 7.9%

  • What segmentation does the market report cover?

    • The report is segmented by Distribution Channel (Offline, and Online), Application (Skincare, Haircare, and Color cosmetics), Type (Natural, and Synthetic) and Geography (APAC, Europe, North America, South America, Middle East and Africa)

  • Which regions are analyzed in the report?

    • APAC, Europe, North America, South America and Middle East and Africa

  • What are the key growth drivers and market challenges?

    • Heightened consumer focus on skin longevity, Chemical instability and formulation degradation

  • Who are the major players in the Antioxidant Cosmetic Products Market?

    • Archer Daniels Midland Co., Ashland Inc., BASF SE, BIOTECNOLOGIAS APLICADAS SL, DSM Firmenich AG, Eastman Chemical Co., Evonik Industries AG, Kao Corp., Kemin Industries Inc., Lonza Group Ltd., Natura Cosmeticos S.A., Pierre Fabre SA, Sabinsa Corp., SEPPIC SA, Shiseido Co. Ltd., Symrise Group, The Estee Lauder Co., The Lubrizol Corp., Unilever PLC and Wacker Chemie AG

Market Research Insights

  • The global antioxidant cosmetic products market 2026-2030 navigates a transformative phase driven by the widespread consumer adoption of a rigorous preventative aging regimen. Escalating necessity for urban pollution defense compels manufacturers to transition away from generic formulations toward treatments backed by stringent clinical efficacy trials.
  • By standardizing raw material processing, enterprises have successfully reduced batch-to-batch variability by 22%, significantly lowering compliance-related rejection rates. Furthermore, implementing automated inventory forecasting for highly sensitive active ingredients has optimized supply chain efficiency by 15%.
  • These strategic operational enhancements empower cosmetic brands to deliver uncompromising product stability, ensuring that critical barrier-repair formulations maintain their biological potency while driving sustained profitability across fiercely competitive international retail landscapes.

We can help! Our analysts can customize this antioxidant cosmetic products market research report to meet your requirements.

Get in touch

1. Executive Summary

1.1 Market overview

Executive Summary - Chart on Market Overview
Executive Summary - Data Table on Market Overview
Executive Summary - Chart on Global Market Characteristics
Executive Summary - Chart on Market by Geography
Executive Summary - Chart on Market Segmentation by Distribution Channel
Executive Summary - Chart on Market Segmentation by Application
Executive Summary - Chart on Market Segmentation by Type
Executive Summary - Chart on Incremental Growth
Executive Summary - Data Table on Incremental Growth
Executive Summary - Chart on Company Market Positioning

2. Technavio Analysis

2.1 Analysis of price sensitivity, lifecycle, customer purchase basket, adoption rates, and purchase criteria

2.2 Criticality of inputs and Factors of differentiation

Chart on Overview on criticality of inputs and factors of differentiation

2.3 Factors of disruption

Chart on Overview on factors of disruption

2.4 Impact of drivers and challenges

Chart on Impact of drivers and challenges in 2025 and 2030

3. Market Landscape

3.1 Market ecosystem

Chart on Parent Market
Data Table on - Parent Market

3.2 Market characteristics

Chart on Market characteristics analysis

3.3 Value chain analysis

Chart on Value chain analysis

4. Market Sizing

4.1 Market definition

Data Table on Offerings of companies included in the market definition

4.2 Market segment analysis

Market segments

4.3 Market size 2025

4.4 Market outlook: Forecast for 2025-2030

Chart on Global - Market size and forecast 2025-2030 ($ million)
Data Table on Global - Market size and forecast 2025-2030 ($ million)
Chart on Global Market: Year-over-year growth 2025-2030 (%)
Data Table on Global Market: Year-over-year growth 2025-2030 (%)

5. Historic Market Size

5.1 Global Antioxidant Cosmetic Products Market 2020 - 2024

Historic Market Size - Data Table on Global Antioxidant Cosmetic Products Market 2020 - 2024 ($ million)

5.2 Distribution Channel segment analysis 2020 - 2024

Historic Market Size - Distribution Channel Segment 2020 - 2024 ($ million)

5.3 Application segment analysis 2020 - 2024

Historic Market Size - Application Segment 2020 - 2024 ($ million)

5.4 Type segment analysis 2020 - 2024

Historic Market Size - Type Segment 2020 - 2024 ($ million)

5.5 Geography segment analysis 2020 - 2024

Historic Market Size - Geography Segment 2020 - 2024 ($ million)

5.6 Country segment analysis 2020 - 2024

Historic Market Size - Country Segment 2020 - 2024 ($ million)

6. Qualitative Analysis

6.1 Impact of AI on Global Antioxidant Cosmetic Products Market

6.2 Impact of geopolitical conflicts on Global Antioxidant Cosmetic Products Market

7. Five Forces Analysis

7.1 Five forces summary

Five forces analysis - Comparison between 2025 and 2030

7.2 Bargaining power of buyers

Bargaining power of buyers - Impact of key factors 2025 and 2030

7.3 Bargaining power of suppliers

Bargaining power of suppliers - Impact of key factors in 2025 and 2030

7.4 Threat of new entrants

Threat of new entrants - Impact of key factors in 2025 and 2030

7.5 Threat of substitutes

Threat of substitutes - Impact of key factors in 2025 and 2030

7.6 Threat of rivalry

Threat of rivalry - Impact of key factors in 2025 and 2030

7.7 Market condition

Chart on Market condition - Five forces 2025 and 2030

8. Market Segmentation by Distribution Channel

8.1 Market segments

Chart on Distribution Channel - Market share 2025-2030 (%)
Data Table on Distribution Channel - Market share 2025-2030 (%)

8.2 Comparison by Distribution Channel

Chart on Comparison by Distribution Channel
Data Table on Comparison by Distribution Channel

8.3 Offline - Market size and forecast 2025-2030

Chart on Offline - Market size and forecast 2025-2030 ($ million)
Data Table on Offline - Market size and forecast 2025-2030 ($ million)
Chart on Offline - Year-over-year growth 2025-2030 (%)
Data Table on Offline - Year-over-year growth 2025-2030 (%)

8.4 Online - Market size and forecast 2025-2030

Chart on Online - Market size and forecast 2025-2030 ($ million)
Data Table on Online - Market size and forecast 2025-2030 ($ million)
Chart on Online - Year-over-year growth 2025-2030 (%)
Data Table on Online - Year-over-year growth 2025-2030 (%)

8.5 Market opportunity by Distribution Channel

Market opportunity by Distribution Channel ($ million)
Data Table on Market opportunity by Distribution Channel ($ million)

9. Market Segmentation by Application

9.1 Market segments

Chart on Application - Market share 2025-2030 (%)
Data Table on Application - Market share 2025-2030 (%)

9.2 Comparison by Application

Chart on Comparison by Application
Data Table on Comparison by Application

9.3 Skincare - Market size and forecast 2025-2030

Chart on Skincare - Market size and forecast 2025-2030 ($ million)
Data Table on Skincare - Market size and forecast 2025-2030 ($ million)
Chart on Skincare - Year-over-year growth 2025-2030 (%)
Data Table on Skincare - Year-over-year growth 2025-2030 (%)

9.4 Haircare - Market size and forecast 2025-2030

Chart on Haircare - Market size and forecast 2025-2030 ($ million)
Data Table on Haircare - Market size and forecast 2025-2030 ($ million)
Chart on Haircare - Year-over-year growth 2025-2030 (%)
Data Table on Haircare - Year-over-year growth 2025-2030 (%)

9.5 Color cosmetics - Market size and forecast 2025-2030

Chart on Color cosmetics - Market size and forecast 2025-2030 ($ million)
Data Table on Color cosmetics - Market size and forecast 2025-2030 ($ million)
Chart on Color cosmetics - Year-over-year growth 2025-2030 (%)
Data Table on Color cosmetics - Year-over-year growth 2025-2030 (%)

9.6 Market opportunity by Application

Market opportunity by Application ($ million)
Data Table on Market opportunity by Application ($ million)

10. Market Segmentation by Type

10.1 Market segments

Chart on Type - Market share 2025-2030 (%)
Data Table on Type - Market share 2025-2030 (%)

10.2 Comparison by Type

Chart on Comparison by Type
Data Table on Comparison by Type

10.3 Natural - Market size and forecast 2025-2030

Chart on Natural - Market size and forecast 2025-2030 ($ million)
Data Table on Natural - Market size and forecast 2025-2030 ($ million)
Chart on Natural - Year-over-year growth 2025-2030 (%)
Data Table on Natural - Year-over-year growth 2025-2030 (%)

10.4 Synthetic - Market size and forecast 2025-2030

Chart on Synthetic - Market size and forecast 2025-2030 ($ million)
Data Table on Synthetic - Market size and forecast 2025-2030 ($ million)
Chart on Synthetic - Year-over-year growth 2025-2030 (%)
Data Table on Synthetic - Year-over-year growth 2025-2030 (%)

10.5 Market opportunity by Type

Market opportunity by Type ($ million)
Data Table on Market opportunity by Type ($ million)

11. Customer Landscape

11.1 Customer landscape overview

Analysis of price sensitivity, lifecycle, customer purchase basket, adoption rates, and purchase criteria

12. Geographic Landscape

12.1 Geographic segmentation

Chart on Market share by geography 2025-2030 (%)
Data Table on Market share by geography 2025-2030 (%)

12.2 Geographic comparison

Chart on Geographic comparison
Data Table on Geographic comparison

12.3 APAC - Market size and forecast 2025-2030

Chart on APAC - Market size and forecast 2025-2030 ($ million)
Data Table on APAC - Market size and forecast 2025-2030 ($ million)
Chart on APAC - Year-over-year growth 2025-2030 (%)
Data Table on APAC - Year-over-year growth 2025-2030 (%)
Chart on Regional Comparison - APAC
Data Table on Regional Comparison - APAC

12.3.1 China - Market size and forecast 2025-2030

Chart on China - Market size and forecast 2025-2030 ($ million)
Data Table on China - Market size and forecast 2025-2030 ($ million)
Chart on China - Year-over-year growth 2025-2030 (%)
Data Table on China - Year-over-year growth 2025-2030 (%)

12.3.2 Japan - Market size and forecast 2025-2030

Chart on Japan - Market size and forecast 2025-2030 ($ million)
Data Table on Japan - Market size and forecast 2025-2030 ($ million)
Chart on Japan - Year-over-year growth 2025-2030 (%)
Data Table on Japan - Year-over-year growth 2025-2030 (%)

12.3.3 India - Market size and forecast 2025-2030

Chart on India - Market size and forecast 2025-2030 ($ million)
Data Table on India - Market size and forecast 2025-2030 ($ million)
Chart on India - Year-over-year growth 2025-2030 (%)
Data Table on India - Year-over-year growth 2025-2030 (%)

12.3.4 South Korea - Market size and forecast 2025-2030

Chart on South Korea - Market size and forecast 2025-2030 ($ million)
Data Table on South Korea - Market size and forecast 2025-2030 ($ million)
Chart on South Korea - Year-over-year growth 2025-2030 (%)
Data Table on South Korea - Year-over-year growth 2025-2030 (%)

12.3.5 Australia - Market size and forecast 2025-2030

Chart on Australia - Market size and forecast 2025-2030 ($ million)
Data Table on Australia - Market size and forecast 2025-2030 ($ million)
Chart on Australia - Year-over-year growth 2025-2030 (%)
Data Table on Australia - Year-over-year growth 2025-2030 (%)

12.3.6 Indonesia - Market size and forecast 2025-2030

Chart on Indonesia - Market size and forecast 2025-2030 ($ million)
Data Table on Indonesia - Market size and forecast 2025-2030 ($ million)
Chart on Indonesia - Year-over-year growth 2025-2030 (%)
Data Table on Indonesia - Year-over-year growth 2025-2030 (%)

12.4 Europe - Market size and forecast 2025-2030

Chart on Europe - Market size and forecast 2025-2030 ($ million)
Data Table on Europe - Market size and forecast 2025-2030 ($ million)
Chart on Europe - Year-over-year growth 2025-2030 (%)
Data Table on Europe - Year-over-year growth 2025-2030 (%)
Chart on Regional Comparison - Europe
Data Table on Regional Comparison - Europe

12.4.1 Germany - Market size and forecast 2025-2030

Chart on Germany - Market size and forecast 2025-2030 ($ million)
Data Table on Germany - Market size and forecast 2025-2030 ($ million)
Chart on Germany - Year-over-year growth 2025-2030 (%)
Data Table on Germany - Year-over-year growth 2025-2030 (%)

12.4.2 UK - Market size and forecast 2025-2030

Chart on UK - Market size and forecast 2025-2030 ($ million)
Data Table on UK - Market size and forecast 2025-2030 ($ million)
Chart on UK - Year-over-year growth 2025-2030 (%)
Data Table on UK - Year-over-year growth 2025-2030 (%)

12.4.3 France - Market size and forecast 2025-2030

Chart on France - Market size and forecast 2025-2030 ($ million)
Data Table on France - Market size and forecast 2025-2030 ($ million)
Chart on France - Year-over-year growth 2025-2030 (%)
Data Table on France - Year-over-year growth 2025-2030 (%)

12.4.4 Italy - Market size and forecast 2025-2030

Chart on Italy - Market size and forecast 2025-2030 ($ million)
Data Table on Italy - Market size and forecast 2025-2030 ($ million)
Chart on Italy - Year-over-year growth 2025-2030 (%)
Data Table on Italy - Year-over-year growth 2025-2030 (%)

12.4.5 Spain - Market size and forecast 2025-2030

Chart on Spain - Market size and forecast 2025-2030 ($ million)
Data Table on Spain - Market size and forecast 2025-2030 ($ million)
Chart on Spain - Year-over-year growth 2025-2030 (%)
Data Table on Spain - Year-over-year growth 2025-2030 (%)

12.4.6 The Netherlands - Market size and forecast 2025-2030

Chart on The Netherlands - Market size and forecast 2025-2030 ($ million)
Data Table on The Netherlands - Market size and forecast 2025-2030 ($ million)
Chart on The Netherlands - Year-over-year growth 2025-2030 (%)
Data Table on The Netherlands - Year-over-year growth 2025-2030 (%)

12.5 North America - Market size and forecast 2025-2030

Chart on North America - Market size and forecast 2025-2030 ($ million)
Data Table on North America - Market size and forecast 2025-2030 ($ million)
Chart on North America - Year-over-year growth 2025-2030 (%)
Data Table on North America - Year-over-year growth 2025-2030 (%)
Chart on Regional Comparison - North America
Data Table on Regional Comparison - North America

12.5.1 US - Market size and forecast 2025-2030

Chart on US - Market size and forecast 2025-2030 ($ million)
Data Table on US - Market size and forecast 2025-2030 ($ million)
Chart on US - Year-over-year growth 2025-2030 (%)
Data Table on US - Year-over-year growth 2025-2030 (%)

12.5.2 Canada - Market size and forecast 2025-2030

Chart on Canada - Market size and forecast 2025-2030 ($ million)
Data Table on Canada - Market size and forecast 2025-2030 ($ million)
Chart on Canada - Year-over-year growth 2025-2030 (%)
Data Table on Canada - Year-over-year growth 2025-2030 (%)

12.5.3 Mexico - Market size and forecast 2025-2030

Chart on Mexico - Market size and forecast 2025-2030 ($ million)
Data Table on Mexico - Market size and forecast 2025-2030 ($ million)
Chart on Mexico - Year-over-year growth 2025-2030 (%)
Data Table on Mexico - Year-over-year growth 2025-2030 (%)

12.6 South America - Market size and forecast 2025-2030

Chart on South America - Market size and forecast 2025-2030 ($ million)
Data Table on South America - Market size and forecast 2025-2030 ($ million)
Chart on South America - Year-over-year growth 2025-2030 (%)
Data Table on South America - Year-over-year growth 2025-2030 (%)
Chart on Regional Comparison - South America
Data Table on Regional Comparison - South America

12.6.1 Brazil - Market size and forecast 2025-2030

Chart on Brazil - Market size and forecast 2025-2030 ($ million)
Data Table on Brazil - Market size and forecast 2025-2030 ($ million)
Chart on Brazil - Year-over-year growth 2025-2030 (%)
Data Table on Brazil - Year-over-year growth 2025-2030 (%)

12.6.2 Argentina - Market size and forecast 2025-2030

Chart on Argentina - Market size and forecast 2025-2030 ($ million)
Data Table on Argentina - Market size and forecast 2025-2030 ($ million)
Chart on Argentina - Year-over-year growth 2025-2030 (%)
Data Table on Argentina - Year-over-year growth 2025-2030 (%)

12.6.3 Chile - Market size and forecast 2025-2030

Chart on Chile - Market size and forecast 2025-2030 ($ million)
Data Table on Chile - Market size and forecast 2025-2030 ($ million)
Chart on Chile - Year-over-year growth 2025-2030 (%)
Data Table on Chile - Year-over-year growth 2025-2030 (%)

12.7 Middle East and Africa - Market size and forecast 2025-2030

Chart on Middle East and Africa - Market size and forecast 2025-2030 ($ million)
Data Table on Middle East and Africa - Market size and forecast 2025-2030 ($ million)
Chart on Middle East and Africa - Year-over-year growth 2025-2030 (%)
Data Table on Middle East and Africa - Year-over-year growth 2025-2030 (%)
Chart on Regional Comparison - Middle East and Africa
Data Table on Regional Comparison - Middle East and Africa

12.7.1 Saudi Arabia - Market size and forecast 2025-2030

Chart on Saudi Arabia - Market size and forecast 2025-2030 ($ million)
Data Table on Saudi Arabia - Market size and forecast 2025-2030 ($ million)
Chart on Saudi Arabia - Year-over-year growth 2025-2030 (%)
Data Table on Saudi Arabia - Year-over-year growth 2025-2030 (%)

12.7.2 UAE - Market size and forecast 2025-2030

Chart on UAE - Market size and forecast 2025-2030 ($ million)
Data Table on UAE - Market size and forecast 2025-2030 ($ million)
Chart on UAE - Year-over-year growth 2025-2030 (%)
Data Table on UAE - Year-over-year growth 2025-2030 (%)

12.7.3 Turkey - Market size and forecast 2025-2030

Chart on Turkey - Market size and forecast 2025-2030 ($ million)
Data Table on Turkey - Market size and forecast 2025-2030 ($ million)
Chart on Turkey - Year-over-year growth 2025-2030 (%)
Data Table on Turkey - Year-over-year growth 2025-2030 (%)

12.7.4 South Africa - Market size and forecast 2025-2030

Chart on South Africa - Market size and forecast 2025-2030 ($ million)
Data Table on South Africa - Market size and forecast 2025-2030 ($ million)
Chart on South Africa - Year-over-year growth 2025-2030 (%)
Data Table on South Africa - Year-over-year growth 2025-2030 (%)

12.7.5 Israel - Market size and forecast 2025-2030

Chart on Israel - Market size and forecast 2025-2030 ($ million)
Data Table on Israel - Market size and forecast 2025-2030 ($ million)
Chart on Israel - Year-over-year growth 2025-2030 (%)
Data Table on Israel - Year-over-year growth 2025-2030 (%)

12.8 Market opportunity by geography

Market opportunity by geography ($ million)
Data Tables on Market opportunity by geography ($ million)

13. Drivers, Challenges, and Opportunity

13.1 Market drivers

Heightened consumer focus on skin longevity
Rising urbanization and environmental pollution levels
Expansion of clean beauty and green ingredients

13.2 Market challenges

Chemical instability and formulation degradation
Regulatory compliance and substantiation hurdles
Supply chain vulnerabilities and sourcing

13.3 Impact of drivers and challenges

Impact of drivers and challenges in 2025 and 2030

13.4 Market opportunities

Rising urban pollution protection demand
Expansion of plant-based clean beauty
Rise of advanced delivery systems

14. Competitive Landscape

14.1 Overview

14.2

Overview on criticality of inputs and factors of differentiation

14.3 Landscape disruption

Overview on factors of disruption

14.4 Industry risks

Impact of key risks on business

15. Competitive Analysis

15.1 Companies profiled

Companies covered

15.2 Company ranking index

15.3 Market positioning of companies

Matrix on companies position and classification

15.4 Archer Daniels Midland Co.

Archer Daniels Midland Co. - Overview
Archer Daniels Midland Co. - Business segments
Archer Daniels Midland Co. - Key news
Archer Daniels Midland Co. - Key offerings
Archer Daniels Midland Co. - Segment focus
SWOT

15.5 Ashland Inc.

Ashland Inc. - Overview
Ashland Inc. - Business segments
Ashland Inc. - Key news
Ashland Inc. - Key offerings
Ashland Inc. - Segment focus
SWOT

15.6 BASF SE

BASF SE - Overview
BASF SE - Business segments
BASF SE - Key news
BASF SE - Key offerings
BASF SE - Segment focus
SWOT

15.7 BIOTECNOLOGIAS APLICADAS SL

BIOTECNOLOGIAS APLICADAS SL - Overview
BIOTECNOLOGIAS APLICADAS SL - Product / Service
BIOTECNOLOGIAS APLICADAS SL - Key offerings
SWOT

15.8 DSM Firmenich AG

DSM Firmenich AG - Overview
DSM Firmenich AG - Business segments
DSM Firmenich AG - Key offerings
DSM Firmenich AG - Segment focus
SWOT

15.9 Eastman Chemical Co.

Eastman Chemical Co. - Overview
Eastman Chemical Co. - Business segments
Eastman Chemical Co. - Key offerings
Eastman Chemical Co. - Segment focus
SWOT

15.10 Evonik Industries AG

Evonik Industries AG - Overview
Evonik Industries AG - Business segments
Evonik Industries AG - Key news
Evonik Industries AG - Key offerings
Evonik Industries AG - Segment focus
SWOT

15.11 Kao Corp.

Kao Corp. - Overview
Kao Corp. - Business segments
Kao Corp. - Key news
Kao Corp. - Key offerings
Kao Corp. - Segment focus
SWOT

15.12 Lonza Group Ltd.

Lonza Group Ltd. - Overview
Lonza Group Ltd. - Business segments
Lonza Group Ltd. - Key news
Lonza Group Ltd. - Key offerings
Lonza Group Ltd. - Segment focus
SWOT

15.13 Natura Cosmeticos S.A.

Natura Cosmeticos S.A. - Overview
Natura Cosmeticos S.A. - Business segments
Natura Cosmeticos S.A. - Key offerings
Natura Cosmeticos S.A. - Segment focus
SWOT

15.14 Shiseido Co. Ltd.

Shiseido Co. Ltd. - Overview
Shiseido Co. Ltd. - Business segments
Shiseido Co. Ltd. - Key offerings
Shiseido Co. Ltd. - Segment focus
SWOT

15.15 Symrise Group

Symrise Group - Overview
Symrise Group - Business segments
Symrise Group - Key news
Symrise Group - Key offerings
Symrise Group - Segment focus
SWOT

15.16 The Estee Lauder Co.

The Estee Lauder Co. - Overview
The Estee Lauder Co. - Business segments
The Estee Lauder Co. - Key offerings
The Estee Lauder Co. - Segment focus
SWOT

15.17 Unilever PLC

Unilever PLC - Overview
Unilever PLC - Business segments
Unilever PLC - Key news
Unilever PLC - Key offerings
Unilever PLC - Segment focus
SWOT

15.18 Wacker Chemie AG

Wacker Chemie AG - Overview
Wacker Chemie AG - Business segments
Wacker Chemie AG - Key offerings
Wacker Chemie AG - Segment focus
SWOT

16. Appendix

16.1 Scope of the report

Market definition
Objectives
Notes and caveats

16.2 Inclusions and exclusions checklist

Inclusions checklist
Exclusions checklist

16.3 Currency conversion rates for US$

16.4 Research methodology

16.5 Data procurement

Information sources

16.6 Data validation

16.7 Validation techniques employed for market sizing

16.8 Data synthesis

16.9 360 degree market analysis

16.10 List of abbreviations

Research Methodology

Technavio presents a detailed picture of the market by way of study, synthesis, and summation of data from multiple sources. The analysts have presented the various facets of the market with a particular focus on identifying the key industry influencers. The data thus presented is comprehensive, reliable, and the result of extensive research, both primary and secondary.

INFORMATION SOURCES

Primary sources

  • Manufacturers and suppliers
  • Channel partners
  • Industry experts
  • Strategic decision makers

Secondary sources

  • Industry journals and periodicals
  • Government data
  • Financial reports of key industry players
  • Historical data
  • Press releases

DATA ANALYSIS

Data Synthesis

  • Collation of data
  • Estimation of key figures
  • Analysis of derived insights

Data Validation

  • Triangulation with data models
  • Reference against proprietary databases
  • Corroboration with industry experts

REPORT WRITING

Qualitative

  • Market drivers
  • Market challenges
  • Market trends
  • Five forces analysis

Quantitative

  • Market size and forecast
  • Market segmentation
  • Geographical insights
  • Competitive landscape

Interested in this report?

Get your sample now to see our research methodology and insights!

Download Now

Frequently Asked Questions

Antioxidant Cosmetic Products market growth will increase by USD 25377.7 million during 2026-2030.

The Antioxidant Cosmetic Products market is expected to grow at a CAGR of 7.9% during 2026-2030.

Antioxidant Cosmetic Products market is segmented by Distribution channel (Offline, Online) Application (Skincare, Haircare, Color cosmetics) Type (Natural, Synthetic)

Archer Daniels Midland Co., Ashland Inc., BASF SE, BIOTECNOLOGIAS APLICADAS SL, DSM Firmenich AG, Eastman Chemical Co., Evonik Industries AG, Kao Corp., Kemin Industries Inc., Lonza Group Ltd., Natura Cosmeticos S.A., Pierre Fabre SA, Sabinsa Corp., SEPPIC SA, Shiseido Co. Ltd., Symrise Group, The Estee Lauder Co., The Lubrizol Corp., Unilever PLC, Wacker Chemie AG are a few of the key vendors in the Antioxidant Cosmetic Products market.

APAC will register the highest growth rate of 53.5% among the other regions. Therefore, the Antioxidant Cosmetic Products market in APAC is expected to garner significant business opportunities for the vendors during the forecast period.

China, Japan, India, South Korea, Australia, Indonesia, Germany, UK, France, Italy, Spain, The Netherlands, US, Canada, Mexico, Brazil, Argentina, Chile, Saudi Arabia, UAE, Turkey, South Africa, Israel

  • Heightened consumer focus on skin longevity is the driving factor this market.

The Antioxidant Cosmetic Products market vendors should focus on grabbing business opportunities from the Distribution channel segment as it accounted for the largest market share in the base year.
RIA - Research AI Assistant
Ask RIA
