Antigen Market Analysis, Size, and Forecast 2026-2030: North America (US, Canada, and Mexico), Europe (Germany, UK, and France), APAC (China, India, and Japan), South America (Brazil, Argentina, and Colombia), Middle East and Africa (Saudi Arabia, UAE, and Turkey), Asia, Rest of World (ROW)

Antigen Market Analysis, Size, and Forecast 2026-2030:
North America (US, Canada, and Mexico), Europe (Germany, UK, and France), APAC (China, India, and Japan), South America (Brazil, Argentina, and Colombia), Middle East and Africa (Saudi Arabia, UAE, and Turkey), Asia, Rest of World (ROW)

Published: Apr 2026 297 Pages SKU: IRTNTR80728

Market Overview at a Glance

$694.6 Mn
Market Opportunity
8.1%
CAGR 2025 - 2030
31.7%
North America Growth
$718.7 Mn
Viral antigens segment 2024

Antigen Market Size 2026-2030

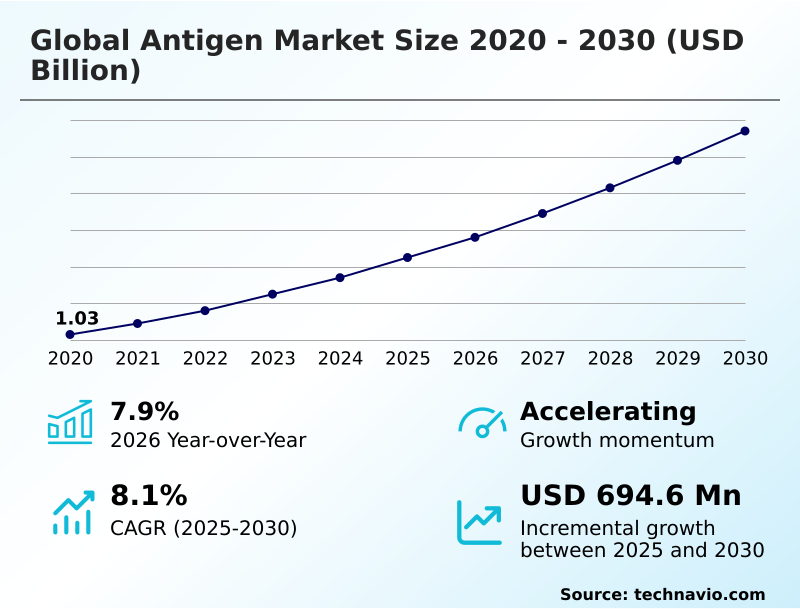
The antigen market size is valued to increase by USD 694.6 million, at a CAGR of 8.1% from 2025 to 2030. Increasing global burden of infectious and chronic diseases will drive the antigen market.

Major Market Trends & Insights

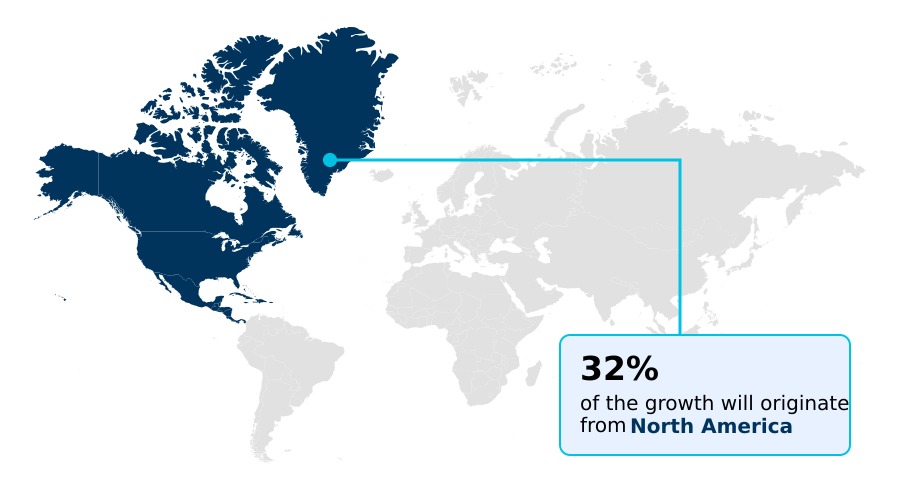
  • North America dominated the market and accounted for a 31.7% growth during the forecast period.
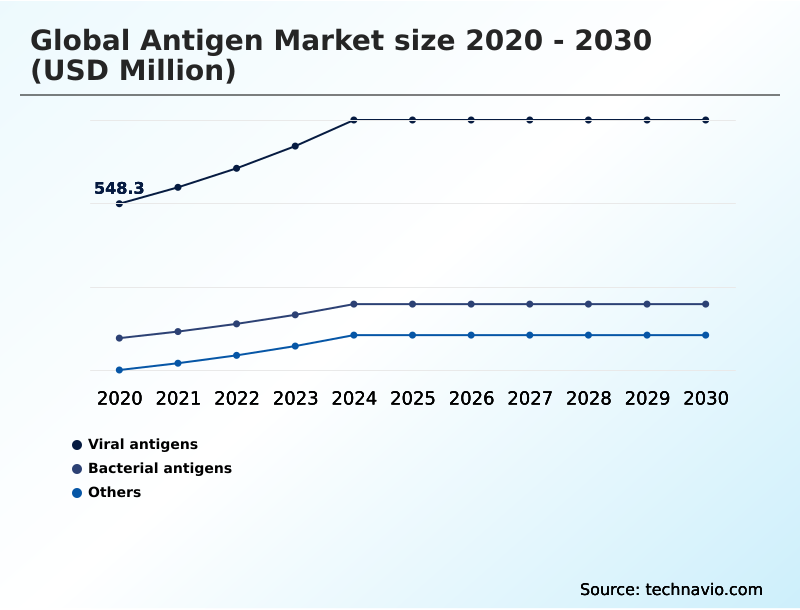
  • By Type - Viral antigens segment was valued at USD 718.7 million in 2024
  • By Application - Medical diagnostic segment accounted for the largest market revenue share in 2024

Market Size & Forecast

  • Market Opportunities: USD 1.11 billion
  • Market Future Opportunities: USD 694.6 million
  • CAGR from 2025 to 2030 : 8.1%

Market Summary

  • The antigen market is expanding due to the persistent need for better diagnostic and preventative tools against infectious and chronic diseases. Key trends, such as the rise of personalized oncology and the demand for neoantigens, are transforming the cancer treatment landscape. This shift toward patient-specific therapies requires a hyper-localized approach to manufacturing, driving the development of small-scale automated production units.
  • A significant business challenge arises for manufacturers in this space, as they must ensure batch-to-batch consistency and navigate complex regulatory frameworks while managing intense price competition in commoditized segments.
  • For instance, a contract development organization must balance investment in advanced protein purification technologies to maintain quality with the need for process intensification to control costs, all while adhering to evolving GMP standards to avoid costly product recalls and maintain market access across different regions.

What will be the Size of the Antigen Market during the forecast period?

Get Key Insights on Market Forecast (PDF) Request Free Sample

How is the Antigen Market Segmented?

The antigen industry research report provides comprehensive data (region-wise segment analysis), with forecasts and estimates in "USD million" for the period 2026-2030, as well as historical data from 2020-2024 for the following segments.

  • Type
    • Viral antigens
    • Bacterial antigens
    • Others
  • Application
    • Medical diagnostic
    • Vaccine development
    • Others
  • End-user
    • Manufacturers
    • Diagnostic centers
    • Hospitals
    • Research institutes
  • Geography
    • North America
      • US
      • Canada
      • Mexico
    • Europe
      • Germany
      • UK
      • France
    • Asia
    • Rest of World (ROW)

By Type Insights

The viral antigens segment is estimated to witness significant growth during the forecast period.

The viral antigens segment leads the industry, driven by frequent respiratory and zoonotic outbreaks. These biological components are critical for producing seasonal vaccines and developing rapid diagnostic tests.

Manufacturers use advanced recombinant DNA technology and gene editing to produce viral proteins mimicking pathogens like influenza and coronaviruses. This focus on high-purity recombinant protein antigens ensures vaccines are both safe and highly immunogenic.

The demand for these components is also fueled by surveillance programs monitoring viral drift.

Adherence to strict quality assurance protocols and high-throughput screening methods has improved production yields by over 40%, ensuring supply chain resilience for both routine immunizations and pandemic response efforts.

This technical focus on immunogenicity and protein purification remains paramount for global health stability.

Request Free Sample

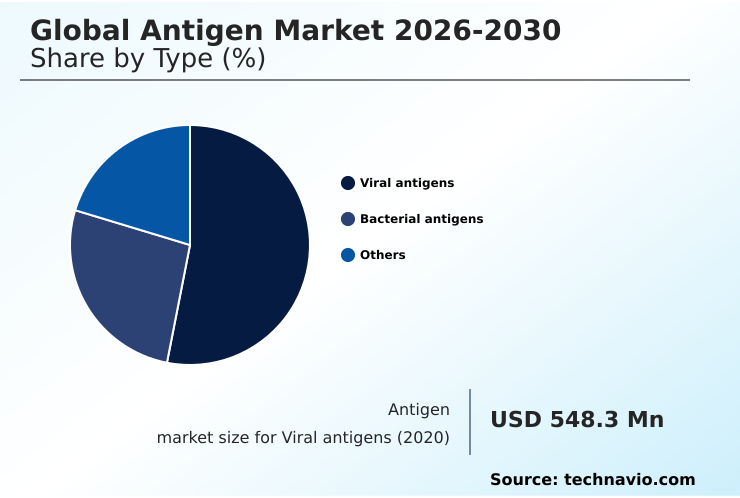
The Viral antigens segment was valued at USD 718.7 million in 2024 and showed a gradual increase during the forecast period.

Request Free Sample

Regional Analysis

North America is estimated to contribute 31.7% to the growth of the global market during the forecast period.Technavio’s analysts have elaborately explained the regional trends and drivers that shape the market during the forecast period.

See How Antigen Market Demand is Rising in North America Request Free Sample

The geographic landscape of the market is characterized by distinct regional strengths and growth trajectories.

Asia is emerging as a high-growth region, propelled by expanding healthcare infrastructure and a focus on cost-effective manufacturing of bacterial antigens, which now accounts for a significant portion of regional output.

North America, contributing over 31% of the global market opportunity, continues to lead in innovation, particularly in the development of monoclonal antibodies and CAR-T cells. This is supported by a robust ecosystem of biotechnology firms and research institutions.

European markets are defined by stringent regulatory standards and a strong emphasis on clinical validation for new diagnostic biomarkers.

This focus on quality has led to advancements in mass spectrometry techniques that improve batch-to-batch consistency by up to 15%, reducing waste in production.

Market Dynamics

Our researchers analyzed the data with 2025 as the base year, along with the key drivers, trends, and challenges. A holistic analysis of drivers will help companies refine their marketing strategies to gain a competitive advantage.

  • The Global Antigen Market 2026-2030 is evolving through specialization, with distinct strategies for different applications. The use of the Global Antigen Market 2026-2030 for cancer immunotherapy is pioneering personalized medicine, while the Global Antigen Market 2026-2030 in infectious disease diagnostics focuses on speed and accessibility.
  • Concurrently, the Global Antigen Market 2026-2030 for autoimmune disorder screening demands high specificity to avoid misdiagnosis. Technologically, the field is advancing rapidly; the Global Antigen Market 2026-2030 using recombinant DNA technology remains a cornerstone, but innovations like the Global Antigen Market 2026-2030 for cell-free protein synthesis are enabling faster development.
  • This progress directly supports the Global Antigen Market 2026-2030 for rapid point-of-care tests and is crucial for the Global Antigen Market 2026-2030 and nucleic acid vaccine validation. The complex demands of the Global Antigen Market 2026-2030 for personalized neoantigen production are driving new manufacturing paradigms. In diagnostics, the Global Antigen Market 2026-2030 in multiplex diagnostic panels offers comprehensive screening.
  • Production efficiency is being transformed by the Global Antigen Market 2026-2030 with AI-driven bioreactor monitoring and Global Antigen Market 2026-2030 and chromatography resin innovation. The Global Antigen Market 2026-2030 for high-throughput screening platforms accelerates discovery, while a key industry challenge remains the Global Antigen Market 2026-2030 ensuring protein folding consistency.
  • Adherence to the Global Antigen Market 2026-2030 and Good Manufacturing Practice compliance is non-negotiable. Strategically, the Global Antigen Market 2026-2030 for decentralized manufacturing hubs and the Global Antigen Market 2026-2030 and pandemic preparedness stockpiling enhance global health security.
  • These efforts also support the Global Antigen Market 2026-2030 to counter antimicrobial resistance and improve the Global Antigen Market 2026-2030 in public health surveillance systems. Finally, the development of the Global Antigen Market 2026-2030 for CAR-T cell therapy targets and the Global Antigen Market 2026-2030 for liquid biopsy tumor markers points to a future of highly targeted therapies.
  • Companies leveraging AI-driven bioreactor controls have demonstrated a twofold improvement in maintaining protein folding consistency compared to manual methods, directly impacting product efficacy.

What are the key market drivers leading to the rise in the adoption of Antigen Industry?

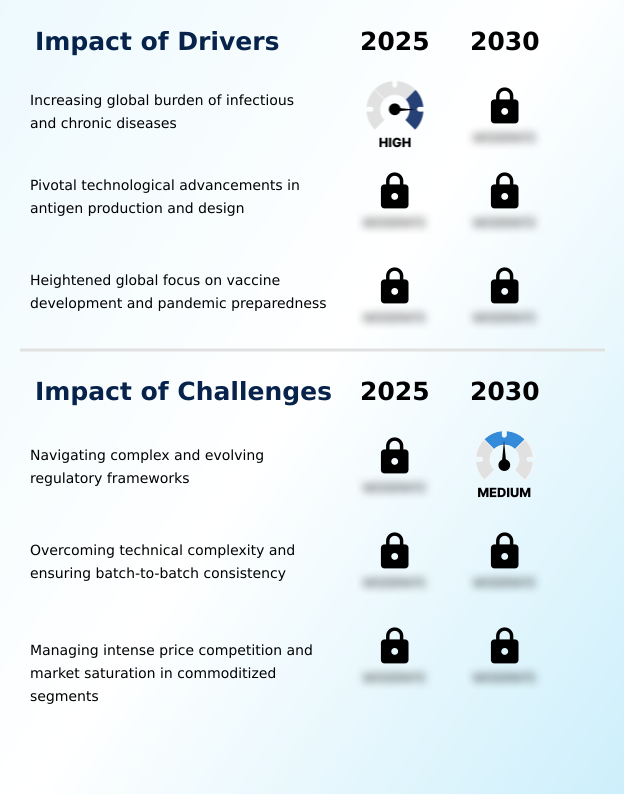
  • The increasing global burden of infectious and chronic diseases stands as a key driver for market growth.

  • Market growth is fundamentally driven by technological advancements in antigen production and a heightened focus on pandemic preparedness.
  • Innovations in cell-free protein synthesis and computational biology are accelerating development timelines, with some firms reporting a 25% reduction in the time from antigen design to clinical candidate selection. This efficiency is attracting significant investment.
  • Concurrently, the global push for vaccine self-sufficiency has led to the establishment of regional manufacturing hubs and the expansion of warm manufacturing capacity.
  • These facilities not only enhance supply chain resilience but also support the development of prototype vaccines for strategic stockpiling, ensuring a steady demand for high-purity antigens. This public-private alignment reduces investment risk for manufacturers by an estimated 15%.

What are the market trends shaping the Antigen Industry?

  • A key market trend is the shifting role of antigens, which are evolving from primary vaccine components to critical validation and boosting tools in the era of nucleic acid platforms.

  • Key trends are reshaping the market's structure, driven by the expansion of multiplexing in diagnostics and the rise of personalized medicine. The demand for neoantigens in oncology is creating a new segment focused on small-scale automated production, a stark contrast to high-volume viral antigen manufacturing.
  • This has led to the adoption of advanced bioinformatics services capable of identifying patient-specific tumor antigens with over 95% accuracy. Furthermore, the use of antibody-antigen complexes is evolving, with hybrid platforms combining nucleic acid instructions and protein-based prime-boost agents to enhance immunogenicity.
  • This synergy is critical, as data indicates that hybrid vaccine strategies can increase the durability of immune responses by up to 30% compared to single-platform approaches.

What challenges does the Antigen Industry face during its growth?

  • Navigating complex and evolving regulatory frameworks presents a key challenge that affects industry growth.

  • Navigating complex regulatory frameworks and ensuring high technical proficiency remain significant challenges. Manufacturers face a fragmented global landscape, where compliance with standards like the In Vitro Diagnostic Regulation (IVDR) and GMP requires substantial investment, increasing documentation overhead by up to 30%. This is compounded by the technical difficulty of maintaining batch-to-batch consistency in biological production.
  • Slight variations in glycosylation patterns or protein folding can lead to batch failure rates that exceed 10% without advanced bioreactor monitoring and post-market surveillance. Furthermore, intense price competition in commoditized segments, such as standard viral antigens for lateral flow devices, forces companies to pursue process intensification to protect margins.

Exclusive Technavio Analysis on Customer Landscape

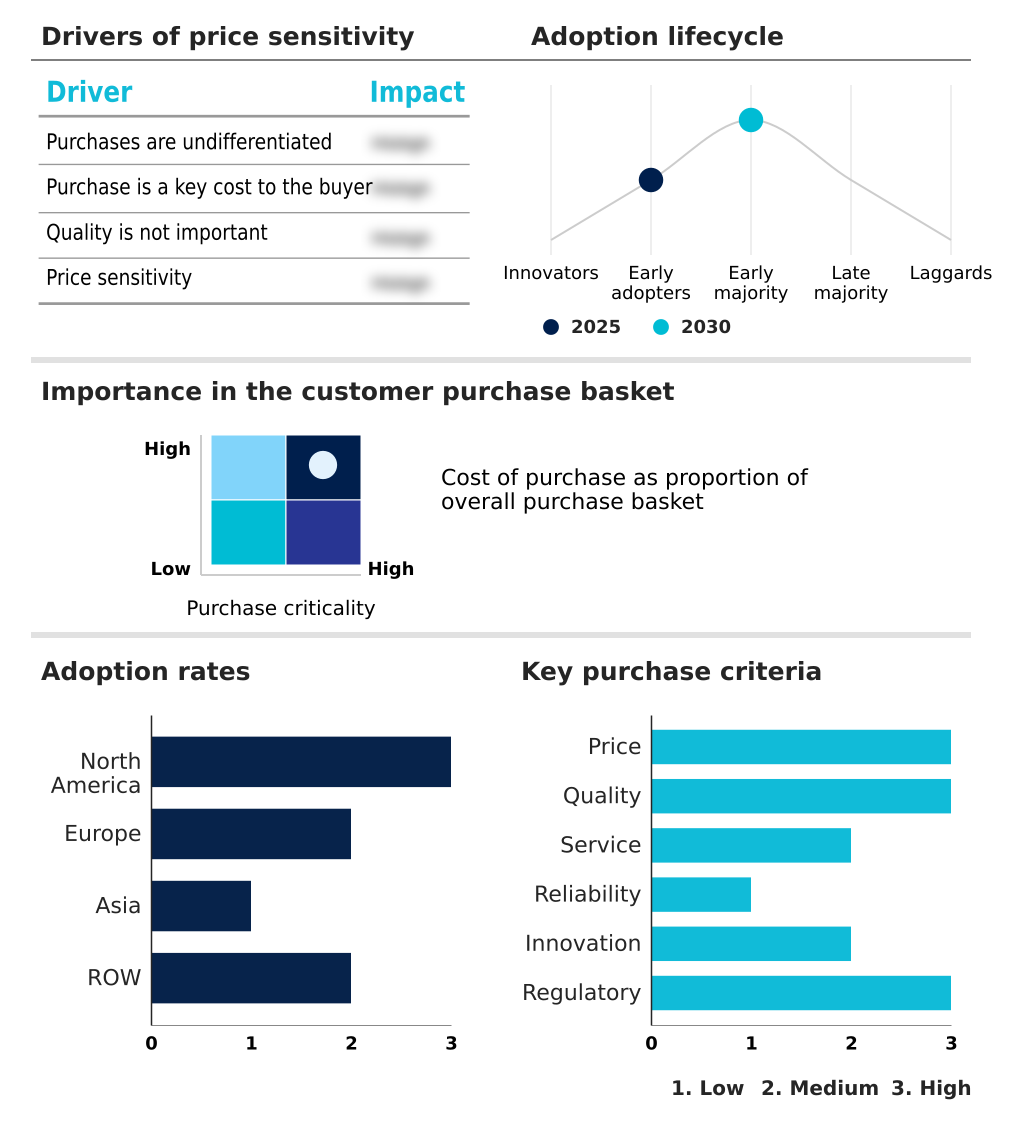
The antigen market forecasting report includes the adoption lifecycle of the market, covering from the innovator’s stage to the laggard’s stage. It focuses on adoption rates in different regions based on penetration. Furthermore, the antigen market report also includes key purchase criteria and drivers of price sensitivity to help companies evaluate and develop their market growth analysis strategies.

Customer Landscape of Antigen Industry

Competitive Landscape

Companies are implementing various strategies, such as strategic alliances, antigen market forecast, partnerships, mergers and acquisitions, geographical expansion, and product/service launches, to enhance their presence in the industry.

Abcam plc - Providing high-purity recombinant proteins, native proteins, and peptide antigens for advanced immunoassay applications and critical immunological research.

The industry research and growth report includes detailed analyses of the competitive landscape of the market and information about key companies, including:

  • Abcam plc
  • Agilent Technologies Inc.
  • Bio Rad Laboratories Inc.
  • Bio Techne Corp.
  • BioMerieux SA
  • Creative Diagnostics
  • Danaher Corp.
  • DiaSorin SpA
  • Fapon Biotech
  • GenScript Biotech Corp.
  • Hologic Inc.
  • ImmunoDX LLC
  • LGC Ltd.
  • Merck KGaA
  • RayBiotech Life Inc.
  • Sd Biosensor Inc.
  • Siemens Healthineers AG
  • Sino Biological Inc.
  • Sysmex Corp.
  • Thermo Fisher Scientific Inc.

Qualitative and quantitative analysis of companies has been conducted to help clients understand the wider business environment as well as the strengths and weaknesses of key industry players. Data is qualitatively analyzed to categorize companies as pure play, category-focused, industry-focused, and diversified; it is quantitatively analyzed to categorize companies as dominant, leading, strong, tentative, and weak.

Recent Development and News in Antigen market

  • In March 2025, Sanofi will increase its capital investment in recombinant protein antigen production by twenty percent to meet the soaring global demand for RSV preventative treatments for pediatric populations.
  • In June 2025, Thermo Fisher Scientific will launch its next generation protein purification platform designed to enhance the yield of complex viral antigens by forty percent using advanced chromatography resins.
  • In September 2025, Gritstone Bio is scheduled to release pivotal Phase 2 data for its personalized neoantigen immunotherapy which utilizes patient specific tumor antigens to target metastatic solid cancers.
  • In December 2025, Roche Diagnostics will introduce a new high throughput multiplex antigen panel capable of detecting up to twelve different respiratory pathogens simultaneously in point of care settings.

Dive into Technavio’s robust research methodology, blending expert interviews, extensive data synthesis, and validated models for unparalleled Antigen Market insights. See full methodology.

Market Scope
Page number 297
Base year 2025
Historic period 2020-2024
Forecast period 2026-2030
Growth momentum & CAGR Accelerate at a CAGR of 8.1%
Market growth 2026-2030 USD 694.6 million
Market structure Fragmented
YoY growth 2025-2026(%) 7.9%
Key countries US, Canada, Mexico, Germany, UK, France, Italy, Spain, The Netherlands, China, India, Japan, South Korea, Thailand, Indonesia, Brazil, Saudi Arabia, UAE, Turkey, Argentina, Colombia, South Africa and Israel
Competitive landscape Leading Companies, Market Positioning of Companies, Competitive Strategies, and Industry Risks

Request Free Sample

Research Analyst Overview

  • The antigen market's trajectory is defined by a convergence of advanced production technologies and escalating diagnostic demands. Core to this is the manufacturing of recombinant protein antigens and synthetic antigens, where innovations in cell free protein synthesis, gene editing, and computational biology are pivotal.
  • The precision required for vaccine development and point-of-care testing makes protein folding consistency and batch-to-batch consistency paramount. To meet these standards, firms rely on high throughput screening, mass spectrometry, and advanced chromatography resins. The market is segmented by viral antigens, bacterial antigens, and high-value neoantigens for personalized medicine.
  • These components are essential for immunoassay techniques, molecular testing, and the creation of monoclonal antibodies and CAR-T cells. The increasing use of multiplexing in diagnostic biomarkers has led to boardroom-level decisions to invest in microfluidics and surface chemistry R&D.
  • For instance, platforms integrating these technologies can process samples up to 60% faster, a critical advantage in a competitive landscape where immunogenicity and purity are key differentiators.

What are the Key Data Covered in this Antigen Market Research and Growth Report?

  • What is the expected growth of the Antigen Market between 2026 and 2030?

    • USD 694.6 million, at a CAGR of 8.1%

  • What segmentation does the market report cover?

    • The report is segmented by Type (Viral antigens, Bacterial antigens, and Others), Application (Medical diagnostic, Vaccine development, and Others), End-user (Manufacturers, Diagnostic centers, Hospitals, and Research institutes) and Geography (North America, Europe, Asia, Rest of World (ROW))

  • Which regions are analyzed in the report?

    • North America, Europe, Asia and Rest of World (ROW)

  • What are the key growth drivers and market challenges?

    • Increasing global burden of infectious and chronic diseases, Navigating complex and evolving regulatory frameworks

  • Who are the major players in the Antigen Market?

    • Abcam plc, Agilent Technologies Inc., Bio Rad Laboratories Inc., Bio Techne Corp., BioMerieux SA, Creative Diagnostics, Danaher Corp., DiaSorin SpA, Fapon Biotech, GenScript Biotech Corp., Hologic Inc., ImmunoDX LLC, LGC Ltd., Merck KGaA, RayBiotech Life Inc., Sd Biosensor Inc., Siemens Healthineers AG, Sino Biological Inc., Sysmex Corp. and Thermo Fisher Scientific Inc.

Market Research Insights

  • Market dynamics are increasingly shaped by efforts to enhance operational efficiency and supply chain resilience. Strategic investments in decentralized manufacturing hubs are showing a 15% reduction in cross-border logistical hurdles, while the adoption of warm manufacturing capacity ensures readiness without the full cost of idle facilities.
  • The application of bioinformatics services is accelerating research, with some labs reporting a 40% decrease in the time required for neoantigen identification in personalized oncology. Furthermore, adherence to stringent regulatory frameworks like the In Vitro Diagnostic Regulation is being streamlined through digital platforms, which have demonstrated a 20% improvement in compliance documentation efficiency.
  • This focus on technological and strategic optimization is critical for navigating the competitive landscape.

We can help! Our analysts can customize this antigen market research report to meet your requirements.

Get in touch

1. Executive Summary

1.1 Market overview

Executive Summary - Chart on Market Overview
Executive Summary - Data Table on Market Overview
Executive Summary - Chart on Global Market Characteristics
Executive Summary - Chart on Market by Geography
Executive Summary - Chart on Market Segmentation by Type
Executive Summary - Chart on Market Segmentation by Application
Executive Summary - Chart on Market Segmentation by End-user
Executive Summary - Chart on Incremental Growth
Executive Summary - Data Table on Incremental Growth
Executive Summary - Chart on Company Market Positioning

2. Technavio Analysis

2.1 Analysis of price sensitivity, lifecycle, customer purchase basket, adoption rates, and purchase criteria

2.2 Criticality of inputs and Factors of differentiation

Chart on Overview on criticality of inputs and factors of differentiation

2.3 Factors of disruption

Chart on Overview on factors of disruption

2.4 Impact of drivers and challenges

Chart on Impact of drivers and challenges in 2025 and 2030

3. Market Landscape

3.1 Market ecosystem

Chart on Parent Market
Data Table on - Parent Market

3.2 Market characteristics

Chart on Market characteristics analysis

3.3 Value chain analysis

Chart on Value chain analysis

4. Market Sizing

4.1 Market definition

Data Table on Offerings of companies included in the market definition

4.2 Market segment analysis

Market segments

4.3 Market size 2025

4.4 Market outlook: Forecast for 2025-2030

Chart on Global - Market size and forecast 2025-2030 ($ million)
Data Table on Global - Market size and forecast 2025-2030 ($ million)
Chart on Global Market: Year-over-year growth 2025-2030 (%)
Data Table on Global Market: Year-over-year growth 2025-2030 (%)

5. Historic Market Size

5.1 Global Antigen Market 2020 - 2024

Historic Market Size - Data Table on Global Antigen Market 2020 - 2024 ($ million)

5.2 Type segment analysis 2020 - 2024

Historic Market Size - Type Segment 2020 - 2024 ($ million)

5.3 Application segment analysis 2020 - 2024

Historic Market Size - Application Segment 2020 - 2024 ($ million)

5.4 End-user segment analysis 2020 - 2024

Historic Market Size - End-user Segment 2020 - 2024 ($ million)

5.5 Geography segment analysis 2020 - 2024

Historic Market Size - Geography Segment 2020 - 2024 ($ million)

5.6 Country segment analysis 2020 - 2024

Historic Market Size - Country Segment 2020 - 2024 ($ million)

6. Qualitative Analysis

6.1 Impact of AI on Global Antigen Market

6.2 Impact of Geopolitical Conflicts on Global Antigen Market

7. Five Forces Analysis

7.1 Five forces summary

Five forces analysis - Comparison between 2025 and 2030

7.2 Bargaining power of buyers

Bargaining power of buyers - Impact of key factors 2025 and 2030

7.3 Bargaining power of suppliers

Bargaining power of suppliers - Impact of key factors in 2025 and 2030

7.4 Threat of new entrants

Threat of new entrants - Impact of key factors in 2025 and 2030

7.5 Threat of substitutes

Threat of substitutes - Impact of key factors in 2025 and 2030

7.6 Threat of rivalry

Threat of rivalry - Impact of key factors in 2025 and 2030

7.7 Market condition

Chart on Market condition - Five forces 2025 and 2030

8. Market Segmentation by Type

8.1 Market segments

Chart on Type - Market share 2025-2030 (%)
Data Table on Type - Market share 2025-2030 (%)

8.2 Comparison by Type

Chart on Comparison by Type
Data Table on Comparison by Type

8.3 Viral antigens - Market size and forecast 2025-2030

Chart on Viral antigens - Market size and forecast 2025-2030 ($ million)
Data Table on Viral antigens - Market size and forecast 2025-2030 ($ million)
Chart on Viral antigens - Year-over-year growth 2025-2030 (%)
Data Table on Viral antigens - Year-over-year growth 2025-2030 (%)

8.4 Bacterial antigens - Market size and forecast 2025-2030

Chart on Bacterial antigens - Market size and forecast 2025-2030 ($ million)
Data Table on Bacterial antigens - Market size and forecast 2025-2030 ($ million)
Chart on Bacterial antigens - Year-over-year growth 2025-2030 (%)
Data Table on Bacterial antigens - Year-over-year growth 2025-2030 (%)

8.5 Others - Market size and forecast 2025-2030

Chart on Others - Market size and forecast 2025-2030 ($ million)
Data Table on Others - Market size and forecast 2025-2030 ($ million)
Chart on Others - Year-over-year growth 2025-2030 (%)
Data Table on Others - Year-over-year growth 2025-2030 (%)

8.6 Market opportunity by Type

Market opportunity by Type ($ million)
Data Table on Market opportunity by Type ($ million)

9. Market Segmentation by Application

9.1 Market segments

Chart on Application - Market share 2025-2030 (%)
Data Table on Application - Market share 2025-2030 (%)

9.2 Comparison by Application

Chart on Comparison by Application
Data Table on Comparison by Application

9.3 Medical diagnostic - Market size and forecast 2025-2030

Chart on Medical diagnostic - Market size and forecast 2025-2030 ($ million)
Data Table on Medical diagnostic - Market size and forecast 2025-2030 ($ million)
Chart on Medical diagnostic - Year-over-year growth 2025-2030 (%)
Data Table on Medical diagnostic - Year-over-year growth 2025-2030 (%)

9.4 Vaccine development - Market size and forecast 2025-2030

Chart on Vaccine development - Market size and forecast 2025-2030 ($ million)
Data Table on Vaccine development - Market size and forecast 2025-2030 ($ million)
Chart on Vaccine development - Year-over-year growth 2025-2030 (%)
Data Table on Vaccine development - Year-over-year growth 2025-2030 (%)

9.5 Others - Market size and forecast 2025-2030

Chart on Others - Market size and forecast 2025-2030 ($ million)
Data Table on Others - Market size and forecast 2025-2030 ($ million)
Chart on Others - Year-over-year growth 2025-2030 (%)
Data Table on Others - Year-over-year growth 2025-2030 (%)

9.6 Market opportunity by Application

Market opportunity by Application ($ million)
Data Table on Market opportunity by Application ($ million)

10. Market Segmentation by End-user

10.1 Market segments

Chart on End-user - Market share 2025-2030 (%)
Data Table on End-user - Market share 2025-2030 (%)

10.2 Comparison by End-user

Chart on Comparison by End-user
Data Table on Comparison by End-user

10.3 Manufacturers - Market size and forecast 2025-2030

Chart on Manufacturers - Market size and forecast 2025-2030 ($ million)
Data Table on Manufacturers - Market size and forecast 2025-2030 ($ million)
Chart on Manufacturers - Year-over-year growth 2025-2030 (%)
Data Table on Manufacturers - Year-over-year growth 2025-2030 (%)

10.4 Diagnostic centers - Market size and forecast 2025-2030

Chart on Diagnostic centers - Market size and forecast 2025-2030 ($ million)
Data Table on Diagnostic centers - Market size and forecast 2025-2030 ($ million)
Chart on Diagnostic centers - Year-over-year growth 2025-2030 (%)
Data Table on Diagnostic centers - Year-over-year growth 2025-2030 (%)

10.5 Hospitals - Market size and forecast 2025-2030

Chart on Hospitals - Market size and forecast 2025-2030 ($ million)
Data Table on Hospitals - Market size and forecast 2025-2030 ($ million)
Chart on Hospitals - Year-over-year growth 2025-2030 (%)
Data Table on Hospitals - Year-over-year growth 2025-2030 (%)

10.6 Research institutes - Market size and forecast 2025-2030

Chart on Research institutes - Market size and forecast 2025-2030 ($ million)
Data Table on Research institutes - Market size and forecast 2025-2030 ($ million)
Chart on Research institutes - Year-over-year growth 2025-2030 (%)
Data Table on Research institutes - Year-over-year growth 2025-2030 (%)

10.7 Market opportunity by End-user

Market opportunity by End-user ($ million)
Data Table on Market opportunity by End-user ($ million)

11. Customer Landscape

11.1 Customer landscape overview

Analysis of price sensitivity, lifecycle, customer purchase basket, adoption rates, and purchase criteria

12. Geographic Landscape

12.1 Geographic segmentation

Chart on Market share by geography 2025-2030 (%)
Data Table on Market share by geography 2025-2030 (%)

12.2 Geographic comparison

Chart on Geographic comparison
Data Table on Geographic comparison

12.3 North America - Market size and forecast 2025-2030

Chart on North America - Market size and forecast 2025-2030 ($ million)
Data Table on North America - Market size and forecast 2025-2030 ($ million)
Chart on North America - Year-over-year growth 2025-2030 (%)
Data Table on North America - Year-over-year growth 2025-2030 (%)
Chart on Regional Comparison - North America
Data Table on Regional Comparison - North America

12.3.1 US - Market size and forecast 2025-2030

Chart on US - Market size and forecast 2025-2030 ($ million)
Data Table on US - Market size and forecast 2025-2030 ($ million)
Chart on US - Year-over-year growth 2025-2030 (%)
Data Table on US - Year-over-year growth 2025-2030 (%)

12.3.2 Canada - Market size and forecast 2025-2030

Chart on Canada - Market size and forecast 2025-2030 ($ million)
Data Table on Canada - Market size and forecast 2025-2030 ($ million)
Chart on Canada - Year-over-year growth 2025-2030 (%)
Data Table on Canada - Year-over-year growth 2025-2030 (%)

12.3.3 Mexico - Market size and forecast 2025-2030

Chart on Mexico - Market size and forecast 2025-2030 ($ million)
Data Table on Mexico - Market size and forecast 2025-2030 ($ million)
Chart on Mexico - Year-over-year growth 2025-2030 (%)
Data Table on Mexico - Year-over-year growth 2025-2030 (%)

12.4 Europe - Market size and forecast 2025-2030

Chart on Europe - Market size and forecast 2025-2030 ($ million)
Data Table on Europe - Market size and forecast 2025-2030 ($ million)
Chart on Europe - Year-over-year growth 2025-2030 (%)
Data Table on Europe - Year-over-year growth 2025-2030 (%)
Chart on Regional Comparison - Europe
Data Table on Regional Comparison - Europe

12.4.1 Germany - Market size and forecast 2025-2030

Chart on Germany - Market size and forecast 2025-2030 ($ million)
Data Table on Germany - Market size and forecast 2025-2030 ($ million)
Chart on Germany - Year-over-year growth 2025-2030 (%)
Data Table on Germany - Year-over-year growth 2025-2030 (%)

12.4.2 UK - Market size and forecast 2025-2030

Chart on UK - Market size and forecast 2025-2030 ($ million)
Data Table on UK - Market size and forecast 2025-2030 ($ million)
Chart on UK - Year-over-year growth 2025-2030 (%)
Data Table on UK - Year-over-year growth 2025-2030 (%)

12.4.3 France - Market size and forecast 2025-2030

Chart on France - Market size and forecast 2025-2030 ($ million)
Data Table on France - Market size and forecast 2025-2030 ($ million)
Chart on France - Year-over-year growth 2025-2030 (%)
Data Table on France - Year-over-year growth 2025-2030 (%)

12.4.4 Italy - Market size and forecast 2025-2030

Chart on Italy - Market size and forecast 2025-2030 ($ million)
Data Table on Italy - Market size and forecast 2025-2030 ($ million)
Chart on Italy - Year-over-year growth 2025-2030 (%)
Data Table on Italy - Year-over-year growth 2025-2030 (%)

12.4.5 Spain - Market size and forecast 2025-2030

Chart on Spain - Market size and forecast 2025-2030 ($ million)
Data Table on Spain - Market size and forecast 2025-2030 ($ million)
Chart on Spain - Year-over-year growth 2025-2030 (%)
Data Table on Spain - Year-over-year growth 2025-2030 (%)

12.4.6 The Netherlands - Market size and forecast 2025-2030

Chart on The Netherlands - Market size and forecast 2025-2030 ($ million)
Data Table on The Netherlands - Market size and forecast 2025-2030 ($ million)
Chart on The Netherlands - Year-over-year growth 2025-2030 (%)
Data Table on The Netherlands - Year-over-year growth 2025-2030 (%)

12.5 Asia - Market size and forecast 2025-2030

Chart on Asia - Market size and forecast 2025-2030 ($ million)
Data Table on Asia - Market size and forecast 2025-2030 ($ million)
Chart on Asia - Year-over-year growth 2025-2030 (%)
Data Table on Asia - Year-over-year growth 2025-2030 (%)
Chart on Regional Comparison - Asia
Data Table on Regional Comparison - Asia

12.5.1 China - Market size and forecast 2025-2030

Chart on China - Market size and forecast 2025-2030 ($ million)
Data Table on China - Market size and forecast 2025-2030 ($ million)
Chart on China - Year-over-year growth 2025-2030 (%)
Data Table on China - Year-over-year growth 2025-2030 (%)

12.5.2 India - Market size and forecast 2025-2030

Chart on India - Market size and forecast 2025-2030 ($ million)
Data Table on India - Market size and forecast 2025-2030 ($ million)
Chart on India - Year-over-year growth 2025-2030 (%)
Data Table on India - Year-over-year growth 2025-2030 (%)

12.5.3 Japan - Market size and forecast 2025-2030

Chart on Japan - Market size and forecast 2025-2030 ($ million)
Data Table on Japan - Market size and forecast 2025-2030 ($ million)
Chart on Japan - Year-over-year growth 2025-2030 (%)
Data Table on Japan - Year-over-year growth 2025-2030 (%)

12.5.4 South Korea - Market size and forecast 2025-2030

Chart on South Korea - Market size and forecast 2025-2030 ($ million)
Data Table on South Korea - Market size and forecast 2025-2030 ($ million)
Chart on South Korea - Year-over-year growth 2025-2030 (%)
Data Table on South Korea - Year-over-year growth 2025-2030 (%)

12.5.5 Thailand - Market size and forecast 2025-2030

Chart on Thailand - Market size and forecast 2025-2030 ($ million)
Data Table on Thailand - Market size and forecast 2025-2030 ($ million)
Chart on Thailand - Year-over-year growth 2025-2030 (%)
Data Table on Thailand - Year-over-year growth 2025-2030 (%)

12.5.6 Indonesia - Market size and forecast 2025-2030

Chart on Indonesia - Market size and forecast 2025-2030 ($ million)
Data Table on Indonesia - Market size and forecast 2025-2030 ($ million)
Chart on Indonesia - Year-over-year growth 2025-2030 (%)
Data Table on Indonesia - Year-over-year growth 2025-2030 (%)

12.6 Rest of World (ROW) - Market size and forecast 2025-2030

Chart on Rest of World (ROW) - Market size and forecast 2025-2030 ($ million)
Data Table on Rest of World (ROW) - Market size and forecast 2025-2030 ($ million)
Chart on Rest of World (ROW) - Year-over-year growth 2025-2030 (%)
Data Table on Rest of World (ROW) - Year-over-year growth 2025-2030 (%)
Chart on Regional Comparison - Rest of World (ROW)
Data Table on Regional Comparison - Rest of World (ROW)

12.6.1 Brazil - Market size and forecast 2025-2030

Chart on Brazil - Market size and forecast 2025-2030 ($ million)
Data Table on Brazil - Market size and forecast 2025-2030 ($ million)
Chart on Brazil - Year-over-year growth 2025-2030 (%)
Data Table on Brazil - Year-over-year growth 2025-2030 (%)

12.6.2 Saudi Arabia - Market size and forecast 2025-2030

Chart on Saudi Arabia - Market size and forecast 2025-2030 ($ million)
Data Table on Saudi Arabia - Market size and forecast 2025-2030 ($ million)
Chart on Saudi Arabia - Year-over-year growth 2025-2030 (%)
Data Table on Saudi Arabia - Year-over-year growth 2025-2030 (%)

12.6.3 UAE - Market size and forecast 2025-2030

Chart on UAE - Market size and forecast 2025-2030 ($ million)
Data Table on UAE - Market size and forecast 2025-2030 ($ million)
Chart on UAE - Year-over-year growth 2025-2030 (%)
Data Table on UAE - Year-over-year growth 2025-2030 (%)

12.6.4 Turkey - Market size and forecast 2025-2030

Chart on Turkey - Market size and forecast 2025-2030 ($ million)
Data Table on Turkey - Market size and forecast 2025-2030 ($ million)
Chart on Turkey - Year-over-year growth 2025-2030 (%)
Data Table on Turkey - Year-over-year growth 2025-2030 (%)

12.6.5 Argentina - Market size and forecast 2025-2030

Chart on Argentina - Market size and forecast 2025-2030 ($ million)
Data Table on Argentina - Market size and forecast 2025-2030 ($ million)
Chart on Argentina - Year-over-year growth 2025-2030 (%)
Data Table on Argentina - Year-over-year growth 2025-2030 (%)

12.6.6 Colombia - Market size and forecast 2025-2030

Chart on Colombia - Market size and forecast 2025-2030 ($ million)
Data Table on Colombia - Market size and forecast 2025-2030 ($ million)
Chart on Colombia - Year-over-year growth 2025-2030 (%)
Data Table on Colombia - Year-over-year growth 2025-2030 (%)

12.6.7 South Africa - Market size and forecast 2025-2030

Chart on South Africa - Market size and forecast 2025-2030 ($ million)
Data Table on South Africa - Market size and forecast 2025-2030 ($ million)
Chart on South Africa - Year-over-year growth 2025-2030 (%)
Data Table on South Africa - Year-over-year growth 2025-2030 (%)

12.6.8 Israel - Market size and forecast 2025-2030

Chart on Israel - Market size and forecast 2025-2030 ($ million)
Data Table on Israel - Market size and forecast 2025-2030 ($ million)
Chart on Israel - Year-over-year growth 2025-2030 (%)
Data Table on Israel - Year-over-year growth 2025-2030 (%)

12.7 Market opportunity by geography

Market opportunity by geography ($ million)
Data Tables on Market opportunity by geography ($ million)

13. Drivers, Challenges, and Opportunity

13.1 Market drivers

Increasing global burden of infectious and chronic diseases
Pivotal technological advancements in antigen production and design
Heightened global focus on vaccine development and pandemic preparedness

13.2 Market challenges

Navigating complex and evolving regulatory frameworks
Overcoming technical complexity and ensuring batch-to-batch consistency
Managing intense price competition and market saturation in commoditized segments

13.3 Impact of drivers and challenges

Impact of drivers and challenges in 2025 and 2030

13.4 Market opportunities

Shifting role of antigens in era of nucleic acid platforms
Rise of personalized oncology and demand for neoantigens
Expansion of multiplexing in diagnostics and point-of-care testing

14. Competitive Landscape

14.1 Overview

14.2

Overview on criticality of inputs and factors of differentiation

14.3 Landscape disruption

Overview on factors of disruption

14.4 Industry risks

Impact of key risks on business

15. Competitive Analysis

15.1 Companies profiled

Companies covered

15.2 Company ranking index

15.3 Market positioning of companies

Matrix on companies position and classification

15.4 Abcam plc

Abcam plc - Overview
Abcam plc - Product / Service
Abcam plc - Key offerings
SWOT

15.5 Agilent Technologies Inc.

Agilent Technologies Inc. - Overview
Agilent Technologies Inc. - Business segments
Agilent Technologies Inc. - Key news
Agilent Technologies Inc. - Key offerings
Agilent Technologies Inc. - Segment focus
SWOT

15.6 Bio Rad Laboratories Inc.

Bio Rad Laboratories Inc. - Overview
Bio Rad Laboratories Inc. - Business segments
Bio Rad Laboratories Inc. - Key news
Bio Rad Laboratories Inc. - Key offerings
Bio Rad Laboratories Inc. - Segment focus
SWOT

15.7 Bio Techne Corp.

Bio Techne Corp. - Overview
Bio Techne Corp. - Business segments
Bio Techne Corp. - Key offerings
Bio Techne Corp. - Segment focus
SWOT

15.8 Danaher Corp.

Danaher Corp. - Overview
Danaher Corp. - Business segments
Danaher Corp. - Key news
Danaher Corp. - Key offerings
Danaher Corp. - Segment focus
SWOT

15.9 Fapon Biotech

Fapon Biotech - Overview
Fapon Biotech - Product / Service
Fapon Biotech - Key offerings
SWOT

15.10 GenScript Biotech Corp.

GenScript Biotech Corp. - Overview
GenScript Biotech Corp. - Business segments
GenScript Biotech Corp. - Key offerings
GenScript Biotech Corp. - Segment focus
SWOT

15.11 Hologic Inc.

Hologic Inc. - Overview
Hologic Inc. - Product / Service
Hologic Inc. - Key offerings
SWOT

15.12 ImmunoDX LLC

ImmunoDX LLC - Overview
ImmunoDX LLC - Product / Service
ImmunoDX LLC - Key offerings
SWOT

15.13 Merck KGaA

Merck KGaA - Overview
Merck KGaA - Business segments
Merck KGaA - Key news
Merck KGaA - Key offerings
Merck KGaA - Segment focus
SWOT

15.14 RayBiotech Life Inc.

RayBiotech Life Inc. - Overview
RayBiotech Life Inc. - Product / Service
RayBiotech Life Inc. - Key offerings
SWOT

15.15 Siemens Healthineers AG

Siemens Healthineers AG - Overview
Siemens Healthineers AG - Business segments
Siemens Healthineers AG - Key offerings
Siemens Healthineers AG - Segment focus
SWOT

15.16 Sino Biological Inc.

Sino Biological Inc. - Overview
Sino Biological Inc. - Product / Service
Sino Biological Inc. - Key offerings
SWOT

15.17 Sysmex Corp.

Sysmex Corp. - Overview
Sysmex Corp. - Business segments
Sysmex Corp. - Key offerings
Sysmex Corp. - Segment focus
SWOT

15.18 Thermo Fisher Scientific Inc.

Thermo Fisher Scientific Inc. - Overview
Thermo Fisher Scientific Inc. - Business segments
Thermo Fisher Scientific Inc. - Key news
Thermo Fisher Scientific Inc. - Key offerings
Thermo Fisher Scientific Inc. - Segment focus
SWOT

16. Appendix

16.1 Scope of the report

Market definition
Objectives
Notes and caveats

16.2 Inclusions and exclusions checklist

Inclusions checklist
Exclusions checklist

16.3 Currency conversion rates for US$

16.4 Research methodology

16.5 Data procurement

Information sources

16.6 Data validation

16.7 Validation techniques employed for market sizing

16.8 Data synthesis

16.9 360 degree market analysis

16.10 List of abbreviations

Research Methodology

Technavio presents a detailed picture of the market by way of study, synthesis, and summation of data from multiple sources. The analysts have presented the various facets of the market with a particular focus on identifying the key industry influencers. The data thus presented is comprehensive, reliable, and the result of extensive research, both primary and secondary.

INFORMATION SOURCES

Primary sources

  • Manufacturers and suppliers
  • Channel partners
  • Industry experts
  • Strategic decision makers

Secondary sources

  • Industry journals and periodicals
  • Government data
  • Financial reports of key industry players
  • Historical data
  • Press releases

DATA ANALYSIS

Data Synthesis

  • Collation of data
  • Estimation of key figures
  • Analysis of derived insights

Data Validation

  • Triangulation with data models
  • Reference against proprietary databases
  • Corroboration with industry experts

REPORT WRITING

Qualitative

  • Market drivers
  • Market challenges
  • Market trends
  • Five forces analysis

Quantitative

  • Market size and forecast
  • Market segmentation
  • Geographical insights
  • Competitive landscape

Interested in this report?

Get your sample now to see our research methodology and insights!

Download Now

Frequently Asked Questions

Antigen market growth will increase by USD 694.6 million during 2026-2030.

The Antigen market is expected to grow at a CAGR of 8.1% during 2026-2030.

Antigen market is segmented by Type (Viral antigens, Bacterial antigens, Others) Application (Medical diagnostic, Vaccine development, Others) End-user (Manufacturers, Diagnostic centers, Hospitals, Research institutes)

Abcam plc, Agilent Technologies Inc., Bio Rad Laboratories Inc., Bio Techne Corp., BioMerieux SA, Creative Diagnostics, Danaher Corp., DiaSorin SpA, Fapon Biotech, GenScript Biotech Corp., Hologic Inc., ImmunoDX LLC, LGC Ltd., Merck KGaA, RayBiotech Life Inc., Sd Biosensor Inc., Siemens Healthineers AG, Sino Biological Inc., Sysmex Corp., Thermo Fisher Scientific Inc. are a few of the key vendors in the Antigen market.

North America will register the highest growth rate of 31.7% among the other regions. Therefore, the Antigen market in North America is expected to garner significant business opportunities for the vendors during the forecast period.

US, Canada, Mexico, Germany, UK, France, Italy, Spain, The Netherlands, China, India, Japan, South Korea, Thailand, Indonesia, Brazil, Saudi Arabia, UAE, Turkey, Argentina, Colombia, South Africa, Israel

  • Increasing global burden of infectious and chronic diseases is the driving factor this market.

The Antigen market vendors should focus on grabbing business opportunities from the Type segment as it accounted for the largest market share in the base year.
RIA - Research AI Assistant
Ask RIA