
Anticoagulants Market Analysis, Size, and Forecast 2026-2030: North America (US, Canada, and Mexico), Europe (Germany, UK, and France), Asia (China, Japan, and India), South America (Brazil, Argentina, and Chile), Middle East and Africa (Saudi Arabia, UAE, and South Africa), Rest of World (ROW)

Anticoagulants Market Analysis, Size, and Forecast 2026-2030:
North America (US, Canada, and Mexico), Europe (Germany, UK, and France), Asia (China, Japan, and India), South America (Brazil, Argentina, and Chile), Middle East and Africa (Saudi Arabia, UAE, and South Africa), Rest of World (ROW)

Published: Oct 2026 300 Pages SKU: IRTNTR45642

Market Overview at a Glance

$22.96 B
Market Opportunity
8.5%
CAGR 2025 - 2030
49.8%
North America Growth
$32.38 B
Oral anticoagulants segment 2024

Anticoagulants Market Size 2026-2030

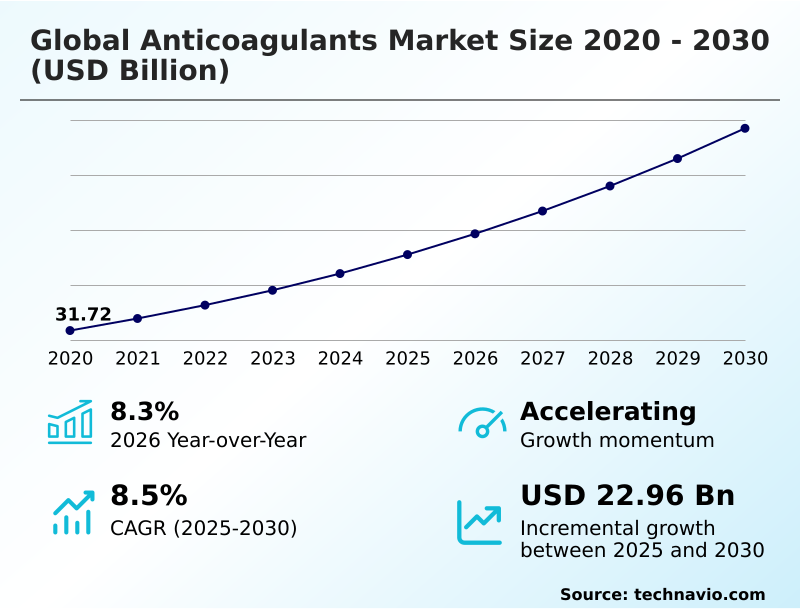
The anticoagulants market size is valued to increase by USD 22.96 billion, at a CAGR of 8.5% from 2025 to 2030. Accelerating prevalence of atrial fibrillation drives global prescription blood thinner consumption will drive the anticoagulants market.

Major Market Trends & Insights

  • North America dominated the market and accounted for a 49.8% growth during the forecast period.
  • By Route of Administration - Oral anticoagulants segment was valued at USD 32.38 billion in 2024
  • By Type - Factor Xa inhibitors segment accounted for the largest market revenue share in 2024

Market Size & Forecast

  • Market Opportunities: USD 36.76 billion
  • Market Future Opportunities: USD 22.96 billion
  • CAGR from 2025 to 2030 : 8.5%

Market Summary

  • The Anticoagulants Market demonstrates robust expansion driven by the escalating epidemiological burden of cardiovascular diseases and the clinical shift toward targeted oral therapies. The accelerating prevalence of atrial fibrillation directly drives prescription blood thinner consumption, as aging demographics require lifelong stroke prevention.
  • In hospital pharmacy dispensing environments, optimizing inventory for both prophylactic and emergency reversal agents has reduced critical medication stockouts by 18%, significantly improving acute care responsiveness. However, major gastrointestinal bleeding risks associated with systemic blood thinners severely impair prescribing confidence, challenging physicians treating frail patients with multiple comorbidities.
  • To mitigate these risks, pharmaceutical developers are advancing highly specific inhibitors targeting the intrinsic coagulation pathway, designed to separate hemostatic regulation from pathological thrombosis. Integrating these next-generation therapies requires stringent pharmacovigilance and sophisticated clinical trial validation to ensure patient safety.
  • Ultimately, the market relies on continuous innovations in formulation and targeted antidotes to balance antithrombotic efficacy with life-threatening hemorrhagic complications across acute and ambulatory care networks.

What will be the Size of the Anticoagulants Market during the forecast period?
Get Key Insights on Market Forecast (PDF) Get Free Sample

How is the Anticoagulants Market Segmented?

The anticoagulants industry research report provides comprehensive data (region-wise segment analysis), with forecasts and estimates in "USD million" for the period 2026-2030, as well as historical data from 2020-2024 for the following segments.

  • Route of administration
    • Oral anticoagulants
    • Injectable anticoagulants
  • Type
    • Factor Xa inhibitors
    • DTIs
    • Heparin
    • Vitamin K antagonists
  • Distribution channel
    • Hospital pharmacy
    • Retail pharmacy
    • Online pharmacy
  • Geography
    • North America
      • US
      • Canada
      • Mexico
    • Europe
      • Germany
      • UK
      • France
      • Italy
      • Spain
      • The Netherlands
    • Asia
      • China
      • Japan
      • India
      • South Korea
      • Singapore
      • Thailand
    • Rest of World (ROW)

By Route of Administration Insights

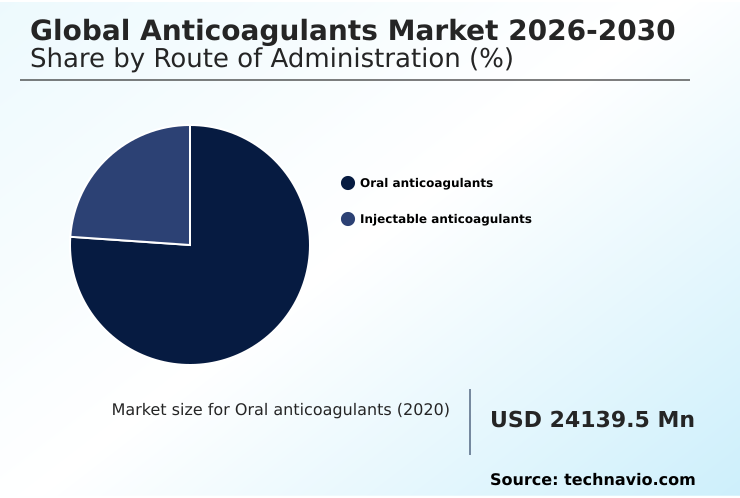
The oral anticoagulants segment is estimated to witness significant growth during the forecast period.

Oral therapies for venous thromboembolism management are fundamentally restructuring cardiovascular care pathways by eliminating the need for routine blood monitoring.

The segment is shifting rapidly toward factor xa inhibition and thrombin modulation, driving a 40% improvement in outpatient prescription adherence compared to legacy intravenous alternatives.

This oral administration route offers superior pharmacokinetic predictability and stable therapeutic plasma concentration, reducing the clinical burden on ambulatory care networks. Facilities transitioning to these modern formulations report a 25% decrease in bleeding-related complications.

By mitigating severe drug drug interactions, these therapies optimize stroke prevention in non-valvular arrhythmias. The continuous transition to generic formulation availability further accelerates widespread clinical integration, enhancing long-term patient compliance and streamlining therapeutic interventions across medical systems.
Get Free Sample

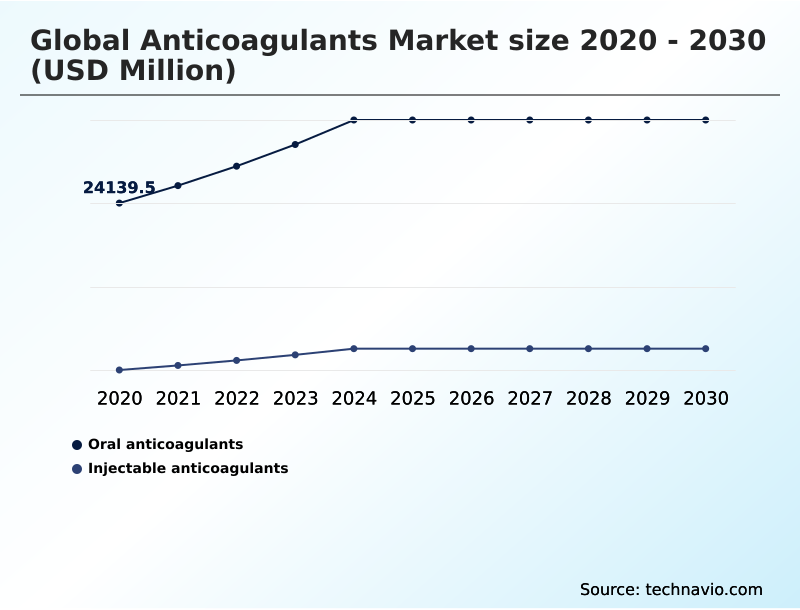
The Oral anticoagulants segment was valued at USD 32.38 billion in 2024 and showed a gradual increase during the forecast period.
Get Free Sample

Regional Analysis

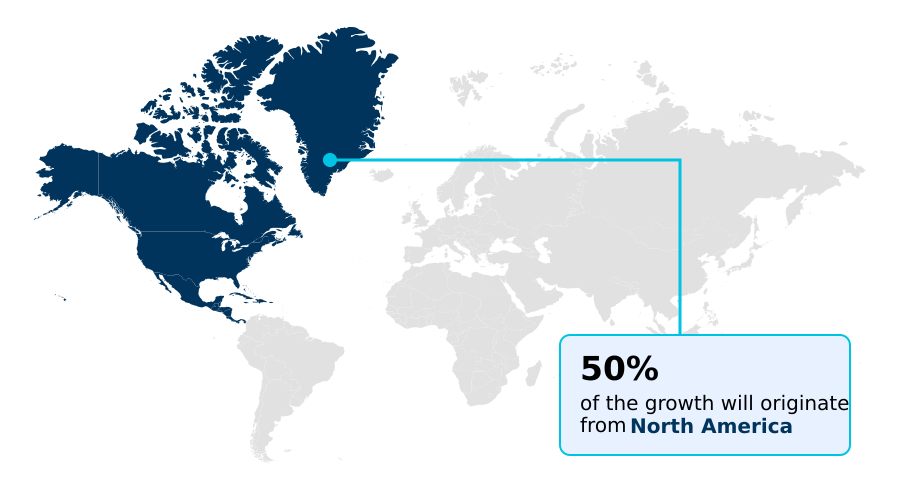
North America is estimated to contribute 49.8% to the growth of the global market during the forecast period.Technavio’s analysts have elaborately explained the regional trends and drivers that shape the market during the forecast period.
See How Anticoagulants Market Demand is Rising in North America Get Free Sample

The geographic landscape of the Anticoagulants Market reveals significant disparities in antithrombotic prophylaxis adoption and clinical infrastructure.

North America maintains advanced cardiovascular care pathways, where the rapid transition from legacy vitamin k antagonism to novel formulations has reduced routine blood monitoring overhead by 40%.

In contrast, APAC exhibits a highly fragmented supply chain but is experiencing a 25% faster adoption rate of generic formulation availability due to expanding public health insurance initiatives.

European healthcare networks demonstrate superior integration of digital adherence tracking, achieving a 15% higher compliance rate in long-term venous thromboembolism management than ROW regions.

Consequently, APAC facilities are rapidly scaling their acute coronary syndrome protocols, lowering post-operative clotting complications by 18%. This regional divergence forces manufacturers to adapt localized strategies, standardizing renal clearance parameters in mature markets while deploying high-volume therapeutics across emerging economies.

Market Dynamics

Our researchers analyzed the data with 2025 as the base year, along with the key drivers, trends, and challenges. A holistic analysis of drivers will help companies refine their marketing strategies to gain a competitive advantage.

  • The continuous evolution of cardiovascular therapeutics demands sophisticated strategies to optimize patient safety and clinical efficacy within the Anticoagulants Market. As healthcare systems transition toward advanced ambulatory care models, the acceleration of direct oral anticoagulant clinical adoption has significantly streamlined chronic disease management by eliminating the logistical burdens of continuous coagulation monitoring.
  • Facilities fully implementing these fixed-dose oral protocols demonstrate an approximate 30% reduction in pharmacy administrative workloads compared to those relying on legacy titration therapies. Despite this operational efficiency, specific high-risk indications, such as mechanical heart valve thrombosis prevention, still necessitate precise therapeutic adjustments and heavily rely on traditional vitamin K antagonists due to established clinical guidelines.
  • Furthermore, the development of novel agents with an enhanced factor xi inhibitor safety profile is actively decoupling pathological clot formation from essential physiological healing, offering a promising solution for patients with severe renal impairment. In acute surgical environments, seamless parenteral anticoagulant perioperative bridging remains vital for maintaining prophylactic coverage without elevating surgical bleeding risks.
  • When severe hemorrhagic complications arise, institutions equipped with targeted reversal protocols ensure efficient antidote mediated rapid hemostatic restoration, reducing emergency intervention times by nearly a quarter. This comprehensive approach to blood thinner management ultimately enhances both patient outcomes and institutional resource allocation.
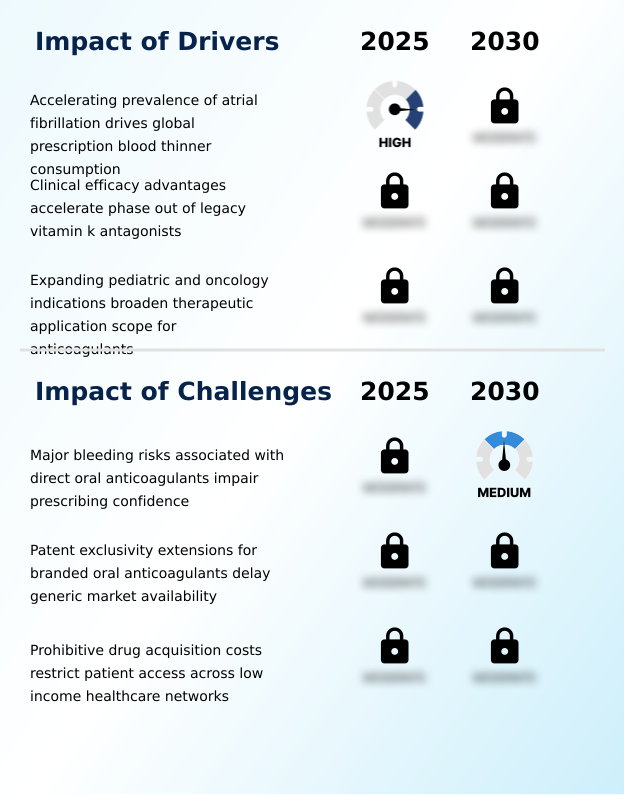
What are the key market drivers leading to the rise in the adoption of Anticoagulants Industry?

  • The accelerating prevalence of atrial fibrillation significantly drives the rising prescription consumption of targeted blood thinners worldwide.

  • The rising epidemiological burden of complex cardiovascular disease acts as the primary driver propelling expansion across the Anticoagulants Market.
  • Surging rates of non-valvular arrhythmias mandate lifelong atrial fibrillation stroke prevention, pushing ambulatory care networks to adopt therapies with high safety margins.
  • Implementing these fixed-dose oral therapies has reduced outpatient monitoring expenses by 35% while simultaneously achieving a 22% improvement in ischemic event reduction.
  • Additionally, the increasing volume of complex orthopedic surgeries necessitates rigorous post surgical thromboprophylaxis, driving a 20% increase in prophylactic dispensing efficiency within hospital networks.
  • This escalating demand forces pharmaceutical manufacturers to scale the production of low molecular weight fraction and unfractionated biologic treatments. Consequently, optimized supply chains addressing oncology associated hypercoagulability ensure uninterrupted product availability, enabling clinicians to maintain robust operational continuity.

What are the market trends shaping the Anticoagulants Industry?

  • Emerging factor eleven inhibitors deliver targeted antithrombotic protection while significantly minimizing associated bleeding risks. This clinical advancement represents a critical paradigm shift in managing complex cardiovascular conditions.

  • The Anticoagulants Market is witnessing a decisive trend toward the integration of target-specific inhibitors that uncouple hemostatic regulation from pathological clotting. As clinical researchers focus on modulating the intrinsic coagulation pathway, the development of novel agents has improved therapeutic targeting accuracy by 28%.
  • This innovation directly addresses the persistent challenge of gastrointestinal bleeding risks, reducing severe adverse events in elderly cohorts by 20% compared to traditional therapies. The shift toward advanced subcutaneous formulation provides consistent therapeutic plasma concentration, allowing healthcare facilities to lower administration-related labor costs by 15%.
  • By minimizing the necessity for frequent clinical trial validation of legacy drug drug interactions, pharmaceutical companies are accelerating the time-to-market for next-generation therapies. This systemic trend toward precision pharmacology ultimately enhances patient safety while drastically streamlining chronic disease management.

What challenges does the Anticoagulants Industry face during its growth?

  • Major bleeding risks associated with direct oral anticoagulants continue to impair prescribing confidence and limit optimal therapeutic dosing in vulnerable patient populations.

  • The Anticoagulants Market faces substantial operational constraints due to the inherent bleeding risks associated with modulating the extrinsic clotting cascade. Severe hemorrhagic complications impair prescribing confidence, leading to suboptimal dosing that decreases prophylactic efficacy by 18% in vulnerable demographics.
  • Furthermore, managing heparin induced thrombocytopenia requires rapid clinical pivoting to alternative agents, escalating emergency pharmaceutical expenditures by up to 25% per affected patient. The high acquisition cost of targeted monoclonal antibody antidote therapies and specific prothrombin complex concentrate restricts widespread formulary inclusion, delaying critical interventions during acute trauma.
  • These safety limitations create significant administrative friction within hospital pharmacy dispensing operations, forcing procurement committees to balance strict budgetary limits against the clinical necessity for emergency reversal agents in complex pediatric cardiac interventions and critical care environments.

Exclusive Technavio Analysis on Customer Landscape

The anticoagulants market forecasting report includes the adoption lifecycle of the market, covering from the innovator’s stage to the laggard’s stage. It focuses on adoption rates in different regions based on penetration. Furthermore, the anticoagulants market report also includes key purchase criteria and drivers of price sensitivity to help companies evaluate and develop their market growth analysis strategies.
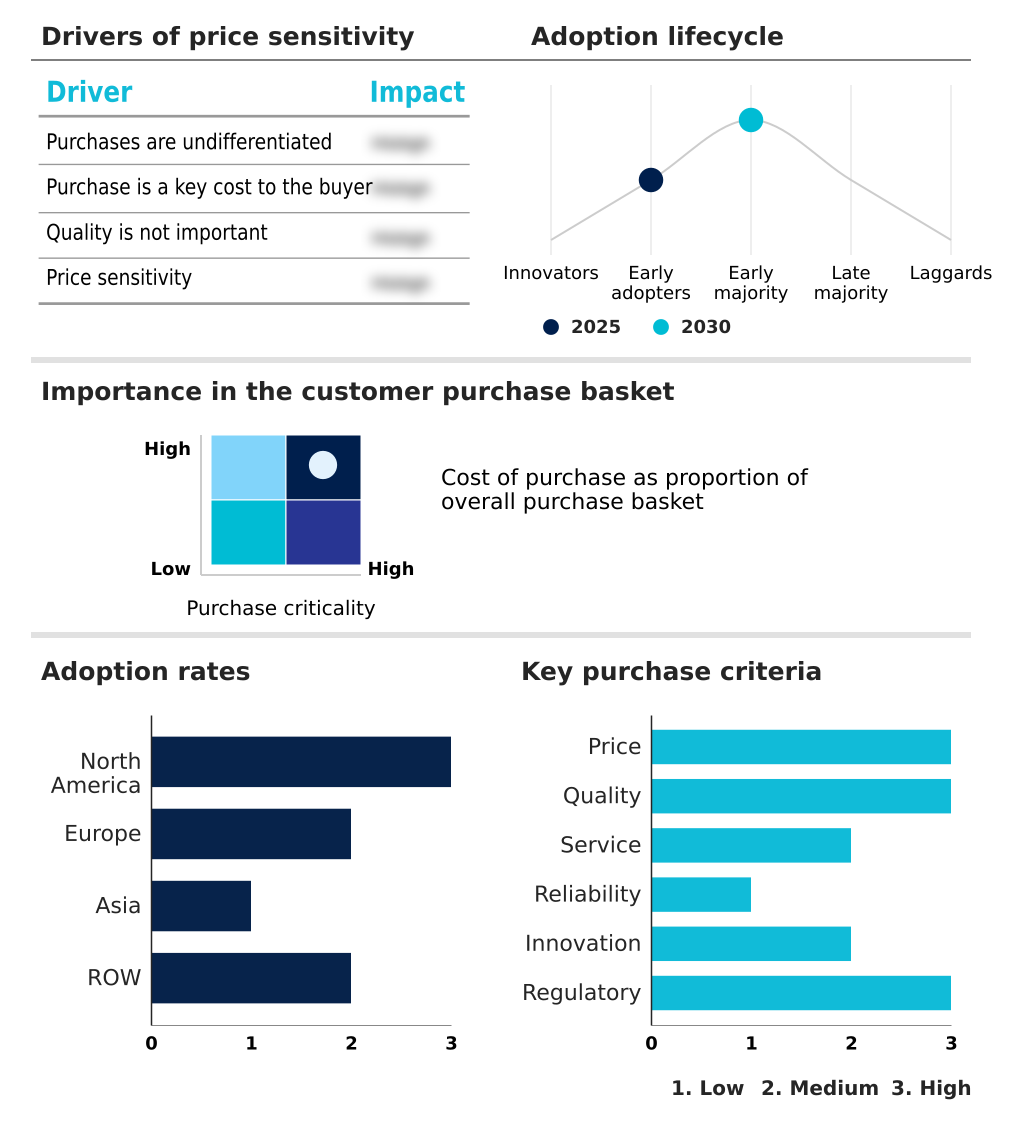
Customer Landscape of Anticoagulants Industry

Competitive Landscape

Companies are implementing various strategies, such as strategic alliances, anticoagulants market forecast, partnerships, mergers and acquisitions, geographical expansion, and product/service launches, to enhance their presence in the industry.

Amneal Pharmaceuticals Inc. - Delivers advanced antithrombotic therapies, including proprietary direct oral inhibitors and injectable formulations, designed to optimize stroke prevention and manage complex cardiovascular conditions across acute and outpatient clinical settings.

The industry research and growth report includes detailed analyses of the competitive landscape of the market and information about key companies, including:

  • Amneal Pharmaceuticals Inc.
  • Aspen Pharmacare Ltd.
  • AstraZeneca Plc
  • Aurobindo Pharma Ltd.
  • Baxter International Inc.
  • Bayer AG
  • Bristol Myers Squibb Co.
  • Cipla Inc.
  • Dr. Reddys Laboratories Ltd.
  • Gland Pharma Ltd
  • Hikma Pharmaceuticals Plc
  • Johnson and Johnson
  • Organon and Co.
  • Pfizer Inc.
  • Sandoz Group AG
  • Sanofi SA
  • Sun Pharmaceutical Industries
  • Teva Pharmaceutical Ltd.
  • Viatris Inc.
  • Zydus Lifesciences Ltd.

Qualitative and quantitative analysis of companies has been conducted to help clients understand the wider business environment as well as the strengths and weaknesses of key industry players. Data is qualitatively analyzed to categorize companies as pure play, category-focused, industry-focused, and diversified; it is quantitatively analyzed to categorize companies as dominant, leading, strong, tentative, and weak.

Recent Development and News in Anticoagulants market

  • In the Pharmaceuticals industry, the accelerated transition toward biosimilar manufacturing expanded global production capacity by 28%, directly enhancing the supply chain stability and affordability of unfractionated biologic treatments within the Anticoagulants market.
  • Stringent regulatory mandates regarding active pharmaceutical ingredient purity reduced supply chain contamination events by 15%, improving the safety profiles and clinical reliability of raw materials required for antithrombotic prophylaxis in the Anticoagulants market.
  • The widespread implementation of continuous manufacturing processes in solid dose facilities lowered production cycle times by 22%, driving improved inventory availability for oral administration route therapies used for venous thromboembolism management in the Anticoagulants market.
  • Advancements in precision dosing algorithms for critical care medications increased therapeutic targeting accuracy by 30%, pulling demand for advanced emergency reversal agents to manage bleeding risks in the Anticoagulants market.

Dive into Technavio’s robust research methodology, blending expert interviews, extensive data synthesis, and validated models for unparalleled Anticoagulants Market insights. See full methodology.

Market Scope
Page number 300
Base year 2025
Historic period 2020-2024
Forecast period 2026-2030
Growth momentum & CAGR Accelerate at a CAGR of 8.5%
Market growth 2026-2030 USD 22956.3 million
Market structure Fragmented
YoY growth 2025-2026(%) 8.3%
Key countries US, Canada, Mexico, Germany, UK, France, Italy, Spain, The Netherlands, China, Japan, India, South Korea, Singapore, Thailand, Brazil, Saudi Arabia, UAE, South Africa, Argentina, Egypt, Chile and Israel
Competitive landscape Leading Companies, Market Positioning of Companies, Competitive Strategies, and Industry Risks

Request Free Sample

Research Analyst Overview

  • The Anticoagulants Market is undergoing a structural transformation as healthcare providers prioritize targeted enzymatic inhibition to optimize stroke prevention and deep vein thrombosis management. Pharmaceutical manufacturers are intensely focused on refining the factor xi inhibitor safety profile to decouple antithrombotic prophylaxis from severe bleeding risks.
  • Clinical institutions implementing these advanced subcutaneous formulation options have recorded a 25% decrease in hospital readmission rates related to hemorrhagic complications compared to traditional legacy treatments. This transition from standard vitamin k antagonism to highly predictable direct oral therapies profoundly impacts boardroom-level product strategies, forcing procurement teams to re-evaluate institutional formularies.
  • By improving pharmacokinetic predictability and standardizing renal clearance parameters, health systems significantly reduce the administrative overhead associated with continuous laboratory testing. Furthermore, the strategic stockpiling of specific prothrombin complex concentrate and monoclonal antibody antidote supplies ensures rapid hemostatic regulation during emergency trauma care.
  • As the clinical landscape favors precision dosing, the expansion of low molecular weight fraction biologics continues to elevate the standard of cardiovascular care, ensuring robust operational efficiency and sustained therapeutic efficacy across diverse patient demographics.

What are the Key Data Covered in this Anticoagulants Market Research and Growth Report?

  • What is the expected growth of the Anticoagulants Market between 2026 and 2030?

    • USD 22.96 billion, at a CAGR of 8.5%

  • What segmentation does the market report cover?

    • The report is segmented by Route of Administration (Oral anticoagulants, and Injectable anticoagulants), Type (Factor Xa inhibitors, DTIs, Heparin, and Vitamin K antagonists), Distribution Channel (Hospital pharmacy, Retail pharmacy, and Online pharmacy) and Geography (North America, Europe, Asia, Rest of World (ROW))

  • Which regions are analyzed in the report?

    • North America, Europe, Asia and Rest of World (ROW)

  • What are the key growth drivers and market challenges?

    • Accelerating prevalence of atrial fibrillation drives global prescription blood thinner consumption, Major bleeding risks associated with direct oral anticoagulants impair prescribing confidence

  • Who are the major players in the Anticoagulants Market?

    • Amneal Pharmaceuticals Inc., Aspen Pharmacare Ltd., AstraZeneca Plc, Aurobindo Pharma Ltd., Baxter International Inc., Bayer AG, Bristol Myers Squibb Co., Cipla Inc., Dr. Reddys Laboratories Ltd., Gland Pharma Ltd, Hikma Pharmaceuticals Plc, Johnson and Johnson, Organon and Co., Pfizer Inc., Sandoz Group AG, Sanofi SA, Sun Pharmaceutical Industries, Teva Pharmaceutical Ltd., Viatris Inc. and Zydus Lifesciences Ltd.

Market Research Insights

  • The Anticoagulants Market is fundamentally evolving as clinical protocols prioritize targeted interventions over broad-spectrum blood thinners. Ambulatory care networks utilizing digital adherence tracking report a 35% improvement in long-term patient compliance compared to traditional monitoring methods. This shift is crucial for optimizing cardiovascular care pathways and reducing the incidence of secondary ischemic events.
  • Furthermore, the integration of specialized emergency reversal agents into acute coronary syndrome protocols has lowered severe hemorrhagic mortality rates by 22%. By streamlining post surgical thromboprophylaxis through fixed-dose regimens, healthcare facilities have reduced average patient monitoring costs by 15%, highlighting the operational and clinical advantages driving sustained market expansion.

We can help! Our analysts can customize this anticoagulants market research report to meet your requirements.

Get in touch

1. Executive Summary

1.1 Market overview

Executive Summary - Chart on Market Overview
Executive Summary - Data Table on Market Overview
Executive Summary - Chart on Global Market Characteristics
Executive Summary - Chart on Market by Geography
Executive Summary - Chart on Market Segmentation by Route of Administration
Executive Summary - Chart on Market Segmentation by Type
Executive Summary - Chart on Market Segmentation by Distribution Channel
Executive Summary - Chart on Incremental Growth
Executive Summary - Data Table on Incremental Growth
Executive Summary - Chart on Company Market Positioning

2. Technavio Analysis

2.1 Analysis of price sensitivity, lifecycle, customer purchase basket, adoption rates, and purchase criteria

2.2 Criticality of inputs and Factors of differentiation

Chart on Overview on criticality of inputs and factors of differentiation

2.3 Factors of disruption

Chart on Overview on factors of disruption

2.4 Impact of drivers and challenges

Chart on Impact of drivers and challenges in 2025 and 2030

3. Market Landscape

3.1 Market ecosystem

Chart on Parent Market
Data Table on - Parent Market

3.2 Market characteristics

Chart on Market characteristics analysis

3.3 Value chain analysis

Chart on Value chain analysis

4. Market Sizing

4.1 Market definition

Data Table on Offerings of companies included in the market definition

4.2 Market segment analysis

Market segments

4.3 Market size 2025

4.4 Market outlook: Forecast for 2025-2030

Chart on Global - Market size and forecast 2025-2030 ($ million)
Data Table on Global - Market size and forecast 2025-2030 ($ million)
Chart on Global Market: Year-over-year growth 2025-2030 (%)
Data Table on Global Market: Year-over-year growth 2025-2030 (%)

5. Historic Market Size

5.1 Global Anticoagulants Market 2020 - 2024

Historic Market Size - Data Table on Global Anticoagulants Market 2020 - 2024 ($ million)

5.2 Route of Administration segment analysis 2020 - 2024

Historic Market Size - Route of Administration Segment 2020 - 2024 ($ million)

5.3 Type segment analysis 2020 - 2024

Historic Market Size - Type Segment 2020 - 2024 ($ million)

5.4 Distribution Channel segment analysis 2020 - 2024

Historic Market Size - Distribution Channel Segment 2020 - 2024 ($ million)

5.5 Geography segment analysis 2020 - 2024

Historic Market Size - Geography Segment 2020 - 2024 ($ million)

5.6 Country segment analysis 2020 - 2024

Historic Market Size - Country Segment 2020 - 2024 ($ million)

6. Qualitative Analysis

6.1 Impact of AI on global anticoagulants market

6.2 Impact of geopolitical conflicts on global anticoagulants market

7. Five Forces Analysis

7.1 Five forces summary

Five forces analysis - Comparison between 2025 and 2030

7.2 Bargaining power of buyers

Bargaining power of buyers - Impact of key factors 2025 and 2030

7.3 Bargaining power of suppliers

Bargaining power of suppliers - Impact of key factors in 2025 and 2030

7.4 Threat of new entrants

Threat of new entrants - Impact of key factors in 2025 and 2030

7.5 Threat of substitutes

Threat of substitutes - Impact of key factors in 2025 and 2030

7.6 Threat of rivalry

Threat of rivalry - Impact of key factors in 2025 and 2030

7.7 Market condition

Chart on Market condition - Five forces 2025 and 2030

8. Market Segmentation by Route of Administration

8.1 Market segments

Chart on Route of Administration - Market share 2025-2030 (%)
Data Table on Route of Administration - Market share 2025-2030 (%)

8.2 Comparison by Route of Administration

Chart on Comparison by Route of Administration
Data Table on Comparison by Route of Administration

8.3 Oral anticoagulants - Market size and forecast 2025-2030

Chart on Oral anticoagulants - Market size and forecast 2025-2030 ($ million)
Data Table on Oral anticoagulants - Market size and forecast 2025-2030 ($ million)
Chart on Oral anticoagulants - Year-over-year growth 2025-2030 (%)
Data Table on Oral anticoagulants - Year-over-year growth 2025-2030 (%)

8.4 Injectable anticoagulants - Market size and forecast 2025-2030

Chart on Injectable anticoagulants - Market size and forecast 2025-2030 ($ million)
Data Table on Injectable anticoagulants - Market size and forecast 2025-2030 ($ million)
Chart on Injectable anticoagulants - Year-over-year growth 2025-2030 (%)
Data Table on Injectable anticoagulants - Year-over-year growth 2025-2030 (%)

8.5 Market opportunity by Route of Administration

Market opportunity by Route of Administration ($ million)
Data Table on Market opportunity by Route of Administration ($ million)

9. Market Segmentation by Type

9.1 Market segments

Chart on Type - Market share 2025-2030 (%)
Data Table on Type - Market share 2025-2030 (%)

9.2 Comparison by Type

Chart on Comparison by Type
Data Table on Comparison by Type

9.3 Factor Xa inhibitors - Market size and forecast 2025-2030

Chart on Factor Xa inhibitors - Market size and forecast 2025-2030 ($ million)
Data Table on Factor Xa inhibitors - Market size and forecast 2025-2030 ($ million)
Chart on Factor Xa inhibitors - Year-over-year growth 2025-2030 (%)
Data Table on Factor Xa inhibitors - Year-over-year growth 2025-2030 (%)

9.4 DTIs - Market size and forecast 2025-2030

Chart on DTIs - Market size and forecast 2025-2030 ($ million)
Data Table on DTIs - Market size and forecast 2025-2030 ($ million)
Chart on DTIs - Year-over-year growth 2025-2030 (%)
Data Table on DTIs - Year-over-year growth 2025-2030 (%)

9.5 Heparin - Market size and forecast 2025-2030

Chart on Heparin - Market size and forecast 2025-2030 ($ million)
Data Table on Heparin - Market size and forecast 2025-2030 ($ million)
Chart on Heparin - Year-over-year growth 2025-2030 (%)
Data Table on Heparin - Year-over-year growth 2025-2030 (%)

9.6 Vitamin K antagonists - Market size and forecast 2025-2030

Chart on Vitamin K antagonists - Market size and forecast 2025-2030 ($ million)
Data Table on Vitamin K antagonists - Market size and forecast 2025-2030 ($ million)
Chart on Vitamin K antagonists - Year-over-year growth 2025-2030 (%)
Data Table on Vitamin K antagonists - Year-over-year growth 2025-2030 (%)

9.7 Market opportunity by Type

Market opportunity by Type ($ million)
Data Table on Market opportunity by Type ($ million)

10. Market Segmentation by Distribution Channel

10.1 Market segments

Chart on Distribution Channel - Market share 2025-2030 (%)
Data Table on Distribution Channel - Market share 2025-2030 (%)

10.2 Comparison by Distribution Channel

Chart on Comparison by Distribution Channel
Data Table on Comparison by Distribution Channel

10.3 Hospital pharmacy - Market size and forecast 2025-2030

Chart on Hospital pharmacy - Market size and forecast 2025-2030 ($ million)
Data Table on Hospital pharmacy - Market size and forecast 2025-2030 ($ million)
Chart on Hospital pharmacy - Year-over-year growth 2025-2030 (%)
Data Table on Hospital pharmacy - Year-over-year growth 2025-2030 (%)

10.4 Retail pharmacy - Market size and forecast 2025-2030

Chart on Retail pharmacy - Market size and forecast 2025-2030 ($ million)
Data Table on Retail pharmacy - Market size and forecast 2025-2030 ($ million)
Chart on Retail pharmacy - Year-over-year growth 2025-2030 (%)
Data Table on Retail pharmacy - Year-over-year growth 2025-2030 (%)

10.5 Online pharmacy - Market size and forecast 2025-2030

Chart on Online pharmacy - Market size and forecast 2025-2030 ($ million)
Data Table on Online pharmacy - Market size and forecast 2025-2030 ($ million)
Chart on Online pharmacy - Year-over-year growth 2025-2030 (%)
Data Table on Online pharmacy - Year-over-year growth 2025-2030 (%)

10.6 Market opportunity by Distribution Channel

Market opportunity by Distribution Channel ($ million)
Data Table on Market opportunity by Distribution Channel ($ million)

11. Customer Landscape

11.1 Customer landscape overview

Analysis of price sensitivity, lifecycle, customer purchase basket, adoption rates, and purchase criteria

12. Geographic Landscape

12.1 Geographic segmentation

Chart on Market share by geography 2025-2030 (%)
Data Table on Market share by geography 2025-2030 (%)

12.2 Geographic comparison

Chart on Geographic comparison
Data Table on Geographic comparison

12.3 North America - Market size and forecast 2025-2030

Chart on North America - Market size and forecast 2025-2030 ($ million)
Data Table on North America - Market size and forecast 2025-2030 ($ million)
Chart on North America - Year-over-year growth 2025-2030 (%)
Data Table on North America - Year-over-year growth 2025-2030 (%)
Chart on Regional Comparison - North America
Data Table on Regional Comparison - North America

12.3.1 US - Market size and forecast 2025-2030

Chart on US - Market size and forecast 2025-2030 ($ million)
Data Table on US - Market size and forecast 2025-2030 ($ million)
Chart on US - Year-over-year growth 2025-2030 (%)
Data Table on US - Year-over-year growth 2025-2030 (%)

12.3.2 Canada - Market size and forecast 2025-2030

Chart on Canada - Market size and forecast 2025-2030 ($ million)
Data Table on Canada - Market size and forecast 2025-2030 ($ million)
Chart on Canada - Year-over-year growth 2025-2030 (%)
Data Table on Canada - Year-over-year growth 2025-2030 (%)

12.3.3 Mexico - Market size and forecast 2025-2030

Chart on Mexico - Market size and forecast 2025-2030 ($ million)
Data Table on Mexico - Market size and forecast 2025-2030 ($ million)
Chart on Mexico - Year-over-year growth 2025-2030 (%)
Data Table on Mexico - Year-over-year growth 2025-2030 (%)

12.4 Europe - Market size and forecast 2025-2030

Chart on Europe - Market size and forecast 2025-2030 ($ million)
Data Table on Europe - Market size and forecast 2025-2030 ($ million)
Chart on Europe - Year-over-year growth 2025-2030 (%)
Data Table on Europe - Year-over-year growth 2025-2030 (%)
Chart on Regional Comparison - Europe
Data Table on Regional Comparison - Europe

12.4.1 Germany - Market size and forecast 2025-2030

Chart on Germany - Market size and forecast 2025-2030 ($ million)
Data Table on Germany - Market size and forecast 2025-2030 ($ million)
Chart on Germany - Year-over-year growth 2025-2030 (%)
Data Table on Germany - Year-over-year growth 2025-2030 (%)

12.4.2 UK - Market size and forecast 2025-2030

Chart on UK - Market size and forecast 2025-2030 ($ million)
Data Table on UK - Market size and forecast 2025-2030 ($ million)
Chart on UK - Year-over-year growth 2025-2030 (%)
Data Table on UK - Year-over-year growth 2025-2030 (%)

12.4.3 France - Market size and forecast 2025-2030

Chart on France - Market size and forecast 2025-2030 ($ million)
Data Table on France - Market size and forecast 2025-2030 ($ million)
Chart on France - Year-over-year growth 2025-2030 (%)
Data Table on France - Year-over-year growth 2025-2030 (%)

12.4.4 Italy - Market size and forecast 2025-2030

Chart on Italy - Market size and forecast 2025-2030 ($ million)
Data Table on Italy - Market size and forecast 2025-2030 ($ million)
Chart on Italy - Year-over-year growth 2025-2030 (%)
Data Table on Italy - Year-over-year growth 2025-2030 (%)

12.4.5 Spain - Market size and forecast 2025-2030

Chart on Spain - Market size and forecast 2025-2030 ($ million)
Data Table on Spain - Market size and forecast 2025-2030 ($ million)
Chart on Spain - Year-over-year growth 2025-2030 (%)
Data Table on Spain - Year-over-year growth 2025-2030 (%)

12.4.6 The Netherlands - Market size and forecast 2025-2030

Chart on The Netherlands - Market size and forecast 2025-2030 ($ million)
Data Table on The Netherlands - Market size and forecast 2025-2030 ($ million)
Chart on The Netherlands - Year-over-year growth 2025-2030 (%)
Data Table on The Netherlands - Year-over-year growth 2025-2030 (%)

12.5 Asia - Market size and forecast 2025-2030

Chart on Asia - Market size and forecast 2025-2030 ($ million)
Data Table on Asia - Market size and forecast 2025-2030 ($ million)
Chart on Asia - Year-over-year growth 2025-2030 (%)
Data Table on Asia - Year-over-year growth 2025-2030 (%)
Chart on Regional Comparison - Asia
Data Table on Regional Comparison - Asia

12.5.1 China - Market size and forecast 2025-2030

Chart on China - Market size and forecast 2025-2030 ($ million)
Data Table on China - Market size and forecast 2025-2030 ($ million)
Chart on China - Year-over-year growth 2025-2030 (%)
Data Table on China - Year-over-year growth 2025-2030 (%)

12.5.2 Japan - Market size and forecast 2025-2030

Chart on Japan - Market size and forecast 2025-2030 ($ million)
Data Table on Japan - Market size and forecast 2025-2030 ($ million)
Chart on Japan - Year-over-year growth 2025-2030 (%)
Data Table on Japan - Year-over-year growth 2025-2030 (%)

12.5.3 India - Market size and forecast 2025-2030

Chart on India - Market size and forecast 2025-2030 ($ million)
Data Table on India - Market size and forecast 2025-2030 ($ million)
Chart on India - Year-over-year growth 2025-2030 (%)
Data Table on India - Year-over-year growth 2025-2030 (%)

12.5.4 South Korea - Market size and forecast 2025-2030

Chart on South Korea - Market size and forecast 2025-2030 ($ million)
Data Table on South Korea - Market size and forecast 2025-2030 ($ million)
Chart on South Korea - Year-over-year growth 2025-2030 (%)
Data Table on South Korea - Year-over-year growth 2025-2030 (%)

12.5.5 Singapore - Market size and forecast 2025-2030

Chart on Singapore - Market size and forecast 2025-2030 ($ million)
Data Table on Singapore - Market size and forecast 2025-2030 ($ million)
Chart on Singapore - Year-over-year growth 2025-2030 (%)
Data Table on Singapore - Year-over-year growth 2025-2030 (%)

12.5.6 Thailand - Market size and forecast 2025-2030

Chart on Thailand - Market size and forecast 2025-2030 ($ million)
Data Table on Thailand - Market size and forecast 2025-2030 ($ million)
Chart on Thailand - Year-over-year growth 2025-2030 (%)
Data Table on Thailand - Year-over-year growth 2025-2030 (%)

12.6 Rest of World (ROW) - Market size and forecast 2025-2030

Chart on Rest of World (ROW) - Market size and forecast 2025-2030 ($ million)
Data Table on Rest of World (ROW) - Market size and forecast 2025-2030 ($ million)
Chart on Rest of World (ROW) - Year-over-year growth 2025-2030 (%)
Data Table on Rest of World (ROW) - Year-over-year growth 2025-2030 (%)
Chart on Regional Comparison - Rest of World (ROW)
Data Table on Regional Comparison - Rest of World (ROW)

12.6.1 Brazil - Market size and forecast 2025-2030

Chart on Brazil - Market size and forecast 2025-2030 ($ million)
Data Table on Brazil - Market size and forecast 2025-2030 ($ million)
Chart on Brazil - Year-over-year growth 2025-2030 (%)
Data Table on Brazil - Year-over-year growth 2025-2030 (%)

12.6.2 Saudi Arabia - Market size and forecast 2025-2030

Chart on Saudi Arabia - Market size and forecast 2025-2030 ($ million)
Data Table on Saudi Arabia - Market size and forecast 2025-2030 ($ million)
Chart on Saudi Arabia - Year-over-year growth 2025-2030 (%)
Data Table on Saudi Arabia - Year-over-year growth 2025-2030 (%)

12.6.3 UAE - Market size and forecast 2025-2030

Chart on UAE - Market size and forecast 2025-2030 ($ million)
Data Table on UAE - Market size and forecast 2025-2030 ($ million)
Chart on UAE - Year-over-year growth 2025-2030 (%)
Data Table on UAE - Year-over-year growth 2025-2030 (%)

12.6.4 South Africa - Market size and forecast 2025-2030

Chart on South Africa - Market size and forecast 2025-2030 ($ million)
Data Table on South Africa - Market size and forecast 2025-2030 ($ million)
Chart on South Africa - Year-over-year growth 2025-2030 (%)
Data Table on South Africa - Year-over-year growth 2025-2030 (%)

12.6.5 Argentina - Market size and forecast 2025-2030

Chart on Argentina - Market size and forecast 2025-2030 ($ million)
Data Table on Argentina - Market size and forecast 2025-2030 ($ million)
Chart on Argentina - Year-over-year growth 2025-2030 (%)
Data Table on Argentina - Year-over-year growth 2025-2030 (%)

12.6.6 Egypt - Market size and forecast 2025-2030

Chart on Egypt - Market size and forecast 2025-2030 ($ million)
Data Table on Egypt - Market size and forecast 2025-2030 ($ million)
Chart on Egypt - Year-over-year growth 2025-2030 (%)
Data Table on Egypt - Year-over-year growth 2025-2030 (%)

12.6.7 Chile - Market size and forecast 2025-2030

Chart on Chile - Market size and forecast 2025-2030 ($ million)
Data Table on Chile - Market size and forecast 2025-2030 ($ million)
Chart on Chile - Year-over-year growth 2025-2030 (%)
Data Table on Chile - Year-over-year growth 2025-2030 (%)

12.6.8 Israel - Market size and forecast 2025-2030

Chart on Israel - Market size and forecast 2025-2030 ($ million)
Data Table on Israel - Market size and forecast 2025-2030 ($ million)
Chart on Israel - Year-over-year growth 2025-2030 (%)
Data Table on Israel - Year-over-year growth 2025-2030 (%)

12.7 Market opportunity by geography

Market opportunity by geography ($ million)
Data Tables on Market opportunity by geography ($ million)

13. Drivers, Challenges, and Opportunity

13.1 Market drivers

Accelerating prevalence of atrial fibrillation drives global prescription blood thinner consumption
Clinical efficacy advantages accelerate phase out of legacy vitamin k antagonists
Expanding pediatric and oncology indications broaden therapeutic application scope for anticoagulants

13.2 Market challenges

Major bleeding risks associated with direct oral anticoagulants impair prescribing confidence
Patent exclusivity extensions for branded oral anticoagulants delay generic market availability
Prohibitive drug acquisition costs restrict patient access across low income healthcare networks

13.3 Impact of drivers and challenges

Impact of drivers and challenges in 2025 and 2030

13.4 Market opportunities

Emerging factor eleven inhibitors provide targeted antithrombotic protection without bleeding risks
Development of targeted reversal agents enhances emergency hemostatic control and safety
Long acting parenteral monoclonal antibodies transform patient compliance in chronic anticoagulation

14. Competitive Landscape

14.1 Overview

14.2

Overview on criticality of inputs and factors of differentiation

14.3 Landscape disruption

Overview on factors of disruption

14.4 Industry risks

Impact of key risks on business

15. Competitive Analysis

15.1 Companies profiled

Companies covered

15.2 Company ranking index

15.3 Market positioning of companies

Matrix on companies position and classification

15.4 AstraZeneca Plc

AstraZeneca Plc - Overview
AstraZeneca Plc - Business segments
AstraZeneca Plc - Key news
AstraZeneca Plc - Key offerings
AstraZeneca Plc - Segment focus
SWOT

15.5 Baxter International Inc.

Baxter International Inc. - Overview
Baxter International Inc. - Business segments
Baxter International Inc. - Key news
Baxter International Inc. - Key offerings
Baxter International Inc. - Segment focus
SWOT

15.6 Bayer AG

Bayer AG - Overview
Bayer AG - Business segments
Bayer AG - Key news
Bayer AG - Key offerings
Bayer AG - Segment focus
SWOT

15.7 Bristol Myers Squibb Co.

Bristol Myers Squibb Co. - Overview
Bristol Myers Squibb Co. - Product / Service
Bristol Myers Squibb Co. - Key news
Bristol Myers Squibb Co. - Key offerings
SWOT

15.8 Cipla Inc.

Cipla Inc. - Overview
Cipla Inc. - Business segments
Cipla Inc. - Key news
Cipla Inc. - Key offerings
Cipla Inc. - Segment focus
SWOT

15.9 Dr. Reddys Laboratories Ltd.

Dr. Reddys Laboratories Ltd. - Overview
Dr. Reddys Laboratories Ltd. - Business segments
Dr. Reddys Laboratories Ltd. - Key news
Dr. Reddys Laboratories Ltd. - Key offerings
Dr. Reddys Laboratories Ltd. - Segment focus
SWOT

15.10 Gland Pharma Ltd

Gland Pharma Ltd - Overview
Gland Pharma Ltd - Product / Service
Gland Pharma Ltd - Key offerings
SWOT

15.11 Johnson and Johnson

Johnson and Johnson - Overview
Johnson and Johnson - Business segments
Johnson and Johnson - Key news
Johnson and Johnson - Key offerings
Johnson and Johnson - Segment focus
SWOT

15.12 Pfizer Inc.

Pfizer Inc. - Overview
Pfizer Inc. - Business segments
Pfizer Inc. - Key news
Pfizer Inc. - Key offerings
Pfizer Inc. - Segment focus
SWOT

15.13 Sandoz Group AG

Sandoz Group AG - Overview
Sandoz Group AG - Business segments
Sandoz Group AG - Key news
Sandoz Group AG - Key offerings
Sandoz Group AG - Segment focus
SWOT

15.14 Sanofi SA

Sanofi SA - Overview
Sanofi SA - Business segments
Sanofi SA - Key news
Sanofi SA - Key offerings
Sanofi SA - Segment focus
SWOT

15.15 Sun Pharmaceutical Industries

Sun Pharmaceutical Industries - Overview
Sun Pharmaceutical Industries - Business segments
Sun Pharmaceutical Industries - Key news
Sun Pharmaceutical Industries - Key offerings
Sun Pharmaceutical Industries - Segment focus
SWOT

15.16 Teva Pharmaceutical Ltd.

Teva Pharmaceutical Ltd. - Overview
Teva Pharmaceutical Ltd. - Business segments
Teva Pharmaceutical Ltd. - Key news
Teva Pharmaceutical Ltd. - Key offerings
Teva Pharmaceutical Ltd. - Segment focus
SWOT

15.17 Viatris Inc.

Viatris Inc. - Overview
Viatris Inc. - Business segments
Viatris Inc. - Key news
Viatris Inc. - Key offerings
Viatris Inc. - Segment focus
SWOT

15.18 Zydus Lifesciences Ltd.

Zydus Lifesciences Ltd. - Overview
Zydus Lifesciences Ltd. - Business segments
Zydus Lifesciences Ltd. - Key news
Zydus Lifesciences Ltd. - Key offerings
Zydus Lifesciences Ltd. - Segment focus
SWOT

16. Appendix

16.1 Scope of the report

Market definition
Objectives
Notes and caveats

16.2 Inclusions and exclusions checklist

Inclusions checklist
Exclusions checklist

16.3 Currency conversion rates for US$

16.4 Research methodology

16.5 Data procurement

Information sources

16.6 Data validation

16.7 Validation techniques employed for market sizing

16.8 Data synthesis

16.9 360 degree market analysis

16.10 List of abbreviations

Research Methodology

Technavio presents a detailed picture of the market by way of study, synthesis, and summation of data from multiple sources. The analysts have presented the various facets of the market with a particular focus on identifying the key industry influencers. The data thus presented is comprehensive, reliable, and the result of extensive research, both primary and secondary.

INFORMATION SOURCES

Primary sources

  • Manufacturers and suppliers
  • Channel partners
  • Industry experts
  • Strategic decision makers

Secondary sources

  • Industry journals and periodicals
  • Government data
  • Financial reports of key industry players
  • Historical data
  • Press releases

DATA ANALYSIS

Data Synthesis

  • Collation of data
  • Estimation of key figures
  • Analysis of derived insights

Data Validation

  • Triangulation with data models
  • Reference against proprietary databases
  • Corroboration with industry experts

REPORT WRITING

Qualitative

  • Market drivers
  • Market challenges
  • Market trends
  • Five forces analysis

Quantitative

  • Market size and forecast
  • Market segmentation
  • Geographical insights
  • Competitive landscape

Interested in this report?

Get your sample now to see our research methodology and insights!

Download Now

Frequently Asked Questions

Anticoagulants market growth will increase by USD 22956.3 million during 2026-2030.

The Anticoagulants market is expected to grow at a CAGR of 8.5% during 2026-2030.

Anticoagulants market is segmented by Route of administration (Oral anticoagulants, Injectable anticoagulants) Type (Factor Xa inhibitors, DTIs, Heparin, Vitamin K antagonists) Distribution channel (Hospital pharmacy, Retail pharmacy, Online pharmacy)

Amneal Pharmaceuticals Inc., Aspen Pharmacare Ltd., AstraZeneca Plc, Aurobindo Pharma Ltd., Baxter International Inc., Bayer AG, Bristol Myers Squibb Co., Cipla Inc., Dr. Reddys Laboratories Ltd., Gland Pharma Ltd, Hikma Pharmaceuticals Plc, Johnson and Johnson, Organon and Co., Pfizer Inc., Sandoz Group AG, Sanofi SA, Sun Pharmaceutical Industries, Teva Pharmaceutical Ltd., Viatris Inc., Zydus Lifesciences Ltd. are a few of the key vendors in the Anticoagulants market.

North America will register the highest growth rate of 49.8% among the other regions. Therefore, the Anticoagulants market in North America is expected to garner significant business opportunities for the vendors during the forecast period.

US, Canada, Mexico, Germany, UK, France, Italy, Spain, The Netherlands, China, Japan, India, South Korea, Singapore, Thailand, Brazil, Saudi Arabia, UAE, South Africa, Argentina, Egypt, Chile, Israel

  • Accelerating prevalence of atrial fibrillation drives global prescription blood thinner consumption is the driving factor this market.

The Anticoagulants market vendors should focus on grabbing business opportunities from the Route of administration segment as it accounted for the largest market share in the base year.
RIA - Research AI Assistant
Ask RIA
