
Analytical Standards Market Analysis, Size, and Forecast 2026-2030: North America (US, Canada, and Mexico), Europe (Germany, UK, and France), APAC (China, Japan, and India), South America (Brazil, Argentina, and Chile), Middle East and Africa (Saudi Arabia, UAE, and South Africa), and Rest of World (ROW)

Analytical Standards Market Analysis, Size, and Forecast 2026-2030:
North America (US, Canada, and Mexico), Europe (Germany, UK, and France), APAC (China, Japan, and India), South America (Brazil, Argentina, and Chile), Middle East and Africa (Saudi Arabia, UAE, and South Africa), and Rest of World (ROW)

Published: Oct 2026 312 Pages SKU: IRTNTR74240

Market Overview at a Glance

$793.36 Mn
Market Opportunity
7.2%
CAGR 2025 - 2030
44.7%
North America Growth
$576.89 Mn
Chromatography segment 2024

Analytical Standards Market Size 2026-2030

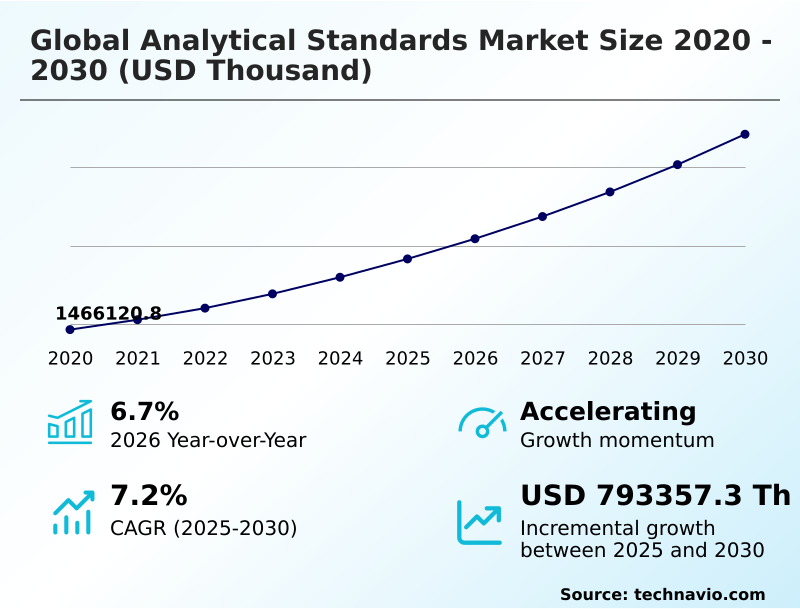
The analytical standards market size is valued to increase by USD 793.36 million, at a CAGR of 7.2% from 2025 to 2030. Rapid growth in life science industry will drive the analytical standards market.

Major Market Trends & Insights

  • North America dominated the market and accounted for a 44.7% growth during the forecast period.
  • By Type - Chromatography segment was valued at USD 576.89 million in 2024
  • By Application - Food and beverages segment accounted for the largest market revenue share in 2024

Market Size & Forecast

  • Market Opportunities:
  • Market Future Opportunities: USD 793.36 million
  • CAGR from 2025 to 2030 : 7.2%

Market Summary

  • The Analytical Standards landscape is evolving rapidly, driven by the uncompromising necessity for data integrity in manufacturing and research sectors. Laboratories utilizing premium reference materials report a 25% improvement in compliance efficiency, effectively streamlining batch release cycles.
  • A critical driver propelling this momentum is the accelerated expansion of the life science industry, where exact measurement benchmarks are mandatory for drug discovery and regulatory approvals. Conversely, the limited shelf life of these specialized materials imposes a significant operational challenge, often forcing facilities to implement high-frequency procurement cycles that strain inventory budgets.
  • In a real-world scenario, food safety testing facilities depend on these benchmarks to identify trace contaminants, mitigating product recall risks while maintaining supply chain continuity. As regulatory scrutiny intensifies globally, the reliance on validated Analytical Standards remains fundamental for organizations aiming to sustain product quality, navigate complex compliance frameworks, and ensure continuous operational resilience.

What will be the Size of the Analytical Standards Market during the forecast period?
Get Key Insights on Market Forecast (PDF) Get Free Sample

How is the Analytical Standards Market Segmented?

The analytical standards industry research report provides comprehensive data (region-wise segment analysis), with forecasts and estimates in "USD thousand" for the period 2026-2030, as well as historical data from 2020-2024 for the following segments.

  • Type
    • Chromatography
    • Spectroscopy
    • Physical properties testing
    • Titrimetry
  • Application
    • Food and beverages
    • Pharmaceuticals and life sciences
    • Environmental
    • Others
  • Methodology
    • Bioanalytical testing
    • Raw material testing
    • Stability testing
    • Dissolution testing
    • Others
  • Geography
    • North America
      • US
      • Canada
      • Mexico
    • Europe
      • Germany
      • UK
      • France
      • Italy
      • Spain
      • The Netherlands
    • APAC
      • China
      • Japan
      • India
      • South Korea
      • Australia
      • Indonesia
    • South America
      • Brazil
      • Argentina
      • Chile
    • Middle East and Africa
      • Saudi Arabia
      • UAE
      • South Africa
      • Israel
      • Turkey

By Type Insights

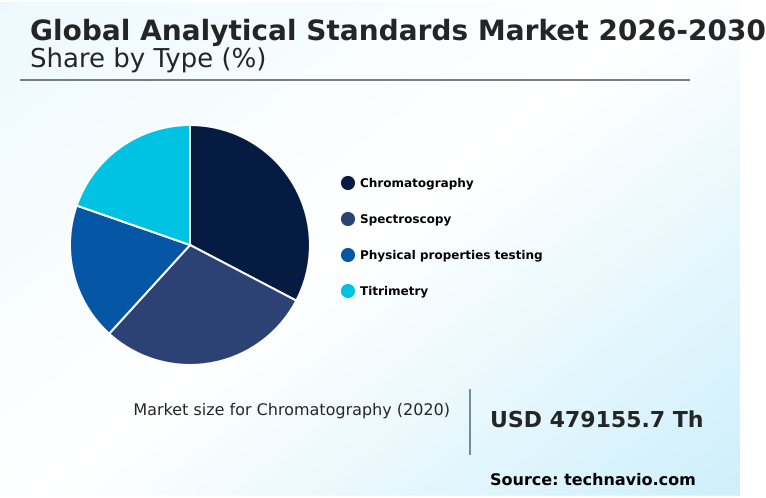
The chromatography segment is estimated to witness significant growth during the forecast period.

The chromatography segment defines modern laboratory precision, directly influencing operational efficiency across pharmaceutical and environmental sectors.

By integrating rigorous chromatographic method validation and precise instrument calibration accuracy, laboratories reduce measurement discrepancies by up to 15%, fundamentally optimizing routine quality control operations.

As workflows grow more complex, maintaining metrological traceability ensures reliable impurity profiling and quantitative analytical accuracy. Facilities utilizing these advanced benchmarks streamline analytical workflow standardization, achieving highly reproducible analytical outcomes even in challenging matrices.

Enhanced mass spectrometry calibration significantly elevates data integrity, allowing manufacturers to navigate stringent method development validation without compromising production timelines.

This continuous refinement in testing protocols reduces compliance bottlenecks, enabling enterprises to maintain strict quality standards while adapting to increasingly demanding regulatory testing requirements.
Get Free Sample

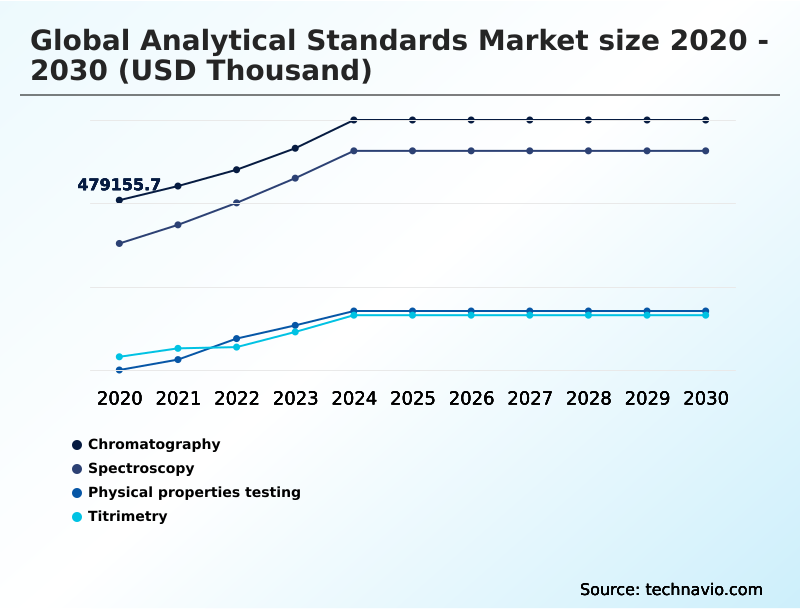
The Chromatography segment was valued at USD 576.89 million in 2024 and showed a gradual increase during the forecast period.
Get Free Sample

Regional Analysis

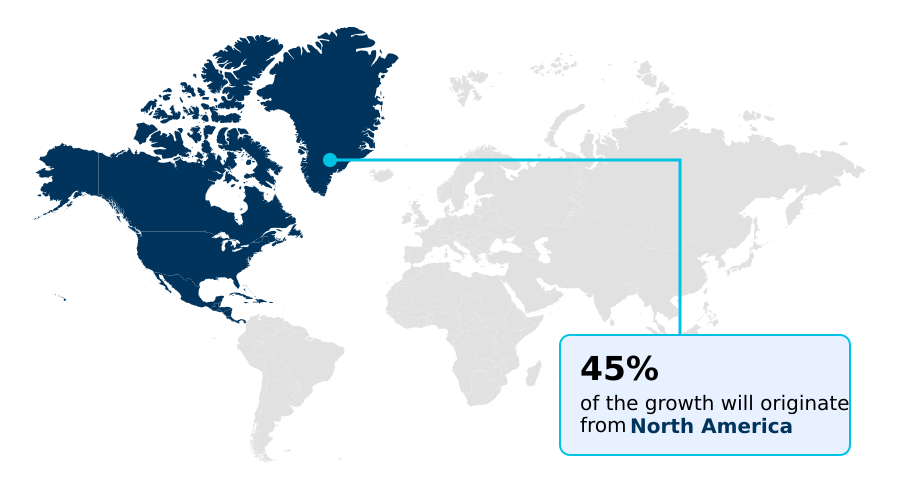
North America is estimated to contribute 44.7% to the growth of the global market during the forecast period.Technavio’s analysts have elaborately explained the regional trends and drivers that shape the market during the forecast period.
See How Analytical Standards Market Demand is Rising in North America Get Free Sample

The Analytical Standards adoption footprint highlights distinct operational contrasts between North America and APAC.

North America maintains a sophisticated infrastructure heavily reliant on advanced clinical diagnostic benchmarks and rigorous raw material qualification, driving a 25% higher compliance efficiency rate compared to emerging zones.

In contrast, APAC is rapidly scaling its environmental contaminant monitoring and enforcing stricter food safety residue limits, accelerating regional supply chain modernization. Facilities leveraging exact spectroscopic calibration and comprehensive traceability protocols typically reduce testing discrepancies by 18%.

The integration of isotope-labeled compounds significantly enhances matrix interference mitigation across complex assays.

By standardizing physicochemical testing benchmarks during critical batch release testing, enterprises across these regions optimize workflow reliability, minimize regulatory friction, and achieve substantial cost reductions in their quality assurance operations.

Market Dynamics

Our researchers analyzed the data with 2025 as the base year, along with the key drivers, trends, and challenges. A holistic analysis of drivers will help companies refine their marketing strategies to gain a competitive advantage.

  • The continuous evolution of the Analytical Standards landscape necessitates robust frameworks for ensuring measurement precision across varied industrial sectors. Organizations are increasingly relying on method validation calibration reference materials to streamline compliance and mitigate operational risks.
  • By integrating high purity mass spectrometry standards, laboratories enhance their capacity to detect trace elements, effectively improving diagnostic accuracy by over 20% compared to legacy testing methods. In the pharmaceutical sector, the deployment of specialized pharmaceutical impurity profiling reference compounds is critical for evaluating product safety and maintaining uninterrupted supply chain operations.
  • Concurrently, environmental agencies are prioritizing certified environmental contaminant monitoring standards to enforce stricter regulatory policies and safeguard ecological health. Furthermore, testing facilities handling complex matrices frequently demand custom synthesized organic compound standards to resolve unique analytical challenges that off-the-shelf solutions cannot address.
  • This strategic shift toward highly specialized reference tools enables enterprises to optimize their quality control processes, reduce costly batch rejections, and sustain a competitive advantage in compliance-driven industrial markets.
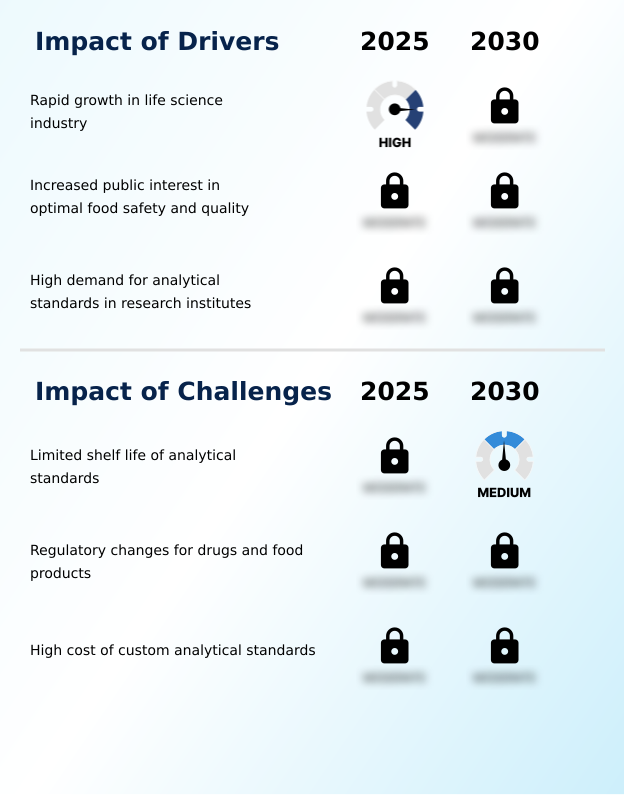
What are the key market drivers leading to the rise in the adoption of Analytical Standards Industry?

  • The rapid expansion of the life science industry acts as a primary driver, fundamentally escalating the requirement for precise reference materials in pharmaceutical development.

  • The accelerated expansion of the biopharmaceutical sector acts as a fundamental catalyst propelling the Analytical Standards ecosystem. Organizations are compelled to adopt rigorous biopharmaceutical characterization processes, utilizing metabolite quantification standards to ensure molecular efficacy.
  • This surge is driven by regulatory bodies demanding exact chemical purity verification, which pushes laboratories to integrate certified reference materials and meticulous calibration standards.
  • Consequently, facilities deploying standardized measurement protocols achieve a 28% improvement in laboratory proficiency evaluation scores, directly reducing the incidence of costly batch failures. The stringent implementation of chromatographic method validation and precise impurity profiling fortifies overarching quality assurance frameworks.
  • This operational shift empowers manufacturers to accelerate drug discovery pipelines, ensure steadfast regulatory alignment, and dramatically lower compliance-related expenditures across global development networks.

What are the market trends shaping the Analytical Standards Industry?

  • The increasing adoption of custom standards serves as a prominent trend reshaping laboratory operations. Organizations are prioritizing tailored reference materials to enhance testing precision and accommodate complex analytical workflows.

  • The Analytical Standards landscape is undergoing a decisive shift driven by the escalating demand for highly specialized testing solutions. Facilities are increasingly transitioning toward custom synthesized reference compounds to address complex matrices, improving product authenticity verification accuracy by 22%.
  • This evolution is fundamentally driven by the need to navigate stringent dissolution testing parameters and rigorous heavy metal quantification requirements in advanced manufacturing. As a result, laboratories utilizing comprehensive analytical instrument qualification protocols alongside targeted volatile organic compound benchmarks experience significantly fewer compliance bottlenecks.
  • The integration of advanced lipid reference standards and refined stability indicating assays directly enhances shelf-life stability testing, minimizing premature product spoilage. By standardizing pesticide residue screening, enterprises fortify their supply chains against contamination risks, ultimately achieving superior operational resilience and safeguarding brand integrity in highly regulated consumer markets.

What challenges does the Analytical Standards Industry face during its growth?

  • The limited shelf life of reference materials presents a substantial challenge, frequently inflating operational costs and complicating laboratory inventory management.

  • The limited shelf life of highly sensitive reference materials poses a severe operational constraint within the Analytical Standards landscape. Laboratories frequently encounter degradation in isotope-labeled compounds, which directly compromises quantitative analytical accuracy and forces premature inventory replenishment.
  • This instability is driven by the complex storage requirements of precision measurement tools, leading to a 15% increase in procurement costs for facilities managing large-scale routine quality control. Consequently, compromised materials disrupt mass spectrometry calibration and spectroscopic calibration workflows, threatening adherence to strict regulatory compliance benchmarks.
  • When validation tools degrade, organizations risk failing laboratory accreditation protocols, causing immediate delays in product release cycles. This structural limitation compels businesses to over-invest in specialized storage infrastructure and high-frequency purchasing models, significantly diminishing overall operational efficiency and straining departmental budgets.

Exclusive Technavio Analysis on Customer Landscape

The analytical standards market forecasting report includes the adoption lifecycle of the market, covering from the innovator’s stage to the laggard’s stage. It focuses on adoption rates in different regions based on penetration. Furthermore, the analytical standards market report also includes key purchase criteria and drivers of price sensitivity to help companies evaluate and develop their market growth analysis strategies.
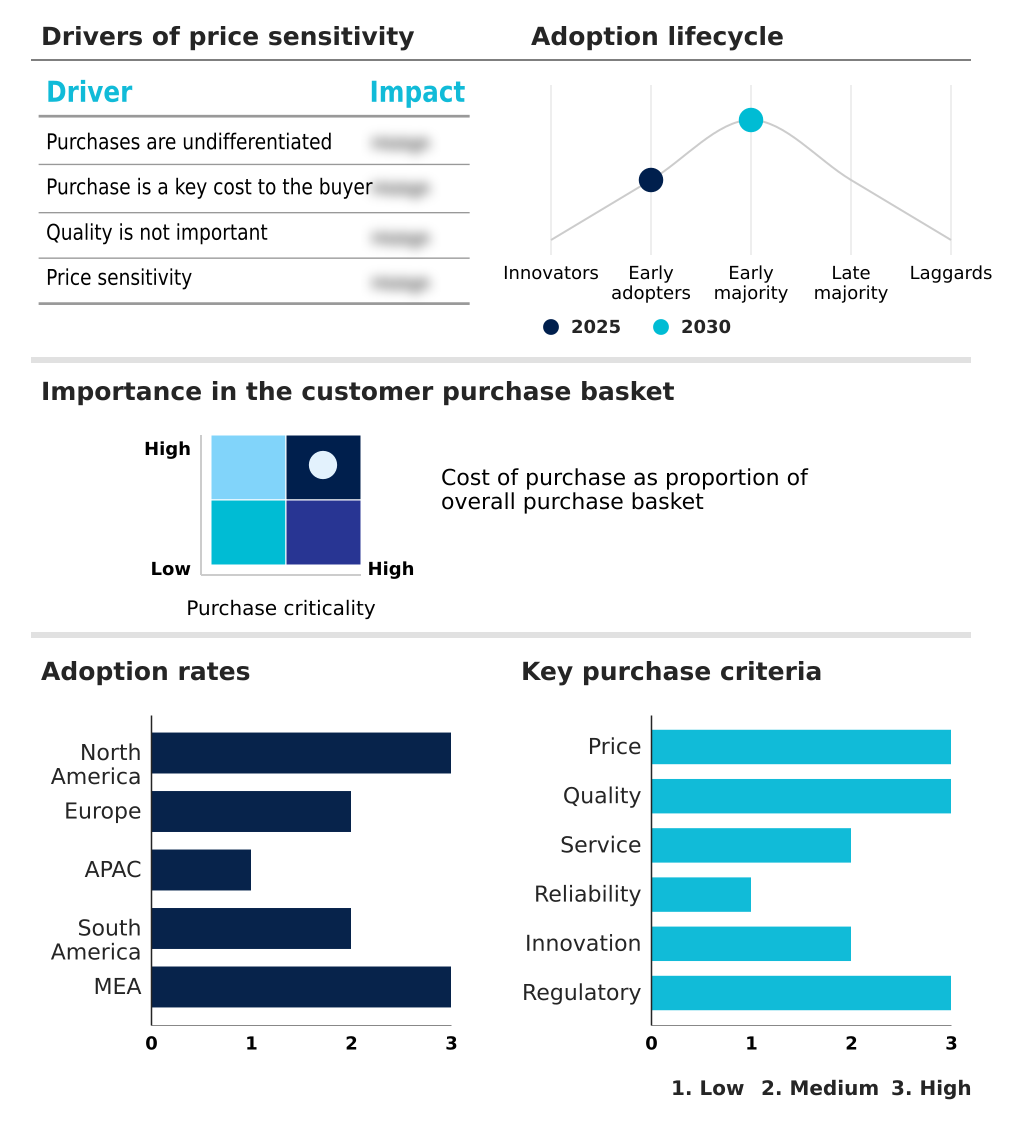
Customer Landscape of Analytical Standards Industry

Competitive Landscape

Companies are implementing various strategies, such as strategic alliances, analytical standards market forecast, partnerships, mergers and acquisitions, geographical expansion, and product/service launches, to enhance their presence in the industry.

AccuStandard Inc. - The supplier provides highly specialized organic, inorganic, pesticide, and petroleum reference materials alongside custom calibration solutions, ensuring exact analytical accuracy for rigorous laboratory compliance and measurement requirements.

The industry research and growth report includes detailed analyses of the competitive landscape of the market and information about key companies, including:

  • AccuStandard Inc.
  • Agilent Technologies Inc.
  • Alfa Chemistry
  • Biosynth Ltd.
  • Campro Scientific GmbH
  • Cayman Chemical Co.
  • Chiron AS
  • CPI International
  • Crescent Chemical Co. Inc.
  • GFS Chemicals Inc.
  • HPC Standards GmbH
  • Labsert Ltd
  • LGC Ltd.
  • PerkinElmer US LLC
  • Reagecon Diagnostics Ltd.
  • Restek Corp.
  • Sigma Aldrich Chemicals Ltd.
  • Thermo Fisher Scientific Inc.
  • Tokyo Chemical Industry Co.
  • Waters Corp.
  • Wellington Laboratories Inc.

Qualitative and quantitative analysis of companies has been conducted to help clients understand the wider business environment as well as the strengths and weaknesses of key industry players. Data is qualitatively analyzed to categorize companies as pure play, category-focused, industry-focused, and diversified; it is quantitatively analyzed to categorize companies as dominant, leading, strong, tentative, and weak.

Recent Development and News in Analytical standards market

  • In the Life Sciences Tools and Services industry, the accelerated adoption of high-throughput screening technologies increased the volume of drug discovery assays, directly impacting Analytical Standards demand by requiring highly precise calibration benchmarks to ensure data reproducibility.
  • Stringent international regulations governing biopharmaceutical characterization compelled manufacturers to implement rigorous batch release testing, driving a 20% increase in the utilization of specialized reference materials for regulatory compliance.
  • The integration of automated liquid handling systems in clinical laboratories optimized bioanalytical assay validation processes, elevating the necessity for standardized measurement protocols to maintain instrument calibration accuracy across high-volume environments.
  • Advancements in multiplexed diagnostic platforms for personalized medicine necessitated complex biomarker quantification, increasing the reliance on custom synthesized reference compounds to achieve reliable quantitative analytical accuracy in targeted therapies.

Dive into Technavio’s robust research methodology, blending expert interviews, extensive data synthesis, and validated models for unparalleled Analytical Standards Market insights. See full methodology.

Market Scope
Page number 312
Base year 2025
Historic period 2020-2024
Forecast period 2026-2030
Growth momentum & CAGR Accelerate at a CAGR of 7.2%
Market growth 2026-2030 USD 793357.3 thousand
Market structure Fragmented
YoY growth 2025-2026(%) 6.7%
Key countries US, Canada, Mexico, Germany, UK, France, Italy, Spain, The Netherlands, China, Japan, India, South Korea, Australia, Indonesia, Brazil, Argentina, Chile, Saudi Arabia, UAE, South Africa, Israel and Turkey
Competitive landscape Leading Companies, Market Positioning of Companies, Competitive Strategies, and Industry Risks

Request Free Sample

Research Analyst Overview

  • The continuous evolution of the Analytical Standards sector underscores a critical shift toward uncompromising measurement precision in enterprise quality control. As industries navigate complex regulatory frameworks, the integration of certified reference materials and precise calibration standards has become imperative for maintaining operational integrity.
  • Laboratories implementing rigorous bioanalytical assay validation processes have achieved a 30% reduction in workflow redundancies, significantly optimizing resource allocation. This transition heavily impacts strategic product planning, as reliable pharmacokinetic study standards and exact biomarker quantification directly accelerate the development cycles of advanced therapeutics.
  • Furthermore, the standardization of elemental impurity testing ensures product safety and compliance, mitigating the risk of costly manufacturing delays. By prioritizing titrimetric analysis accuracy and deploying specialized high-purity reference materials, organizations fundamentally transform their testing capabilities. These strategic enhancements not only fortify boardroom-level compliance mandates but also empower enterprises to deliver consistent, high-quality outcomes across fiercely competitive industrial landscapes.

What are the Key Data Covered in this Analytical Standards Market Research and Growth Report?

  • What is the expected growth of the Analytical Standards Market between 2026 and 2030?

    • USD 793.36 million, at a CAGR of 7.2%

  • What segmentation does the market report cover?

    • The report is segmented by Type (Chromatography, Spectroscopy, Physical properties testing, and Titrimetry), Application (Food and beverages, Pharmaceuticals and life sciences, Environmental, and Others), Methodology (Bioanalytical testing, Raw material testing, Stability testing, Dissolution testing, and Others) and Geography (North America, Europe, APAC, South America, Middle East and Africa)

  • Which regions are analyzed in the report?

    • North America, Europe, APAC, South America and Middle East and Africa

  • What are the key growth drivers and market challenges?

    • Rapid growth in life science industry, Limited shelf life of analytical standards

  • Who are the major players in the Analytical Standards Market?

    • AccuStandard Inc., Agilent Technologies Inc., Alfa Chemistry, Biosynth Ltd., Campro Scientific GmbH, Cayman Chemical Co., Chiron AS, CPI International, Crescent Chemical Co. Inc., GFS Chemicals Inc., HPC Standards GmbH, Labsert Ltd, LGC Ltd., PerkinElmer US LLC, Reagecon Diagnostics Ltd., Restek Corp., Sigma Aldrich Chemicals Ltd., Thermo Fisher Scientific Inc., Tokyo Chemical Industry Co., Waters Corp. and Wellington Laboratories Inc.

Market Research Insights

  • The Analytical Standards ecosystem is transforming as industries rigorously enforce advanced quality assurance frameworks to mitigate production risks. Organizations deploying high-tier precision measurement tools have documented a 20% reduction in false-positive test results, directly enhancing operational cost-efficiency. Utilizing established regulatory compliance benchmarks ensures that manufacturing pipelines remain uninterrupted by quality disputes.
  • Furthermore, the integration of robust laboratory accreditation protocols accelerates product validation phases, cutting processing delays by up to 15% for novel therapeutics. By routinely incorporating proficiency testing samples into daily workflows, facilities sustain unwavering measurement consistency. This strategic alignment ultimately elevates analytical reliability, reinforcing corporate compliance while minimizing financial exposure associated with regulatory penalties.

We can help! Our analysts can customize this analytical standards market research report to meet your requirements.

Get in touch

1. Executive Summary

1.1 Market overview

Executive Summary - Chart on Market Overview
Executive Summary - Data Table on Market Overview
Executive Summary - Chart on Global Market Characteristics
Executive Summary - Chart on Market by Geography
Executive Summary - Chart on Market Segmentation by Type
Executive Summary - Chart on Market Segmentation by Application
Executive Summary - Chart on Market Segmentation by Methodology
Executive Summary - Chart on Incremental Growth
Executive Summary - Data Table on Incremental Growth
Executive Summary - Chart on Company Market Positioning

2. Technavio Analysis

2.1 Analysis of price sensitivity, lifecycle, customer purchase basket, adoption rates, and purchase criteria

2.2 Criticality of inputs and Factors of differentiation

Chart on Overview on criticality of inputs and factors of differentiation

2.3 Factors of disruption

Chart on Overview on factors of disruption

2.4 Impact of drivers and challenges

Chart on Impact of drivers and challenges in 2025 and 2030

3. Market Landscape

3.1 Market ecosystem

Chart on Parent Market
Data Table on - Parent Market

3.2 Market characteristics

Chart on Market characteristics analysis

3.3 Value chain analysis

Chart on Value chain analysis

4. Market Sizing

4.1 Market definition

Data Table on Offerings of companies included in the market definition

4.2 Market segment analysis

Market segments

4.3 Market size 2025

4.4 Market outlook: Forecast for 2025-2030

Chart on Global - Market size and forecast 2025-2030 ($ thousand)
Data Table on Global - Market size and forecast 2025-2030 ($ thousand)
Chart on Global Market: Year-over-year growth 2025-2030 (%)
Data Table on Global Market: Year-over-year growth 2025-2030 (%)

5. Historic Market Size

5.1 Global Analytical Standards Market 2020 - 2024

Historic Market Size - Data Table on Global Analytical Standards Market 2020 - 2024 ($ thousand)

5.2 Type segment analysis 2020 - 2024

Historic Market Size - Type Segment 2020 - 2024 ($ thousand)

5.3 Application segment analysis 2020 - 2024

Historic Market Size - Application Segment 2020 - 2024 ($ thousand)

5.4 Methodology segment analysis 2020 - 2024

Historic Market Size - Methodology Segment 2020 - 2024 ($ thousand)

5.5 Geography segment analysis 2020 - 2024

Historic Market Size - Geography Segment 2020 - 2024 ($ thousand)

5.6 Country segment analysis 2020 - 2024

Historic Market Size - Country Segment 2020 - 2024 ($ thousand)

6. Qualitative Analysis

6.1 Impact of AI on Global Analytical Standards Market

6.2 Impact of Geopolitical Conflicts on Global Analytical Standards Market

7. Five Forces Analysis

7.1 Five forces summary

Five forces analysis - Comparison between 2025 and 2030

7.2 Bargaining power of buyers

Bargaining power of buyers - Impact of key factors 2025 and 2030

7.3 Bargaining power of suppliers

Bargaining power of suppliers - Impact of key factors in 2025 and 2030

7.4 Threat of new entrants

Threat of new entrants - Impact of key factors in 2025 and 2030

7.5 Threat of substitutes

Threat of substitutes - Impact of key factors in 2025 and 2030

7.6 Threat of rivalry

Threat of rivalry - Impact of key factors in 2025 and 2030

7.7 Market condition

Chart on Market condition - Five forces 2025 and 2030

8. Market Segmentation by Type

8.1 Market segments

Chart on Type - Market share 2025-2030 (%)
Data Table on Type - Market share 2025-2030 (%)

8.2 Comparison by Type

Chart on Comparison by Type
Data Table on Comparison by Type

8.3 Chromatography - Market size and forecast 2025-2030

Chart on Chromatography - Market size and forecast 2025-2030 ($ thousand)
Data Table on Chromatography - Market size and forecast 2025-2030 ($ thousand)
Chart on Chromatography - Year-over-year growth 2025-2030 (%)
Data Table on Chromatography - Year-over-year growth 2025-2030 (%)

8.4 Spectroscopy - Market size and forecast 2025-2030

Chart on Spectroscopy - Market size and forecast 2025-2030 ($ thousand)
Data Table on Spectroscopy - Market size and forecast 2025-2030 ($ thousand)
Chart on Spectroscopy - Year-over-year growth 2025-2030 (%)
Data Table on Spectroscopy - Year-over-year growth 2025-2030 (%)

8.5 Physical properties testing - Market size and forecast 2025-2030

Chart on Physical properties testing - Market size and forecast 2025-2030 ($ thousand)
Data Table on Physical properties testing - Market size and forecast 2025-2030 ($ thousand)
Chart on Physical properties testing - Year-over-year growth 2025-2030 (%)
Data Table on Physical properties testing - Year-over-year growth 2025-2030 (%)

8.6 Titrimetry - Market size and forecast 2025-2030

Chart on Titrimetry - Market size and forecast 2025-2030 ($ thousand)
Data Table on Titrimetry - Market size and forecast 2025-2030 ($ thousand)
Chart on Titrimetry - Year-over-year growth 2025-2030 (%)
Data Table on Titrimetry - Year-over-year growth 2025-2030 (%)

8.7 Market opportunity by Type

Market opportunity by Type ($ thousand)
Data Table on Market opportunity by Type ($ thousand)

9. Market Segmentation by Application

9.1 Market segments

Chart on Application - Market share 2025-2030 (%)
Data Table on Application - Market share 2025-2030 (%)

9.2 Comparison by Application

Chart on Comparison by Application
Data Table on Comparison by Application

9.3 Food and beverages - Market size and forecast 2025-2030

Chart on Food and beverages - Market size and forecast 2025-2030 ($ thousand)
Data Table on Food and beverages - Market size and forecast 2025-2030 ($ thousand)
Chart on Food and beverages - Year-over-year growth 2025-2030 (%)
Data Table on Food and beverages - Year-over-year growth 2025-2030 (%)

9.4 Pharmaceuticals and life sciences - Market size and forecast 2025-2030

Chart on Pharmaceuticals and life sciences - Market size and forecast 2025-2030 ($ thousand)
Data Table on Pharmaceuticals and life sciences - Market size and forecast 2025-2030 ($ thousand)
Chart on Pharmaceuticals and life sciences - Year-over-year growth 2025-2030 (%)
Data Table on Pharmaceuticals and life sciences - Year-over-year growth 2025-2030 (%)

9.5 Environmental - Market size and forecast 2025-2030

Chart on Environmental - Market size and forecast 2025-2030 ($ thousand)
Data Table on Environmental - Market size and forecast 2025-2030 ($ thousand)
Chart on Environmental - Year-over-year growth 2025-2030 (%)
Data Table on Environmental - Year-over-year growth 2025-2030 (%)

9.6 Others - Market size and forecast 2025-2030

Chart on Others - Market size and forecast 2025-2030 ($ thousand)
Data Table on Others - Market size and forecast 2025-2030 ($ thousand)
Chart on Others - Year-over-year growth 2025-2030 (%)
Data Table on Others - Year-over-year growth 2025-2030 (%)

9.7 Market opportunity by Application

Market opportunity by Application ($ thousand)
Data Table on Market opportunity by Application ($ thousand)

10. Market Segmentation by Methodology

10.1 Market segments

Chart on Methodology - Market share 2025-2030 (%)
Data Table on Methodology - Market share 2025-2030 (%)

10.2 Comparison by Methodology

Chart on Comparison by Methodology
Data Table on Comparison by Methodology

10.3 Bioanalytical testing - Market size and forecast 2025-2030

Chart on Bioanalytical testing - Market size and forecast 2025-2030 ($ thousand)
Data Table on Bioanalytical testing - Market size and forecast 2025-2030 ($ thousand)
Chart on Bioanalytical testing - Year-over-year growth 2025-2030 (%)
Data Table on Bioanalytical testing - Year-over-year growth 2025-2030 (%)

10.4 Raw material testing - Market size and forecast 2025-2030

Chart on Raw material testing - Market size and forecast 2025-2030 ($ thousand)
Data Table on Raw material testing - Market size and forecast 2025-2030 ($ thousand)
Chart on Raw material testing - Year-over-year growth 2025-2030 (%)
Data Table on Raw material testing - Year-over-year growth 2025-2030 (%)

10.5 Stability testing - Market size and forecast 2025-2030

Chart on Stability testing - Market size and forecast 2025-2030 ($ thousand)
Data Table on Stability testing - Market size and forecast 2025-2030 ($ thousand)
Chart on Stability testing - Year-over-year growth 2025-2030 (%)
Data Table on Stability testing - Year-over-year growth 2025-2030 (%)

10.6 Dissolution testing - Market size and forecast 2025-2030

Chart on Dissolution testing - Market size and forecast 2025-2030 ($ thousand)
Data Table on Dissolution testing - Market size and forecast 2025-2030 ($ thousand)
Chart on Dissolution testing - Year-over-year growth 2025-2030 (%)
Data Table on Dissolution testing - Year-over-year growth 2025-2030 (%)

10.7 Others - Market size and forecast 2025-2030

Chart on Others - Market size and forecast 2025-2030 ($ thousand)
Data Table on Others - Market size and forecast 2025-2030 ($ thousand)
Chart on Others - Year-over-year growth 2025-2030 (%)
Data Table on Others - Year-over-year growth 2025-2030 (%)

10.8 Market opportunity by Methodology

Market opportunity by Methodology ($ thousand)
Data Table on Market opportunity by Methodology ($ thousand)

11. Customer Landscape

11.1 Customer landscape overview

Analysis of price sensitivity, lifecycle, customer purchase basket, adoption rates, and purchase criteria

12. Geographic Landscape

12.1 Geographic segmentation

Chart on Market share by geography 2025-2030 (%)
Data Table on Market share by geography 2025-2030 (%)

12.2 Geographic comparison

Chart on Geographic comparison
Data Table on Geographic comparison

12.3 North America - Market size and forecast 2025-2030

Chart on North America - Market size and forecast 2025-2030 ($ thousand)
Data Table on North America - Market size and forecast 2025-2030 ($ thousand)
Chart on North America - Year-over-year growth 2025-2030 (%)
Data Table on North America - Year-over-year growth 2025-2030 (%)
Chart on Regional Comparison - North America
Data Table on Regional Comparison - North America

12.3.1 US - Market size and forecast 2025-2030

Chart on US - Market size and forecast 2025-2030 ($ thousand)
Data Table on US - Market size and forecast 2025-2030 ($ thousand)
Chart on US - Year-over-year growth 2025-2030 (%)
Data Table on US - Year-over-year growth 2025-2030 (%)

12.3.2 Canada - Market size and forecast 2025-2030

Chart on Canada - Market size and forecast 2025-2030 ($ thousand)
Data Table on Canada - Market size and forecast 2025-2030 ($ thousand)
Chart on Canada - Year-over-year growth 2025-2030 (%)
Data Table on Canada - Year-over-year growth 2025-2030 (%)

12.3.3 Mexico - Market size and forecast 2025-2030

Chart on Mexico - Market size and forecast 2025-2030 ($ thousand)
Data Table on Mexico - Market size and forecast 2025-2030 ($ thousand)
Chart on Mexico - Year-over-year growth 2025-2030 (%)
Data Table on Mexico - Year-over-year growth 2025-2030 (%)

12.4 Europe - Market size and forecast 2025-2030

Chart on Europe - Market size and forecast 2025-2030 ($ thousand)
Data Table on Europe - Market size and forecast 2025-2030 ($ thousand)
Chart on Europe - Year-over-year growth 2025-2030 (%)
Data Table on Europe - Year-over-year growth 2025-2030 (%)
Chart on Regional Comparison - Europe
Data Table on Regional Comparison - Europe

12.4.1 Germany - Market size and forecast 2025-2030

Chart on Germany - Market size and forecast 2025-2030 ($ thousand)
Data Table on Germany - Market size and forecast 2025-2030 ($ thousand)
Chart on Germany - Year-over-year growth 2025-2030 (%)
Data Table on Germany - Year-over-year growth 2025-2030 (%)

12.4.2 UK - Market size and forecast 2025-2030

Chart on UK - Market size and forecast 2025-2030 ($ thousand)
Data Table on UK - Market size and forecast 2025-2030 ($ thousand)
Chart on UK - Year-over-year growth 2025-2030 (%)
Data Table on UK - Year-over-year growth 2025-2030 (%)

12.4.3 France - Market size and forecast 2025-2030

Chart on France - Market size and forecast 2025-2030 ($ thousand)
Data Table on France - Market size and forecast 2025-2030 ($ thousand)
Chart on France - Year-over-year growth 2025-2030 (%)
Data Table on France - Year-over-year growth 2025-2030 (%)

12.4.4 Italy - Market size and forecast 2025-2030

Chart on Italy - Market size and forecast 2025-2030 ($ thousand)
Data Table on Italy - Market size and forecast 2025-2030 ($ thousand)
Chart on Italy - Year-over-year growth 2025-2030 (%)
Data Table on Italy - Year-over-year growth 2025-2030 (%)

12.4.5 Spain - Market size and forecast 2025-2030

Chart on Spain - Market size and forecast 2025-2030 ($ thousand)
Data Table on Spain - Market size and forecast 2025-2030 ($ thousand)
Chart on Spain - Year-over-year growth 2025-2030 (%)
Data Table on Spain - Year-over-year growth 2025-2030 (%)

12.4.6 The Netherlands - Market size and forecast 2025-2030

Chart on The Netherlands - Market size and forecast 2025-2030 ($ thousand)
Data Table on The Netherlands - Market size and forecast 2025-2030 ($ thousand)
Chart on The Netherlands - Year-over-year growth 2025-2030 (%)
Data Table on The Netherlands - Year-over-year growth 2025-2030 (%)

12.5 APAC - Market size and forecast 2025-2030

Chart on APAC - Market size and forecast 2025-2030 ($ thousand)
Data Table on APAC - Market size and forecast 2025-2030 ($ thousand)
Chart on APAC - Year-over-year growth 2025-2030 (%)
Data Table on APAC - Year-over-year growth 2025-2030 (%)
Chart on Regional Comparison - APAC
Data Table on Regional Comparison - APAC

12.5.1 China - Market size and forecast 2025-2030

Chart on China - Market size and forecast 2025-2030 ($ thousand)
Data Table on China - Market size and forecast 2025-2030 ($ thousand)
Chart on China - Year-over-year growth 2025-2030 (%)
Data Table on China - Year-over-year growth 2025-2030 (%)

12.5.2 Japan - Market size and forecast 2025-2030

Chart on Japan - Market size and forecast 2025-2030 ($ thousand)
Data Table on Japan - Market size and forecast 2025-2030 ($ thousand)
Chart on Japan - Year-over-year growth 2025-2030 (%)
Data Table on Japan - Year-over-year growth 2025-2030 (%)

12.5.3 India - Market size and forecast 2025-2030

Chart on India - Market size and forecast 2025-2030 ($ thousand)
Data Table on India - Market size and forecast 2025-2030 ($ thousand)
Chart on India - Year-over-year growth 2025-2030 (%)
Data Table on India - Year-over-year growth 2025-2030 (%)

12.5.4 South Korea - Market size and forecast 2025-2030

Chart on South Korea - Market size and forecast 2025-2030 ($ thousand)
Data Table on South Korea - Market size and forecast 2025-2030 ($ thousand)
Chart on South Korea - Year-over-year growth 2025-2030 (%)
Data Table on South Korea - Year-over-year growth 2025-2030 (%)

12.5.5 Australia - Market size and forecast 2025-2030

Chart on Australia - Market size and forecast 2025-2030 ($ thousand)
Data Table on Australia - Market size and forecast 2025-2030 ($ thousand)
Chart on Australia - Year-over-year growth 2025-2030 (%)
Data Table on Australia - Year-over-year growth 2025-2030 (%)

12.5.6 Indonesia - Market size and forecast 2025-2030

Chart on Indonesia - Market size and forecast 2025-2030 ($ thousand)
Data Table on Indonesia - Market size and forecast 2025-2030 ($ thousand)
Chart on Indonesia - Year-over-year growth 2025-2030 (%)
Data Table on Indonesia - Year-over-year growth 2025-2030 (%)

12.6 South America - Market size and forecast 2025-2030

Chart on South America - Market size and forecast 2025-2030 ($ thousand)
Data Table on South America - Market size and forecast 2025-2030 ($ thousand)
Chart on South America - Year-over-year growth 2025-2030 (%)
Data Table on South America - Year-over-year growth 2025-2030 (%)
Chart on Regional Comparison - South America
Data Table on Regional Comparison - South America

12.6.1 Brazil - Market size and forecast 2025-2030

Chart on Brazil - Market size and forecast 2025-2030 ($ thousand)
Data Table on Brazil - Market size and forecast 2025-2030 ($ thousand)
Chart on Brazil - Year-over-year growth 2025-2030 (%)
Data Table on Brazil - Year-over-year growth 2025-2030 (%)

12.6.2 Argentina - Market size and forecast 2025-2030

Chart on Argentina - Market size and forecast 2025-2030 ($ thousand)
Data Table on Argentina - Market size and forecast 2025-2030 ($ thousand)
Chart on Argentina - Year-over-year growth 2025-2030 (%)
Data Table on Argentina - Year-over-year growth 2025-2030 (%)

12.6.3 Chile - Market size and forecast 2025-2030

Chart on Chile - Market size and forecast 2025-2030 ($ thousand)
Data Table on Chile - Market size and forecast 2025-2030 ($ thousand)
Chart on Chile - Year-over-year growth 2025-2030 (%)
Data Table on Chile - Year-over-year growth 2025-2030 (%)

12.7 Middle East and Africa - Market size and forecast 2025-2030

Chart on Middle East and Africa - Market size and forecast 2025-2030 ($ thousand)
Data Table on Middle East and Africa - Market size and forecast 2025-2030 ($ thousand)
Chart on Middle East and Africa - Year-over-year growth 2025-2030 (%)
Data Table on Middle East and Africa - Year-over-year growth 2025-2030 (%)
Chart on Regional Comparison - Middle East and Africa
Data Table on Regional Comparison - Middle East and Africa

12.7.1 Saudi Arabia - Market size and forecast 2025-2030

Chart on Saudi Arabia - Market size and forecast 2025-2030 ($ thousand)
Data Table on Saudi Arabia - Market size and forecast 2025-2030 ($ thousand)
Chart on Saudi Arabia - Year-over-year growth 2025-2030 (%)
Data Table on Saudi Arabia - Year-over-year growth 2025-2030 (%)

12.7.2 UAE - Market size and forecast 2025-2030

Chart on UAE - Market size and forecast 2025-2030 ($ thousand)
Data Table on UAE - Market size and forecast 2025-2030 ($ thousand)
Chart on UAE - Year-over-year growth 2025-2030 (%)
Data Table on UAE - Year-over-year growth 2025-2030 (%)

12.7.3 South Africa - Market size and forecast 2025-2030

Chart on South Africa - Market size and forecast 2025-2030 ($ thousand)
Data Table on South Africa - Market size and forecast 2025-2030 ($ thousand)
Chart on South Africa - Year-over-year growth 2025-2030 (%)
Data Table on South Africa - Year-over-year growth 2025-2030 (%)

12.7.4 Israel - Market size and forecast 2025-2030

Chart on Israel - Market size and forecast 2025-2030 ($ thousand)
Data Table on Israel - Market size and forecast 2025-2030 ($ thousand)
Chart on Israel - Year-over-year growth 2025-2030 (%)
Data Table on Israel - Year-over-year growth 2025-2030 (%)

12.7.5 Turkey - Market size and forecast 2025-2030

Chart on Turkey - Market size and forecast 2025-2030 ($ thousand)
Data Table on Turkey - Market size and forecast 2025-2030 ($ thousand)
Chart on Turkey - Year-over-year growth 2025-2030 (%)
Data Table on Turkey - Year-over-year growth 2025-2030 (%)

12.8 Market opportunity by geography

Market opportunity by geography ($ thousand)
Data Tables on Market opportunity by geography ($ thousand)

13. Drivers, Challenges, and Opportunity

13.1 Market drivers

Rapid growth in life science industry
Increased public interest in optimal food safety and quality
High demand for analytical standards in research institutes

13.2 Market challenges

Limited shelf life of analytical standards
Regulatory changes for drugs and food products
High cost of custom analytical standards

13.3 Impact of drivers and challenges

Impact of drivers and challenges in 2025 and 2030

13.4 Market opportunities

Increasing adoption of custom standards
Increasing importance of analytical standards in quality control
Rapid growth of biotechnology and pharmaceutical industry

14. Competitive Landscape

14.1 Overview

14.2

Overview on criticality of inputs and factors of differentiation

14.3 Landscape disruption

Overview on factors of disruption

14.4 Industry risks

Impact of key risks on business

15. Competitive Analysis

15.1 Companies profiled

Companies covered

15.2 Company ranking index

15.3 Market positioning of companies

Matrix on companies position and classification

15.4 AccuStandard Inc.

AccuStandard Inc. - Overview
AccuStandard Inc. - Product / Service
AccuStandard Inc. - Key offerings
SWOT

15.5 Agilent Technologies Inc.

Agilent Technologies Inc. - Overview
Agilent Technologies Inc. - Business segments
Agilent Technologies Inc. - Key news
Agilent Technologies Inc. - Key offerings
Agilent Technologies Inc. - Segment focus
SWOT

15.6 Alfa Chemistry

Alfa Chemistry - Overview
Alfa Chemistry - Product / Service
Alfa Chemistry - Key offerings
SWOT

15.7 Cayman Chemical Co.

Cayman Chemical Co. - Overview
Cayman Chemical Co. - Product / Service
Cayman Chemical Co. - Key offerings
SWOT

15.8 Chiron AS

Chiron AS - Overview
Chiron AS - Product / Service
Chiron AS - Key offerings
SWOT

15.9 GFS Chemicals Inc.

GFS Chemicals Inc. - Overview
GFS Chemicals Inc. - Product / Service
GFS Chemicals Inc. - Key offerings
SWOT

15.10 Labsert Ltd

Labsert Ltd - Overview
Labsert Ltd - Product / Service
Labsert Ltd - Key offerings
SWOT

15.11 LGC Ltd.

LGC Ltd. - Overview
LGC Ltd. - Product / Service
LGC Ltd. - Key offerings
SWOT

15.12 PerkinElmer US LLC

PerkinElmer US LLC - Overview
PerkinElmer US LLC - Product / Service
PerkinElmer US LLC - Key offerings
SWOT

15.13 Reagecon Diagnostics Ltd.

Reagecon Diagnostics Ltd. - Overview
Reagecon Diagnostics Ltd. - Product / Service
Reagecon Diagnostics Ltd. - Key offerings
SWOT

15.14 Restek Corp.

Restek Corp. - Overview
Restek Corp. - Product / Service
Restek Corp. - Key offerings
SWOT

15.15 Sigma Aldrich Chemicals Ltd.

Sigma Aldrich Chemicals Ltd. - Overview
Sigma Aldrich Chemicals Ltd. - Product / Service
Sigma Aldrich Chemicals Ltd. - Key offerings
SWOT

15.16 Thermo Fisher Scientific Inc.

Thermo Fisher Scientific Inc. - Overview
Thermo Fisher Scientific Inc. - Business segments
Thermo Fisher Scientific Inc. - Key news
Thermo Fisher Scientific Inc. - Key offerings
Thermo Fisher Scientific Inc. - Segment focus
SWOT

15.17 Tokyo Chemical Industry Co.

Tokyo Chemical Industry Co. - Overview
Tokyo Chemical Industry Co. - Product / Service
Tokyo Chemical Industry Co. - Key offerings
SWOT

15.18 Waters Corp.

Waters Corp. - Overview
Waters Corp. - Business segments
Waters Corp. - Key offerings
Waters Corp. - Segment focus
SWOT

16. Appendix

16.1 Scope of the report

Market definition
Objectives
Notes and caveats

16.2 Inclusions and exclusions checklist

Inclusions checklist
Exclusions checklist

16.3 Currency conversion rates for US$

16.4 Research methodology

16.5 Data procurement

Information sources

16.6 Data validation

16.7 Validation techniques employed for market sizing

16.8 Data synthesis

16.9 360 degree market analysis

16.10 List of abbreviations

Research Methodology

Technavio presents a detailed picture of the market by way of study, synthesis, and summation of data from multiple sources. The analysts have presented the various facets of the market with a particular focus on identifying the key industry influencers. The data thus presented is comprehensive, reliable, and the result of extensive research, both primary and secondary.

INFORMATION SOURCES

Primary sources

  • Manufacturers and suppliers
  • Channel partners
  • Industry experts
  • Strategic decision makers

Secondary sources

  • Industry journals and periodicals
  • Government data
  • Financial reports of key industry players
  • Historical data
  • Press releases

DATA ANALYSIS

Data Synthesis

  • Collation of data
  • Estimation of key figures
  • Analysis of derived insights

Data Validation

  • Triangulation with data models
  • Reference against proprietary databases
  • Corroboration with industry experts

REPORT WRITING

Qualitative

  • Market drivers
  • Market challenges
  • Market trends
  • Five forces analysis

Quantitative

  • Market size and forecast
  • Market segmentation
  • Geographical insights
  • Competitive landscape

Interested in this report?

Get your sample now to see our research methodology and insights!

Download Now

Frequently Asked Questions

Analytical Standards market growth will increase by USD 793357.3 thousand thousand during 2026-2030.

The Analytical Standards market is expected to grow at a CAGR of 7.2% during 2026-2030.

Analytical Standards market is segmented by Type (Chromatography, Spectroscopy, Physical properties testing, Titrimetry) Application (Food and beverages, Pharmaceuticals and life sciences, Environmental, Others) Methodology (Bioanalytical testing, Raw material testing, Stability testing, Dissolution testing, Others)

AccuStandard Inc., Agilent Technologies Inc., Alfa Chemistry, Biosynth Ltd., Campro Scientific GmbH, Cayman Chemical Co., Chiron AS, CPI International, Crescent Chemical Co. Inc., GFS Chemicals Inc., HPC Standards GmbH, Labsert Ltd, LGC Ltd., PerkinElmer US LLC, Reagecon Diagnostics Ltd., Restek Corp., Sigma Aldrich Chemicals Ltd., Thermo Fisher Scientific Inc., Tokyo Chemical Industry Co., Waters Corp., Wellington Laboratories Inc. are a few of the key vendors in the Analytical Standards market.

North America will register the highest growth rate of 44.7% among the other regions. Therefore, the Analytical Standards market in North America is expected to garner significant business opportunities for the vendors during the forecast period.

US, Canada, Mexico, Germany, UK, France, Italy, Spain, The Netherlands, China, Japan, India, South Korea, Australia, Indonesia, Brazil, Argentina, Chile, Saudi Arabia, UAE, South Africa, Israel, Turkey

  • Rapid growth in life science industry is the driving factor this market.

The Analytical Standards market vendors should focus on grabbing business opportunities from the Type segment as it accounted for the largest market share in the base year.
RIA - Research AI Assistant
Ask RIA
