
Aggregates Market Analysis, Size, and Forecast 2026-2030: APAC (China, India, and Japan), Europe (Germany, UK, and France), North America (US, Canada, and Mexico), Middle East and Africa (Saudi Arabia, UAE, and South Africa), South America (Brazil, Argentina, and Chile), and Rest of World (ROW)

Aggregates Market Analysis, Size, and Forecast 2026-2030:
APAC (China, India, and Japan), Europe (Germany, UK, and France), North America (US, Canada, and Mexico), Middle East and Africa (Saudi Arabia, UAE, and South Africa), South America (Brazil, Argentina, and Chile), and Rest of World (ROW)

Published: Nov 2026 303 Pages SKU: IRTNTR71614

Market Overview at a Glance

$74.54 B
Market Opportunity
5.8%
CAGR 2025 - 2030
56.7%
APAC Growth
$140.08 B
Concrete segment 2024

Aggregates Market Size 2026-2030

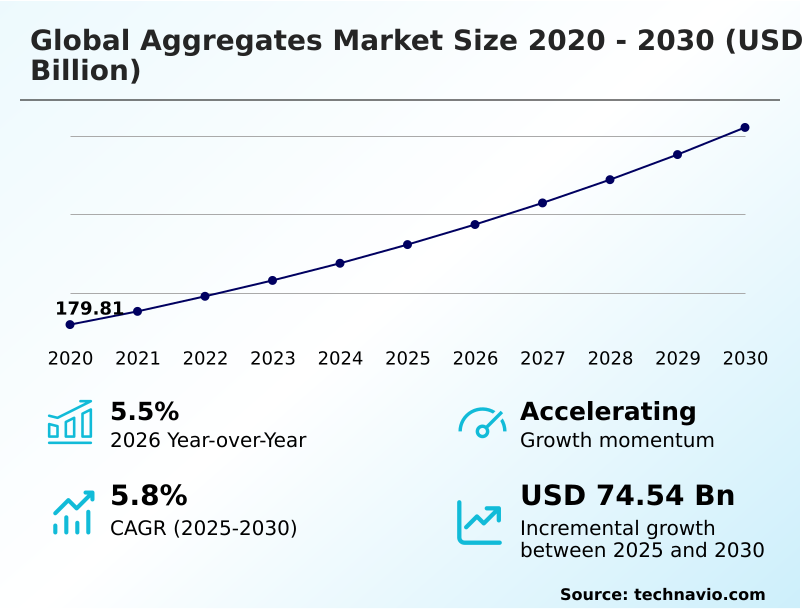
The aggregates market size is valued to increase by USD 74.54 billion, at a CAGR of 5.8% from 2025 to 2030. Growing infrastructure modernization and public works investments will drive the aggregates market.

Major Market Trends & Insights

  • APAC dominated the market and accounted for a 56.7% growth during the forecast period.
  • By Application - Concrete segment was valued at USD 140.08 billion in 2024
  • By Product - Crushed stone segment accounted for the largest market revenue share in 2024

Market Size & Forecast

  • Market Opportunities: USD 125.45 billion
  • Market Future Opportunities: USD 74.54 billion
  • CAGR from 2025 to 2030 : 5.8%

Market Summary

  • The Aggregates Market functions as the foundational supply chain for modern infrastructure, relying heavily on the continuous extraction and processing of granular materials. Expanding urbanization and infrastructure modernization serve as the primary drivers, as governments heavily invest in transportation networks and residential housing construction.
  • For instance, operators deploying automated aggregate screening systems have accelerated processing workflows, yielding a 20% improvement in daily output compared to traditional manual sorting operations. This operational efficiency directly supports the high-volume material demands of large-scale commercial developments.
  • Conversely, raw material transportation logistics remain a formidable challenge, as the considerable distances between quarry sites and urban construction zones inflate fuel consumption and delay delivery schedules. The resulting supply bottlenecks complicate inventory management for ready-mix concrete producers and highway contractors.
  • By integrating digital fleet management and optimizing extraction methodologies, aggregate suppliers can mitigate these logistical constraints while maintaining strict adherence to engineering specifications and environmental compliance standards.

What will be the Size of the Aggregates Market during the forecast period?
Get Key Insights on Market Forecast (PDF) Get Free Sample

How is the Aggregates Market Segmented?

The aggregates industry research report provides comprehensive data (region-wise segment analysis), with forecasts and estimates in "USD million" for the period 2026-2030, as well as historical data from 2020-2024 for the following segments.

  • Application
    • Concrete
    • Road base and coverings
    • Others
  • Product
    • Crushed stone
    • Sand and gravel
    • Others
  • End-user
    • Residential
    • Commercial
    • Industrial
  • Geography
    • APAC
      • China
      • India
      • Japan
      • South Korea
      • Indonesia
      • Australia
    • Europe
      • Germany
      • UK
      • France
      • Italy
      • Spain
      • The Netherlands
    • North America
      • US
      • Canada
      • Mexico
    • Middle East and Africa
      • Saudi Arabia
      • UAE
      • South Africa
      • Turkey
      • Israel
    • South America
      • Brazil
      • Argentina
      • Chile

By Application Insights

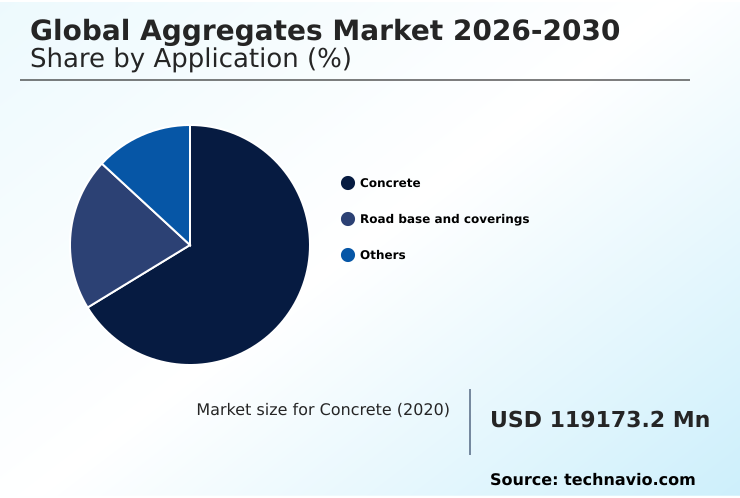
The concrete segment is estimated to witness significant growth during the forecast period.

The concrete segment dictates consumption patterns across the Aggregates Market as construction firms increasingly prioritize optimized formulations for structural applications. Integrating advanced crushed stone processing into concrete production inputs enhances the durability of commercial and residential structures.

Contractors utilizing high-performance concrete materials have recorded structural foundation materials defect reductions of up to 15%, significantly improving project lifecycle efficiency. Efficient construction aggregate handling ensures that exact particle size distributions are maintained, preventing segregation during transit and mixing.

The continuous reliance on exact aggregate proportions maximizes load-bearing capacity and workability in demanding environments.

This material dependence solidifies concrete as a central driver of material extraction, prompting quarry operators to refine their grading and washing processes to meet stringent engineering specifications without inflating operational costs.
Get Free Sample

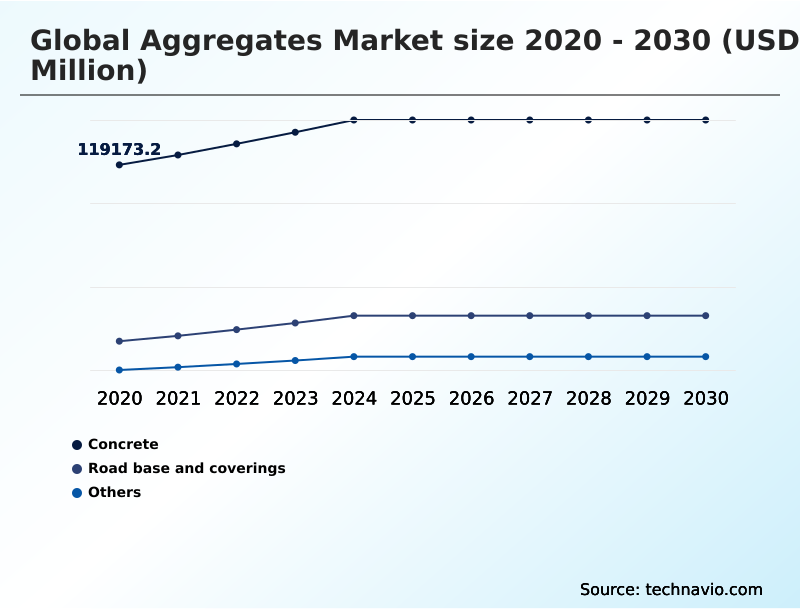
The Concrete segment was valued at USD 140.08 billion in 2024 and showed a gradual increase during the forecast period.
Get Free Sample

Regional Analysis

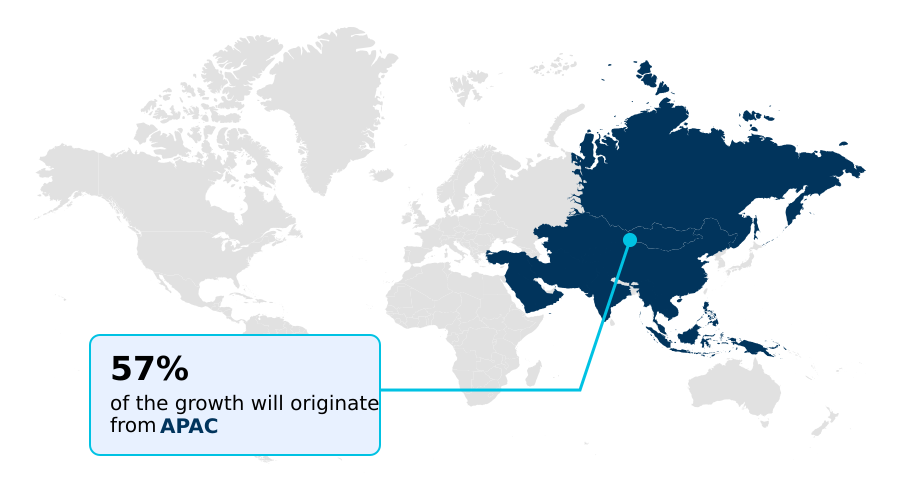
APAC is estimated to contribute 56.7% to the growth of the global market during the forecast period.Technavio’s analysts have elaborately explained the regional trends and drivers that shape the market during the forecast period.
See How Aggregates Market Demand is Rising in APAC Get Free Sample

The Aggregates Market exhibits distinct regional consumption patterns driven by localized infrastructure demands and regulatory frameworks. APAC commands the highest material throughput, where rapid transportation network expansion requires massive volumes of structural foundation materials.

Operators in this region have improved heavy earthworks support efficiency by 22% through scaled-up extraction. In contrast, Europe prioritizes strict quarry permitting regulations and environmental sustainability, focusing heavily on recycled aggregate integration.

Consequently, European producers have achieved a 35% higher adoption rate of secondary aggregate recovery compared to APAC counterparts, effectively reducing primary resource dependency.

North America balances these approaches, enhancing pavement structural layers with advanced aggregate sorting technology that cuts material waste by 15%.

By adjusting supply chain strategies to fit these regional regulatory and developmental profiles, aggregate suppliers maintain consistent profitability while addressing localized civil engineering requirements.

Market Dynamics

Our researchers analyzed the data with 2025 as the base year, along with the key drivers, trends, and challenges. A holistic analysis of drivers will help companies refine their marketing strategies to gain a competitive advantage.

  • Optimizing material extraction and processing workflows is a strategic imperative within the Aggregates Market, heavily influencing downstream construction efficiency. Facilities processing crushed stone for concrete production must maintain rigorous particle size distribution standards to ensure structural integrity in high-rise and commercial applications.
  • Simultaneously, the industry is witnessing a strong transition toward recycled aggregate integration in pavements, a practice that reduces raw material dependency and lowers project carbon footprints. Operators implementing sustainable aggregate extraction and processing frameworks have realized an estimated 25% reduction in energy consumption compared to conventional operations, directly improving environmental compliance and operational margins.
  • The deployment of mobile crushing plants for quarrying enables extraction teams to process materials closer to the blast face, effectively minimizing internal hauling distances and lowering diesel consumption. Furthermore, advanced aggregate screening for structural foundations ensures that only accurately graded materials reach the mixing plants, eliminating the need for secondary processing at the construction site.
  • This precise material handling aligns production capabilities with complex civil engineering requirements. By integrating these optimized processes across the supply chain, aggregate producers enhance their competitive positioning, reduce operational bottlenecks, and support the continuous development of resilient public and private infrastructure.
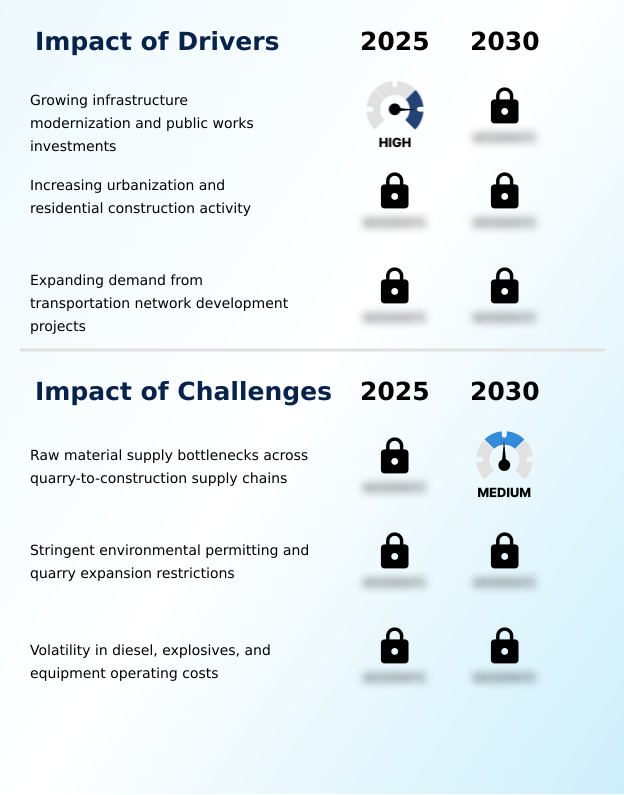
What are the key market drivers leading to the rise in the adoption of Aggregates Industry?

  • Growing infrastructure modernization and public works investments serve as a fundamental catalyst expanding the continuous demand for essential construction materials.

  • Accelerated public infrastructure modernization and extensive urban development act as the primary catalysts propelling the Aggregates Market. Expanding transportation networks require massive volumes of precisely engineered materials for sub-base material layering and pavement execution.
  • Because governments are enforcing stricter durability standards on public works, contractors are increasing their reliance on high-quality asphalt mixture aggregates.
  • The implementation of modern ballast stone processing techniques has reduced railway maintenance downtime by 30%, significantly extending the operational lifespan of transit corridors.
  • Furthermore, optimizing ready-mix concrete aggregates formulation has lowered overall material waste by 12% across large commercial build sites.
  • Enhancing material stockpiling efficiency allows quarry operators to streamline loading operations, accelerating truck turnaround times by 20% and ensuring uninterrupted material flow to critical infrastructure projects.

What are the market trends shaping the Aggregates Industry?

  • Advancing digital quarry management and data-driven operations represents a critical shift in material extraction practices. This technological integration optimizes production efficiency and enhances supply chain visibility across extraction facilities.

  • The Aggregates Market is aggressively adopting digital automation and circular economy principles to optimize material workflows. Quarry operators are transitioning toward sophisticated aggregate screening systems that analyze material quality in real time. This technological adoption stems from the need to meet tighter structural specifications while mitigating labor shortages.
  • Implementing advanced gravel grading technology has improved forecast accuracy regarding material yield by 18%, allowing producers to align output closely with contractor demand. Simultaneously, the integration of construction demolition recycling has revolutionized secondary material supply chains, reducing landfill waste disposal costs by 28%.
  • As developers increasingly mandate sustainable materials, aggregate conveying systems are being upgraded to handle diverse recycled inputs without compromising throughput speed. These operational shifts ensure that aggregate moisture control is maintained consistently, effectively decreasing drying cycle times by 15% and lowering total energy expenditure for processing facilities.

What challenges does the Aggregates Industry face during its growth?

  • Raw material supply bottlenecks across quarry-to-construction supply chains present a significant operational constraint limiting efficient project execution.

  • Logistical inefficiencies and stringent environmental permitting severely constrain output within the Aggregates Market. Transporting heavy materials over expanding distances drastically inflates freight expenses. Because urban expansion rapidly depletes local reserves, operators must relocate limestone processing operations to remote locations, resulting in transportation fuel costs rising by 25%.
  • Additionally, rigid compliance standards regarding quarry dust suppression compel producers to install expensive filtration infrastructure, reducing immediate operational capital by 15%. Adapting granite extraction techniques to meet local noise ordinances further limits blasting windows, decreasing daily extraction yields by 18%.
  • These compounding structural limitations complicate inventory forecasting, forcing producers to restructure their mobile crushing plants networks to maintain localized supply chain stability.

Exclusive Technavio Analysis on Customer Landscape

The aggregates market forecasting report includes the adoption lifecycle of the market, covering from the innovator’s stage to the laggard’s stage. It focuses on adoption rates in different regions based on penetration. Furthermore, the aggregates market report also includes key purchase criteria and drivers of price sensitivity to help companies evaluate and develop their market growth analysis strategies.
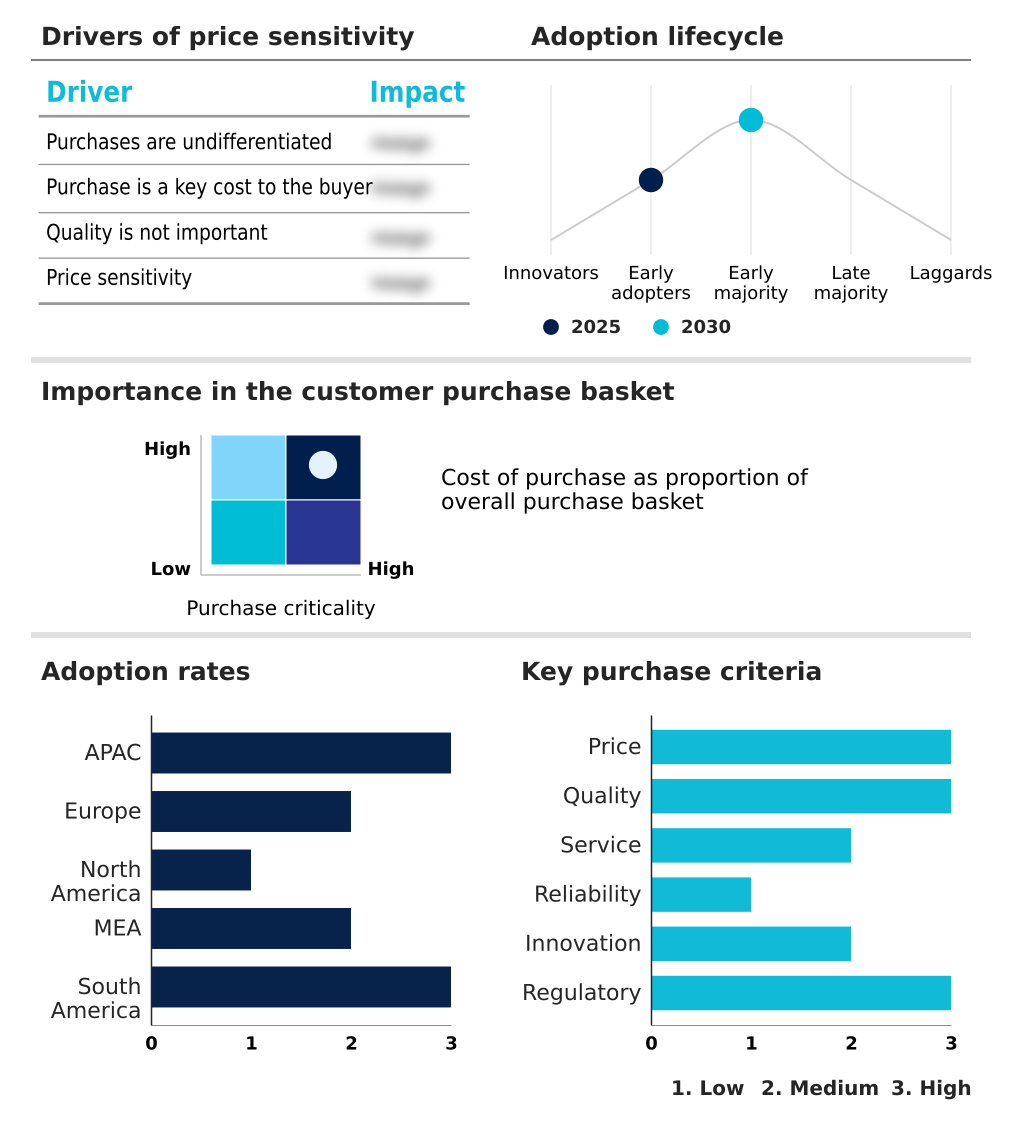
Customer Landscape of Aggregates Industry

Competitive Landscape

Companies are implementing various strategies, such as strategic alliances, aggregates market forecast, partnerships, mergers and acquisitions, geographical expansion, and product/service launches, to enhance their presence in the industry.

Argos Ltd. - The company provides advanced crushing and screening solutions for construction materials, enhancing aggregate production efficiency while ensuring compliance with stringent structural specifications and sustainable material recovery targets.

The industry research and growth report includes detailed analyses of the competitive landscape of the market and information about key companies, including:

  • Argos Ltd.
  • Boral Ltd.
  • Breedon Group plc
  • Buzzi SpA
  • Carmeuse SA
  • CEMEX SAB de CV
  • Colas SA
  • CRH Plc
  • Fisher Sand and Gravel Co.
  • Granite Construction Inc.
  • Heidelberg Materials AG
  • Holcim Ltd.
  • Irving Materials Inc.
  • Knife River Corp.
  • LSR Group
  • Martin Marietta Materials Inc.
  • Summit Materials Inc.
  • Taiheiyo Cement Corp.
  • Tarmac Holdings Ltd.
  • Titan SA
  • Vicat S.A.
  • Votorantim SA
  • Vulcan Materials Co.

Qualitative and quantitative analysis of companies has been conducted to help clients understand the wider business environment as well as the strengths and weaknesses of key industry players. Data is qualitatively analyzed to categorize companies as pure play, category-focused, industry-focused, and diversified; it is quantitatively analyzed to categorize companies as dominant, leading, strong, tentative, and weak.

Recent Development and News in Aggregates market

  • In the Construction Materials industry, the implementation of stringent quarry environmental compliance frameworks across Europe restricted natural resource extraction, directly impacting Aggregates Market demand by accelerating the adoption of sustainable extraction practices and increasing secondary aggregate recovery rates by 22%.
  • The transition toward smart quarry management and predictive quarry maintenance within heavy industrial facility earthworks reduced unexpected equipment downtime, optimizing aggregate logistics efficiency and boosting overall aggregate production benchmarking yields by 15% across major extraction sites.
  • Urban redevelopment aggregates usage shifted as developers mandated high-performance concrete materials for residential foundation materials, driving a 18% increase in demand for mechanically processed limestone and specialized drainage system aggregates.
  • Highway pavement resurfacing initiatives prioritizing civil engineering materials durability stimulated the expansion of construction material ecosystems, elevating the consumption of road base construction aggregates and extending transportation network expansion lifespans by approximately 30%.

Dive into Technavio’s robust research methodology, blending expert interviews, extensive data synthesis, and validated models for unparalleled Aggregates Market insights. See full methodology.

Market Scope
Page number 303
Base year 2025
Historic period 2020-2024
Forecast period 2026-2030
Growth momentum & CAGR Accelerate at a CAGR of 5.8%
Market growth 2026-2030 USD 74541.9 million
Market structure Fragmented
YoY growth 2025-2026(%) 5.5%
Key countries China, India, Japan, South Korea, Indonesia, Australia, Germany, UK, France, Italy, Spain, The Netherlands, US, Canada, Mexico, Saudi Arabia, UAE, South Africa, Turkey, Israel, Brazil, Argentina and Chile
Competitive landscape Leading Companies, Market Positioning of Companies, Competitive Strategies, and Industry Risks

Request Free Sample

Research Analyst Overview

  • The Aggregates Market is undergoing a structural transformation as operators increasingly align extraction methodologies with stringent engineering tolerances. Strategic decision-makers are aggressively prioritizing aggregate sorting technology to enhance product consistency and meet rigid compliance mandates for structural applications. This shift directly influences capital allocation, pushing investments toward advanced aggregate washing equipment and mechanical crushing circuits.
  • Facilities utilizing automated primary crushing stations have achieved a 30% reduction in processing time compared to manual configurations, significantly accelerating material throughput. Sand extraction methods are simultaneously evolving to minimize water consumption and environmental disruption. The precise calibration of aggregate size distribution ensures optimal load-bearing capacity for concrete applications, reducing material rejection rates.
  • Tertiary crushing circuits now incorporate predictive maintenance sensors, allowing site managers to optimize wear part replacement schedules and stabilize production volumes. These operational enhancements mitigate supply bottlenecks and safeguard profit margins against volatile energy costs. Ultimately, integrating intelligent processing hardware allows aggregate producers to consistently fulfill high-volume infrastructure demands while maintaining strict adherence to environmental and structural performance standards.

What are the Key Data Covered in this Aggregates Market Research and Growth Report?

  • What is the expected growth of the Aggregates Market between 2026 and 2030?

    • USD 74.54 billion, at a CAGR of 5.8%

  • What segmentation does the market report cover?

    • The report is segmented by Application (Concrete, Road base and coverings, and Others), Product (Crushed stone, Sand and gravel, and Others), End-user (Residential, Commercial, and Industrial) and Geography (APAC, Europe, North America, Middle East and Africa, South America)

  • Which regions are analyzed in the report?

    • APAC, Europe, North America, Middle East and Africa and South America

  • What are the key growth drivers and market challenges?

    • Growing infrastructure modernization and public works investments, Raw material supply bottlenecks across quarry-to-construction supply chains

  • Who are the major players in the Aggregates Market?

    • Argos Ltd., Boral Ltd., Breedon Group plc, Buzzi SpA, Carmeuse SA, CEMEX SAB de CV, Colas SA, CRH Plc, Fisher Sand and Gravel Co., Granite Construction Inc., Heidelberg Materials AG, Holcim Ltd., Irving Materials Inc., Knife River Corp., LSR Group, Martin Marietta Materials Inc., Summit Materials Inc., Taiheiyo Cement Corp., Tarmac Holdings Ltd., Titan SA, Vicat S.A., Votorantim SA and Vulcan Materials Co.

Market Research Insights

  • The Aggregates Market is rapidly evolving as civil engineering materials face stricter performance criteria. By optimizing the aggregate supply chain, producers have enhanced aggregate logistics efficiency, reducing transit delays by 18%. The integration of smart quarry management systems has further improved predictive quarry maintenance, cutting unexpected equipment downtime by 25% and stabilizing material output.
  • Concurrently, the push for sustainable extraction practices has increased the utilization of recycled materials in road base construction by 30%, lowering overall environmental impact. These measurable operational shifts enable construction material ecosystems to function with greater precision, ensuring consistent delivery of high-quality inputs for critical infrastructure and urban development projects.

We can help! Our analysts can customize this aggregates market research report to meet your requirements.

Get in touch

1. Executive Summary

1.1 Market overview

Executive Summary - Chart on Market Overview
Executive Summary - Data Table on Market Overview
Executive Summary - Chart on Global Market Characteristics
Executive Summary - Chart on Market by Geography
Executive Summary - Chart on Market Segmentation by Application
Executive Summary - Chart on Market Segmentation by Product
Executive Summary - Chart on Market Segmentation by End-user
Executive Summary - Chart on Incremental Growth
Executive Summary - Data Table on Incremental Growth
Executive Summary - Chart on Company Market Positioning

2. Technavio Analysis

2.1 Analysis of price sensitivity, lifecycle, customer purchase basket, adoption rates, and purchase criteria

2.2 Criticality of inputs and Factors of differentiation

Chart on Overview on criticality of inputs and factors of differentiation

2.3 Factors of disruption

Chart on Overview on factors of disruption

2.4 Impact of drivers and challenges

Chart on Impact of drivers and challenges in 2025 and 2030

3. Market Landscape

3.1 Market ecosystem

Chart on Parent Market
Data Table on - Parent Market

3.2 Market characteristics

Chart on Market characteristics analysis

3.3 Value chain analysis

Chart on Value chain analysis

4. Market Sizing

4.1 Market definition

Data Table on Offerings of companies included in the market definition

4.2 Market segment analysis

Market segments

4.3 Market size 2025

4.4 Market outlook: Forecast for 2025-2030

Chart on Global - Market size and forecast 2025-2030 ($ million)
Data Table on Global - Market size and forecast 2025-2030 ($ million)
Chart on Global Market: Year-over-year growth 2025-2030 (%)
Data Table on Global Market: Year-over-year growth 2025-2030 (%)

5. Historic Market Size

5.1 Global Aggregates Market 2020 - 2024

Historic Market Size - Data Table on Global Aggregates Market 2020 - 2024 ($ million)

5.2 Application segment analysis 2020 - 2024

Historic Market Size - Application Segment 2020 - 2024 ($ million)

5.3 Product segment analysis 2020 - 2024

Historic Market Size - Product Segment 2020 - 2024 ($ million)

5.4 End-user segment analysis 2020 - 2024

Historic Market Size - End-user Segment 2020 - 2024 ($ million)

5.5 Geography segment analysis 2020 - 2024

Historic Market Size - Geography Segment 2020 - 2024 ($ million)

5.6 Country segment analysis 2020 - 2024

Historic Market Size - Country Segment 2020 - 2024 ($ million)

6. Qualitative Analysis

6.1 Impact of AI on global aggregates market

6.2 Impact of geopolitical conflicts on global aggregates market

7. Five Forces Analysis

7.1 Five forces summary

Five forces analysis - Comparison between 2025 and 2030

7.2 Bargaining power of buyers

Bargaining power of buyers - Impact of key factors 2025 and 2030

7.3 Bargaining power of suppliers

Bargaining power of suppliers - Impact of key factors in 2025 and 2030

7.4 Threat of new entrants

Threat of new entrants - Impact of key factors in 2025 and 2030

7.5 Threat of substitutes

Threat of substitutes - Impact of key factors in 2025 and 2030

7.6 Threat of rivalry

Threat of rivalry - Impact of key factors in 2025 and 2030

7.7 Market condition

Chart on Market condition - Five forces 2025 and 2030

8. Market Segmentation by Application

8.1 Market segments

Chart on Application - Market share 2025-2030 (%)
Data Table on Application - Market share 2025-2030 (%)

8.2 Comparison by Application

Chart on Comparison by Application
Data Table on Comparison by Application

8.3 Concrete - Market size and forecast 2025-2030

Chart on Concrete - Market size and forecast 2025-2030 ($ million)
Data Table on Concrete - Market size and forecast 2025-2030 ($ million)
Chart on Concrete - Year-over-year growth 2025-2030 (%)
Data Table on Concrete - Year-over-year growth 2025-2030 (%)

8.4 Road base and coverings - Market size and forecast 2025-2030

Chart on Road base and coverings - Market size and forecast 2025-2030 ($ million)
Data Table on Road base and coverings - Market size and forecast 2025-2030 ($ million)
Chart on Road base and coverings - Year-over-year growth 2025-2030 (%)
Data Table on Road base and coverings - Year-over-year growth 2025-2030 (%)

8.5 Others - Market size and forecast 2025-2030

Chart on Others - Market size and forecast 2025-2030 ($ million)
Data Table on Others - Market size and forecast 2025-2030 ($ million)
Chart on Others - Year-over-year growth 2025-2030 (%)
Data Table on Others - Year-over-year growth 2025-2030 (%)

8.6 Market opportunity by Application

Market opportunity by Application ($ million)
Data Table on Market opportunity by Application ($ million)

9. Market Segmentation by Product

9.1 Market segments

Chart on Product - Market share 2025-2030 (%)
Data Table on Product - Market share 2025-2030 (%)

9.2 Comparison by Product

Chart on Comparison by Product
Data Table on Comparison by Product

9.3 Crushed stone - Market size and forecast 2025-2030

Chart on Crushed stone - Market size and forecast 2025-2030 ($ million)
Data Table on Crushed stone - Market size and forecast 2025-2030 ($ million)
Chart on Crushed stone - Year-over-year growth 2025-2030 (%)
Data Table on Crushed stone - Year-over-year growth 2025-2030 (%)

9.4 Sand and gravel - Market size and forecast 2025-2030

Chart on Sand and gravel - Market size and forecast 2025-2030 ($ million)
Data Table on Sand and gravel - Market size and forecast 2025-2030 ($ million)
Chart on Sand and gravel - Year-over-year growth 2025-2030 (%)
Data Table on Sand and gravel - Year-over-year growth 2025-2030 (%)

9.5 Others - Market size and forecast 2025-2030

Chart on Others - Market size and forecast 2025-2030 ($ million)
Data Table on Others - Market size and forecast 2025-2030 ($ million)
Chart on Others - Year-over-year growth 2025-2030 (%)
Data Table on Others - Year-over-year growth 2025-2030 (%)

9.6 Market opportunity by Product

Market opportunity by Product ($ million)
Data Table on Market opportunity by Product ($ million)

10. Market Segmentation by End-user

10.1 Market segments

Chart on End-user - Market share 2025-2030 (%)
Data Table on End-user - Market share 2025-2030 (%)

10.2 Comparison by End-user

Chart on Comparison by End-user
Data Table on Comparison by End-user

10.3 Residential - Market size and forecast 2025-2030

Chart on Residential - Market size and forecast 2025-2030 ($ million)
Data Table on Residential - Market size and forecast 2025-2030 ($ million)
Chart on Residential - Year-over-year growth 2025-2030 (%)
Data Table on Residential - Year-over-year growth 2025-2030 (%)

10.4 Commercial - Market size and forecast 2025-2030

Chart on Commercial - Market size and forecast 2025-2030 ($ million)
Data Table on Commercial - Market size and forecast 2025-2030 ($ million)
Chart on Commercial - Year-over-year growth 2025-2030 (%)
Data Table on Commercial - Year-over-year growth 2025-2030 (%)

10.5 Industrial - Market size and forecast 2025-2030

Chart on Industrial - Market size and forecast 2025-2030 ($ million)
Data Table on Industrial - Market size and forecast 2025-2030 ($ million)
Chart on Industrial - Year-over-year growth 2025-2030 (%)
Data Table on Industrial - Year-over-year growth 2025-2030 (%)

10.6 Market opportunity by End-user

Market opportunity by End-user ($ million)
Data Table on Market opportunity by End-user ($ million)

11. Customer Landscape

11.1 Customer landscape overview

Analysis of price sensitivity, lifecycle, customer purchase basket, adoption rates, and purchase criteria

12. Geographic Landscape

12.1 Geographic segmentation

Chart on Market share by geography 2025-2030 (%)
Data Table on Market share by geography 2025-2030 (%)

12.2 Geographic comparison

Chart on Geographic comparison
Data Table on Geographic comparison

12.3 APAC - Market size and forecast 2025-2030

Chart on APAC - Market size and forecast 2025-2030 ($ million)
Data Table on APAC - Market size and forecast 2025-2030 ($ million)
Chart on APAC - Year-over-year growth 2025-2030 (%)
Data Table on APAC - Year-over-year growth 2025-2030 (%)
Chart on Regional Comparison - APAC
Data Table on Regional Comparison - APAC

12.3.1 China - Market size and forecast 2025-2030

Chart on China - Market size and forecast 2025-2030 ($ million)
Data Table on China - Market size and forecast 2025-2030 ($ million)
Chart on China - Year-over-year growth 2025-2030 (%)
Data Table on China - Year-over-year growth 2025-2030 (%)

12.3.2 India - Market size and forecast 2025-2030

Chart on India - Market size and forecast 2025-2030 ($ million)
Data Table on India - Market size and forecast 2025-2030 ($ million)
Chart on India - Year-over-year growth 2025-2030 (%)
Data Table on India - Year-over-year growth 2025-2030 (%)

12.3.3 Japan - Market size and forecast 2025-2030

Chart on Japan - Market size and forecast 2025-2030 ($ million)
Data Table on Japan - Market size and forecast 2025-2030 ($ million)
Chart on Japan - Year-over-year growth 2025-2030 (%)
Data Table on Japan - Year-over-year growth 2025-2030 (%)

12.3.4 South Korea - Market size and forecast 2025-2030

Chart on South Korea - Market size and forecast 2025-2030 ($ million)
Data Table on South Korea - Market size and forecast 2025-2030 ($ million)
Chart on South Korea - Year-over-year growth 2025-2030 (%)
Data Table on South Korea - Year-over-year growth 2025-2030 (%)

12.3.5 Indonesia - Market size and forecast 2025-2030

Chart on Indonesia - Market size and forecast 2025-2030 ($ million)
Data Table on Indonesia - Market size and forecast 2025-2030 ($ million)
Chart on Indonesia - Year-over-year growth 2025-2030 (%)
Data Table on Indonesia - Year-over-year growth 2025-2030 (%)

12.3.6 Australia - Market size and forecast 2025-2030

Chart on Australia - Market size and forecast 2025-2030 ($ million)
Data Table on Australia - Market size and forecast 2025-2030 ($ million)
Chart on Australia - Year-over-year growth 2025-2030 (%)
Data Table on Australia - Year-over-year growth 2025-2030 (%)

12.4 Europe - Market size and forecast 2025-2030

Chart on Europe - Market size and forecast 2025-2030 ($ million)
Data Table on Europe - Market size and forecast 2025-2030 ($ million)
Chart on Europe - Year-over-year growth 2025-2030 (%)
Data Table on Europe - Year-over-year growth 2025-2030 (%)
Chart on Regional Comparison - Europe
Data Table on Regional Comparison - Europe

12.4.1 Germany - Market size and forecast 2025-2030

Chart on Germany - Market size and forecast 2025-2030 ($ million)
Data Table on Germany - Market size and forecast 2025-2030 ($ million)
Chart on Germany - Year-over-year growth 2025-2030 (%)
Data Table on Germany - Year-over-year growth 2025-2030 (%)

12.4.2 UK - Market size and forecast 2025-2030

Chart on UK - Market size and forecast 2025-2030 ($ million)
Data Table on UK - Market size and forecast 2025-2030 ($ million)
Chart on UK - Year-over-year growth 2025-2030 (%)
Data Table on UK - Year-over-year growth 2025-2030 (%)

12.4.3 France - Market size and forecast 2025-2030

Chart on France - Market size and forecast 2025-2030 ($ million)
Data Table on France - Market size and forecast 2025-2030 ($ million)
Chart on France - Year-over-year growth 2025-2030 (%)
Data Table on France - Year-over-year growth 2025-2030 (%)

12.4.4 Italy - Market size and forecast 2025-2030

Chart on Italy - Market size and forecast 2025-2030 ($ million)
Data Table on Italy - Market size and forecast 2025-2030 ($ million)
Chart on Italy - Year-over-year growth 2025-2030 (%)
Data Table on Italy - Year-over-year growth 2025-2030 (%)

12.4.5 Spain - Market size and forecast 2025-2030

Chart on Spain - Market size and forecast 2025-2030 ($ million)
Data Table on Spain - Market size and forecast 2025-2030 ($ million)
Chart on Spain - Year-over-year growth 2025-2030 (%)
Data Table on Spain - Year-over-year growth 2025-2030 (%)

12.4.6 The Netherlands - Market size and forecast 2025-2030

Chart on The Netherlands - Market size and forecast 2025-2030 ($ million)
Data Table on The Netherlands - Market size and forecast 2025-2030 ($ million)
Chart on The Netherlands - Year-over-year growth 2025-2030 (%)
Data Table on The Netherlands - Year-over-year growth 2025-2030 (%)

12.5 North America - Market size and forecast 2025-2030

Chart on North America - Market size and forecast 2025-2030 ($ million)
Data Table on North America - Market size and forecast 2025-2030 ($ million)
Chart on North America - Year-over-year growth 2025-2030 (%)
Data Table on North America - Year-over-year growth 2025-2030 (%)
Chart on Regional Comparison - North America
Data Table on Regional Comparison - North America

12.5.1 US - Market size and forecast 2025-2030

Chart on US - Market size and forecast 2025-2030 ($ million)
Data Table on US - Market size and forecast 2025-2030 ($ million)
Chart on US - Year-over-year growth 2025-2030 (%)
Data Table on US - Year-over-year growth 2025-2030 (%)

12.5.2 Canada - Market size and forecast 2025-2030

Chart on Canada - Market size and forecast 2025-2030 ($ million)
Data Table on Canada - Market size and forecast 2025-2030 ($ million)
Chart on Canada - Year-over-year growth 2025-2030 (%)
Data Table on Canada - Year-over-year growth 2025-2030 (%)

12.5.3 Mexico - Market size and forecast 2025-2030

Chart on Mexico - Market size and forecast 2025-2030 ($ million)
Data Table on Mexico - Market size and forecast 2025-2030 ($ million)
Chart on Mexico - Year-over-year growth 2025-2030 (%)
Data Table on Mexico - Year-over-year growth 2025-2030 (%)

12.6 Middle East and Africa - Market size and forecast 2025-2030

Chart on Middle East and Africa - Market size and forecast 2025-2030 ($ million)
Data Table on Middle East and Africa - Market size and forecast 2025-2030 ($ million)
Chart on Middle East and Africa - Year-over-year growth 2025-2030 (%)
Data Table on Middle East and Africa - Year-over-year growth 2025-2030 (%)
Chart on Regional Comparison - Middle East and Africa
Data Table on Regional Comparison - Middle East and Africa

12.6.1 Saudi Arabia - Market size and forecast 2025-2030

Chart on Saudi Arabia - Market size and forecast 2025-2030 ($ million)
Data Table on Saudi Arabia - Market size and forecast 2025-2030 ($ million)
Chart on Saudi Arabia - Year-over-year growth 2025-2030 (%)
Data Table on Saudi Arabia - Year-over-year growth 2025-2030 (%)

12.6.2 UAE - Market size and forecast 2025-2030

Chart on UAE - Market size and forecast 2025-2030 ($ million)
Data Table on UAE - Market size and forecast 2025-2030 ($ million)
Chart on UAE - Year-over-year growth 2025-2030 (%)
Data Table on UAE - Year-over-year growth 2025-2030 (%)

12.6.3 South Africa - Market size and forecast 2025-2030

Chart on South Africa - Market size and forecast 2025-2030 ($ million)
Data Table on South Africa - Market size and forecast 2025-2030 ($ million)
Chart on South Africa - Year-over-year growth 2025-2030 (%)
Data Table on South Africa - Year-over-year growth 2025-2030 (%)

12.6.4 Turkey - Market size and forecast 2025-2030

Chart on Turkey - Market size and forecast 2025-2030 ($ million)
Data Table on Turkey - Market size and forecast 2025-2030 ($ million)
Chart on Turkey - Year-over-year growth 2025-2030 (%)
Data Table on Turkey - Year-over-year growth 2025-2030 (%)

12.6.5 Israel - Market size and forecast 2025-2030

Chart on Israel - Market size and forecast 2025-2030 ($ million)
Data Table on Israel - Market size and forecast 2025-2030 ($ million)
Chart on Israel - Year-over-year growth 2025-2030 (%)
Data Table on Israel - Year-over-year growth 2025-2030 (%)

12.7 South America - Market size and forecast 2025-2030

Chart on South America - Market size and forecast 2025-2030 ($ million)
Data Table on South America - Market size and forecast 2025-2030 ($ million)
Chart on South America - Year-over-year growth 2025-2030 (%)
Data Table on South America - Year-over-year growth 2025-2030 (%)
Chart on Regional Comparison - South America
Data Table on Regional Comparison - South America

12.7.1 Brazil - Market size and forecast 2025-2030

Chart on Brazil - Market size and forecast 2025-2030 ($ million)
Data Table on Brazil - Market size and forecast 2025-2030 ($ million)
Chart on Brazil - Year-over-year growth 2025-2030 (%)
Data Table on Brazil - Year-over-year growth 2025-2030 (%)

12.7.2 Argentina - Market size and forecast 2025-2030

Chart on Argentina - Market size and forecast 2025-2030 ($ million)
Data Table on Argentina - Market size and forecast 2025-2030 ($ million)
Chart on Argentina - Year-over-year growth 2025-2030 (%)
Data Table on Argentina - Year-over-year growth 2025-2030 (%)

12.7.3 Chile - Market size and forecast 2025-2030

Chart on Chile - Market size and forecast 2025-2030 ($ million)
Data Table on Chile - Market size and forecast 2025-2030 ($ million)
Chart on Chile - Year-over-year growth 2025-2030 (%)
Data Table on Chile - Year-over-year growth 2025-2030 (%)

12.8 Market opportunity by geography

Market opportunity by geography ($ million)
Data Tables on Market opportunity by geography ($ million)

13. Drivers, Challenges, and Opportunity

13.1 Market drivers

Growing infrastructure modernization and public works investments
Increasing urbanization and residential construction activity
Expanding demand from transportation network development projects

13.2 Market challenges

Raw material supply bottlenecks across quarry-to-construction supply chains
Stringent environmental permitting and quarry expansion restrictions
Volatility in diesel, explosives, and equipment operating costs

13.3 Impact of drivers and challenges

Impact of drivers and challenges in 2025 and 2030

13.4 Market opportunities

Advancing digital quarry management and data-driven operations
Increasing adoption of recycled aggregates in construction ecosystems
Growing consolidation through acquisitions and vertically-integrated business models

14. Competitive Landscape

14.1 Overview

14.2

Overview on criticality of inputs and factors of differentiation

14.3 Landscape disruption

Overview on factors of disruption

14.4 Industry risks

Impact of key risks on business

15. Competitive Analysis

15.1 Companies profiled

Companies covered

15.2 Company ranking index

15.3 Market positioning of companies

Matrix on companies position and classification

15.4 Breedon Group plc

Breedon Group plc - Overview
Breedon Group plc - Business segments
Breedon Group plc - Key offerings
Breedon Group plc - Segment focus
SWOT

15.5 Buzzi SpA

Buzzi SpA - Overview
Buzzi SpA - Business segments
Buzzi SpA - Key offerings
Buzzi SpA - Segment focus
SWOT

15.6 Carmeuse SA

Carmeuse SA - Overview
Carmeuse SA - Product / Service
Carmeuse SA - Key offerings
SWOT

15.7 CEMEX SAB de CV

CEMEX SAB de CV - Overview
CEMEX SAB de CV - Business segments
CEMEX SAB de CV - Key news
CEMEX SAB de CV - Key offerings
CEMEX SAB de CV - Segment focus
SWOT

15.8 Colas SA

Colas SA - Overview
Colas SA - Business segments
Colas SA - Key offerings
Colas SA - Segment focus
SWOT

15.9 CRH Plc

CRH Plc - Overview
CRH Plc - Business segments
CRH Plc - Key offerings
CRH Plc - Segment focus
SWOT

15.10 Granite Construction Inc.

Granite Construction Inc. - Overview
Granite Construction Inc. - Business segments
Granite Construction Inc. - Key news
Granite Construction Inc. - Key offerings
Granite Construction Inc. - Segment focus
SWOT

15.11 Heidelberg Materials AG

Heidelberg Materials AG - Overview
Heidelberg Materials AG - Business segments
Heidelberg Materials AG - Key offerings
Heidelberg Materials AG - Segment focus
SWOT

15.12 Holcim Ltd.

Holcim Ltd. - Overview
Holcim Ltd. - Business segments
Holcim Ltd. - Key news
Holcim Ltd. - Key offerings
Holcim Ltd. - Segment focus
SWOT

15.13 Knife River Corp.

Knife River Corp. - Overview
Knife River Corp. - Product / Service
Knife River Corp. - Key offerings
SWOT

15.14 LSR Group

LSR Group - Overview
LSR Group - Product / Service
LSR Group - Key offerings
SWOT

15.15 Martin Marietta Materials Inc.

Martin Marietta Materials Inc. - Overview
Martin Marietta Materials Inc. - Business segments
Martin Marietta Materials Inc. - Key offerings
Martin Marietta Materials Inc. - Segment focus
SWOT

15.16 Taiheiyo Cement Corp.

Taiheiyo Cement Corp. - Overview
Taiheiyo Cement Corp. - Business segments
Taiheiyo Cement Corp. - Key offerings
Taiheiyo Cement Corp. - Segment focus
SWOT

15.17 Votorantim SA

Votorantim SA - Overview
Votorantim SA - Product / Service
Votorantim SA - Key offerings
SWOT

15.18 Vulcan Materials Co.

Vulcan Materials Co. - Overview
Vulcan Materials Co. - Business segments
Vulcan Materials Co. - Key offerings
Vulcan Materials Co. - Segment focus
SWOT

16. Appendix

16.1 Scope of the report

Market definition
Objectives
Notes and caveats

16.2 Inclusions and exclusions checklist

Inclusions checklist
Exclusions checklist

16.3 Currency conversion rates for US$

16.4 Research methodology

16.5 Data procurement

Information sources

16.6 Data validation

16.7 Validation techniques employed for market sizing

16.8 Data synthesis

16.9 360 degree market analysis

16.10 List of abbreviations

Research Methodology

Technavio presents a detailed picture of the market by way of study, synthesis, and summation of data from multiple sources. The analysts have presented the various facets of the market with a particular focus on identifying the key industry influencers. The data thus presented is comprehensive, reliable, and the result of extensive research, both primary and secondary.

INFORMATION SOURCES

Primary sources

  • Manufacturers and suppliers
  • Channel partners
  • Industry experts
  • Strategic decision makers

Secondary sources

  • Industry journals and periodicals
  • Government data
  • Financial reports of key industry players
  • Historical data
  • Press releases

DATA ANALYSIS

Data Synthesis

  • Collation of data
  • Estimation of key figures
  • Analysis of derived insights

Data Validation

  • Triangulation with data models
  • Reference against proprietary databases
  • Corroboration with industry experts

REPORT WRITING

Qualitative

  • Market drivers
  • Market challenges
  • Market trends
  • Five forces analysis

Quantitative

  • Market size and forecast
  • Market segmentation
  • Geographical insights
  • Competitive landscape

Interested in this report?

Get your sample now to see our research methodology and insights!

Download Now

Frequently Asked Questions

Aggregates market growth will increase by USD 74541.9 million during 2026-2030.

The Aggregates market is expected to grow at a CAGR of 5.8% during 2026-2030.

Aggregates market is segmented by Application (Concrete, Road base and coverings, Others) Product (Crushed stone, Sand and gravel, Others) End-user (Residential, Commercial, Industrial)

Argos Ltd., Boral Ltd., Breedon Group plc, Buzzi SpA, Carmeuse SA, CEMEX SAB de CV, Colas SA, CRH Plc, Fisher Sand and Gravel Co., Granite Construction Inc., Heidelberg Materials AG, Holcim Ltd., Irving Materials Inc., Knife River Corp., LSR Group, Martin Marietta Materials Inc., Summit Materials Inc., Taiheiyo Cement Corp., Tarmac Holdings Ltd., Titan SA, Vicat S.A., Votorantim SA, Vulcan Materials Co. are a few of the key vendors in the Aggregates market.

APAC will register the highest growth rate of 56.7% among the other regions. Therefore, the Aggregates market in APAC is expected to garner significant business opportunities for the vendors during the forecast period.

China, India, Japan, South Korea, Indonesia, Australia, Germany, UK, France, Italy, Spain, The Netherlands, US, Canada, Mexico, Saudi Arabia, UAE, South Africa, Turkey, Israel, Brazil, Argentina, Chile

  • Growing infrastructure modernization and public works investments is the driving factor this market.

The Aggregates market vendors should focus on grabbing business opportunities from the Application segment as it accounted for the largest market share in the base year.
RIA - Research AI Assistant
Ask RIA
